Your LTV figure lands somewhere different every time you run it. The customers are the same and the formula is the same, yet the result changes. What changes sits before the formula. How many days you close at, how finely you cut, which day you start counting from. Those three get decided again on every run, so the same formula opens up by as much as a factor of two.
Contents
TL;DR#
- With the same 400 customers and the same formula, closing at 90 days gives 12,000 yen per customer and closing at 180 days gives 24,000 yen
- The formula itself returns a figure grounded in measured data. What opens the result up by a factor of two are the three conditions set before it
- Split the 180-day window by traffic source and referral, holding only 30 customers, appears to lead at 49,333 yen
- Take one large order out of that referral group and it becomes 20,000 yen, landing exactly level with ads
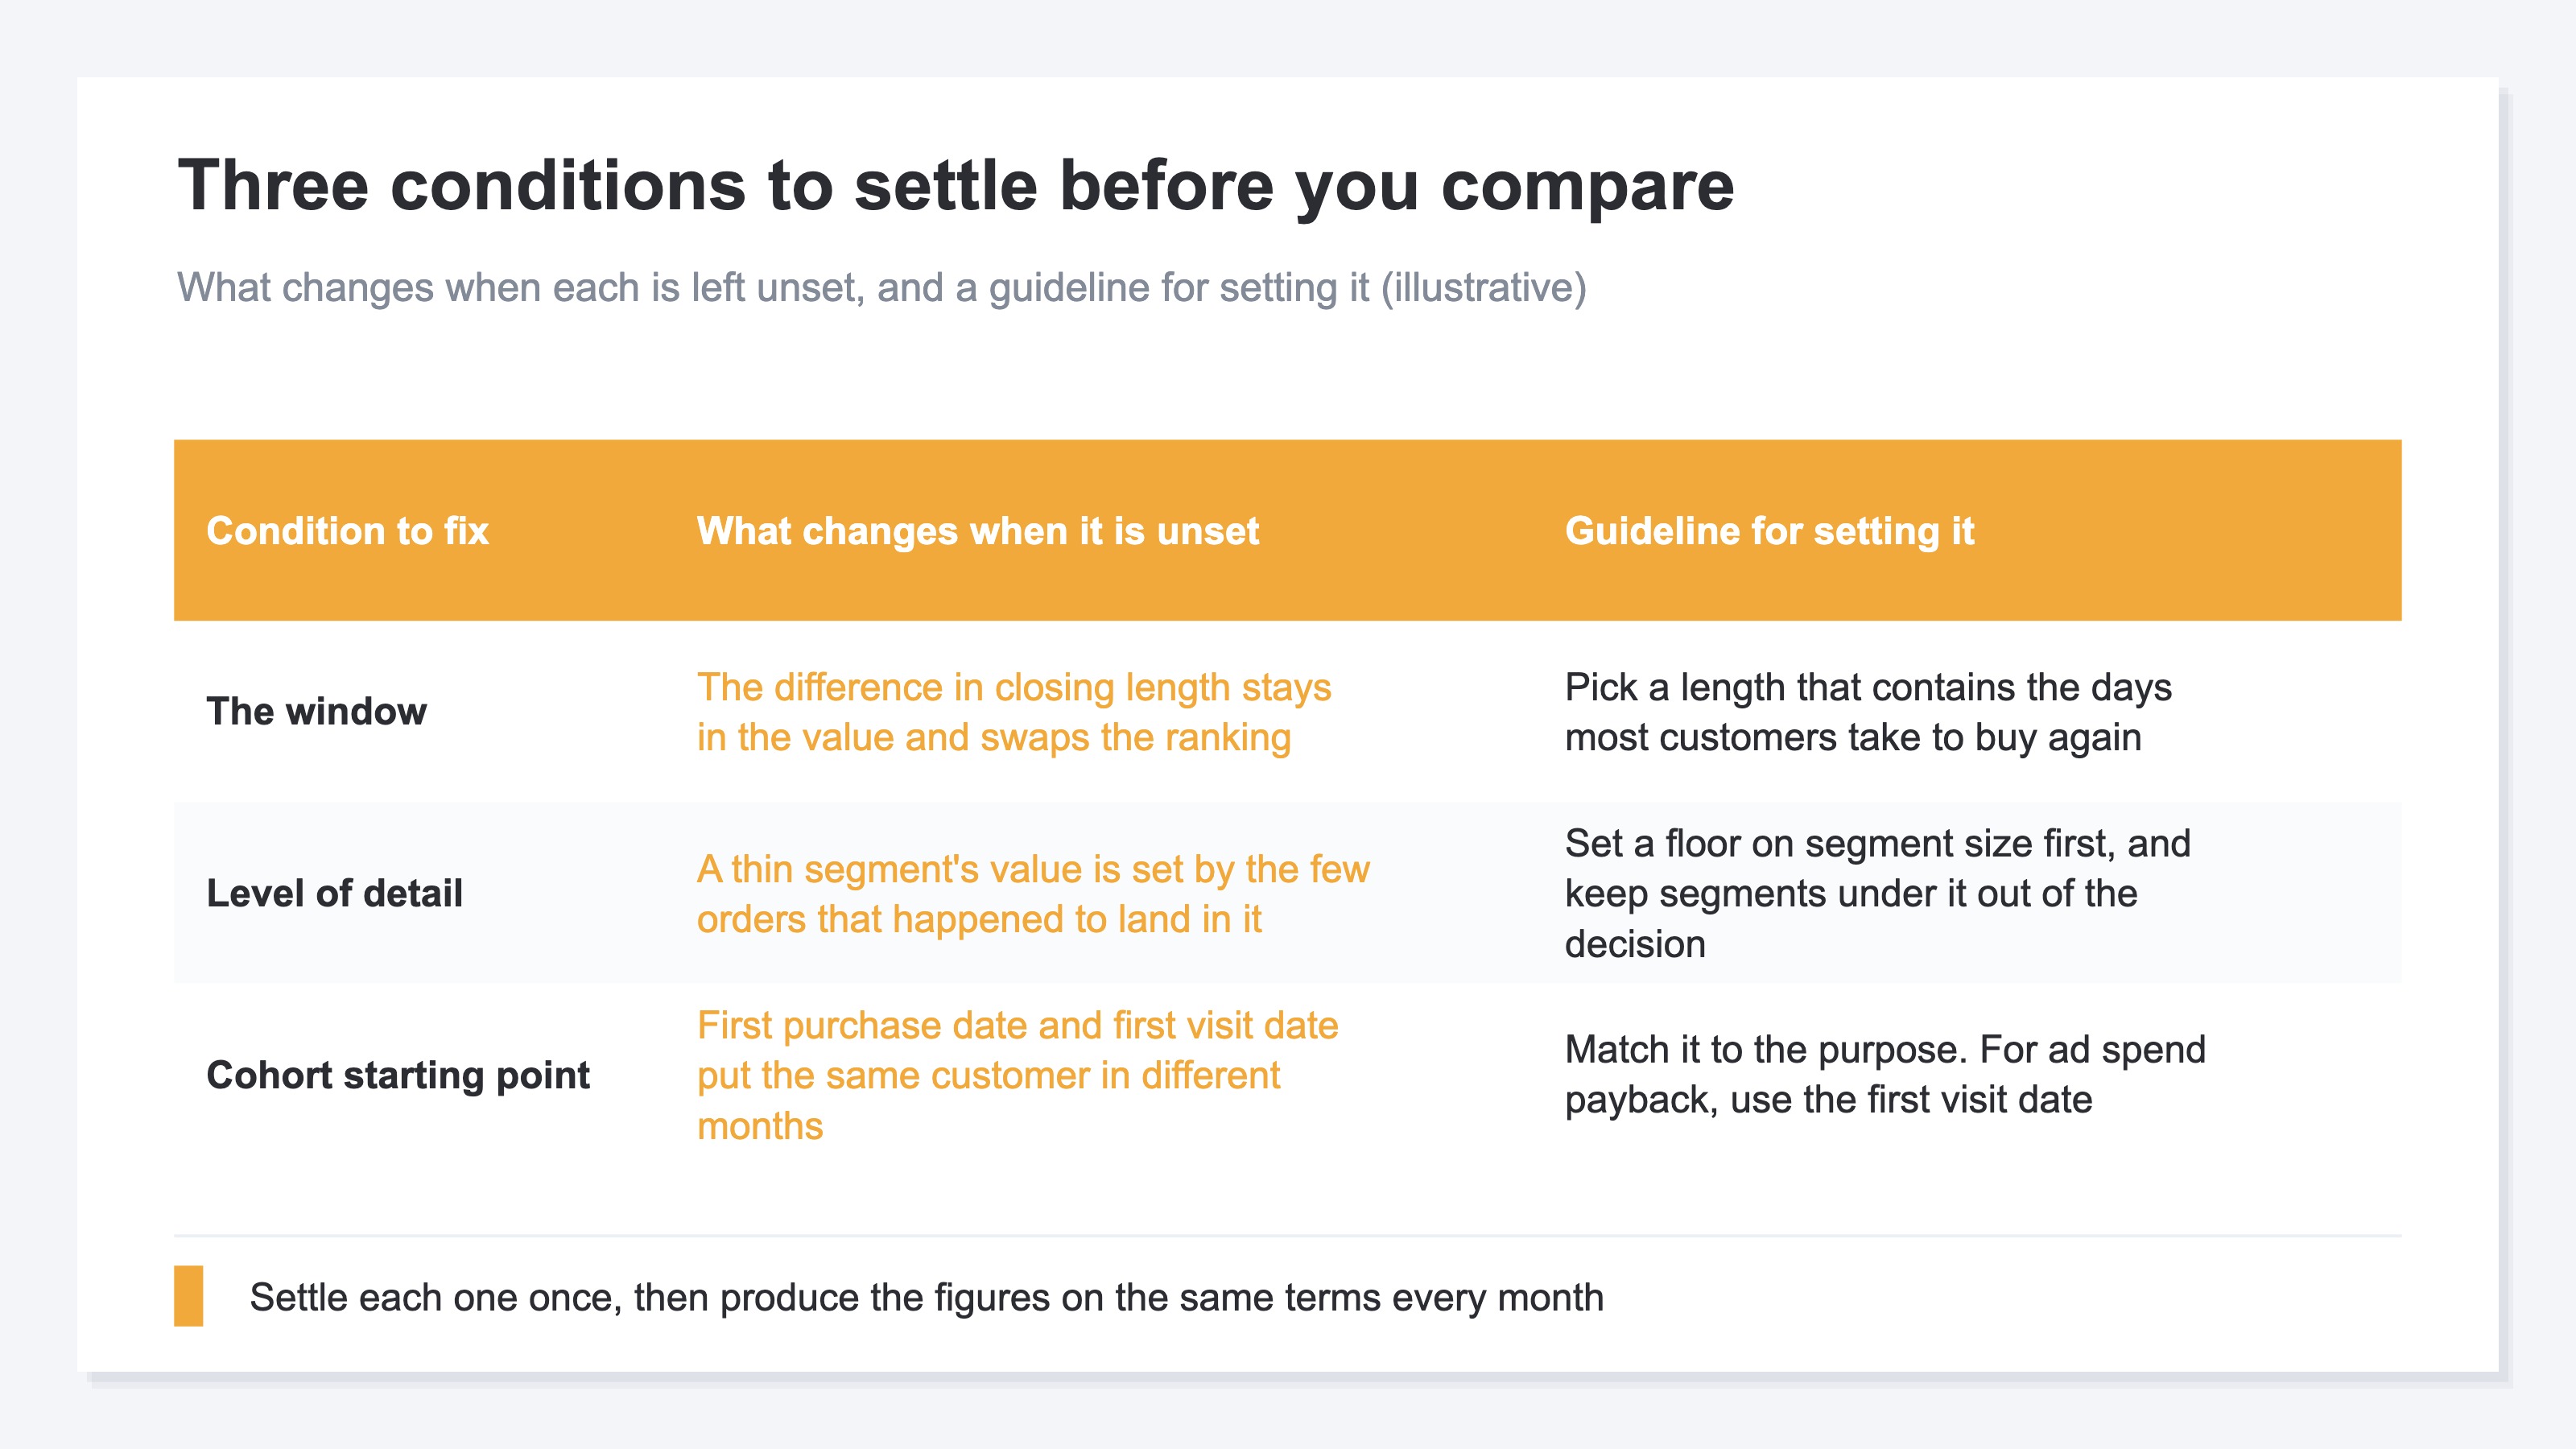
- Fix three things — the window, the level of detail, and the cohort's starting point — and set a floor on how many customers a segment needs
1. The Same Formula Doubles When the Window Changes#
With the same customers and the same formula, closing at 90 days rather than 180 days is enough on its own to double the per-customer figure.
LTV is the total revenue one customer brings in over the course of the relationship [1]. A cohort is the unit you get by treating everyone who first bought in the same month as one group. The calculation itself is covered in How to calculate LTV, so this article deals with what happens before the numbers go into the formula.
How well a business holds on to its customers has long been shown to weigh heavily on profit [2]. That is exactly why the per-customer figure gets tracked — but when LTV comes up internally, the value your own spreadsheet returns, the value the analytics screen returns and the value the ad platform returns all sit on different closing dates and different levels of detail. Three figures arrive under one name, so the question turns into which one is right. What to settle first is how many days each of them added up.
Take a worked example. Treat the 400 customers who first bought in March 2026 as one cohort, and divide their cumulative revenue by the number of customers. Close at the 90-day mark and cumulative revenue of 4,800,000 yen gives 12,000 yen per customer. Close at the 180-day mark and 9,600,000 yen gives 24,000 yen. Exactly double.
Both are arithmetically correct, and neither contains an error. What keeps them from being comparable is that neither carries a note saying how many days it was closed at. Write the number of days beside each one and they land on the same footing.
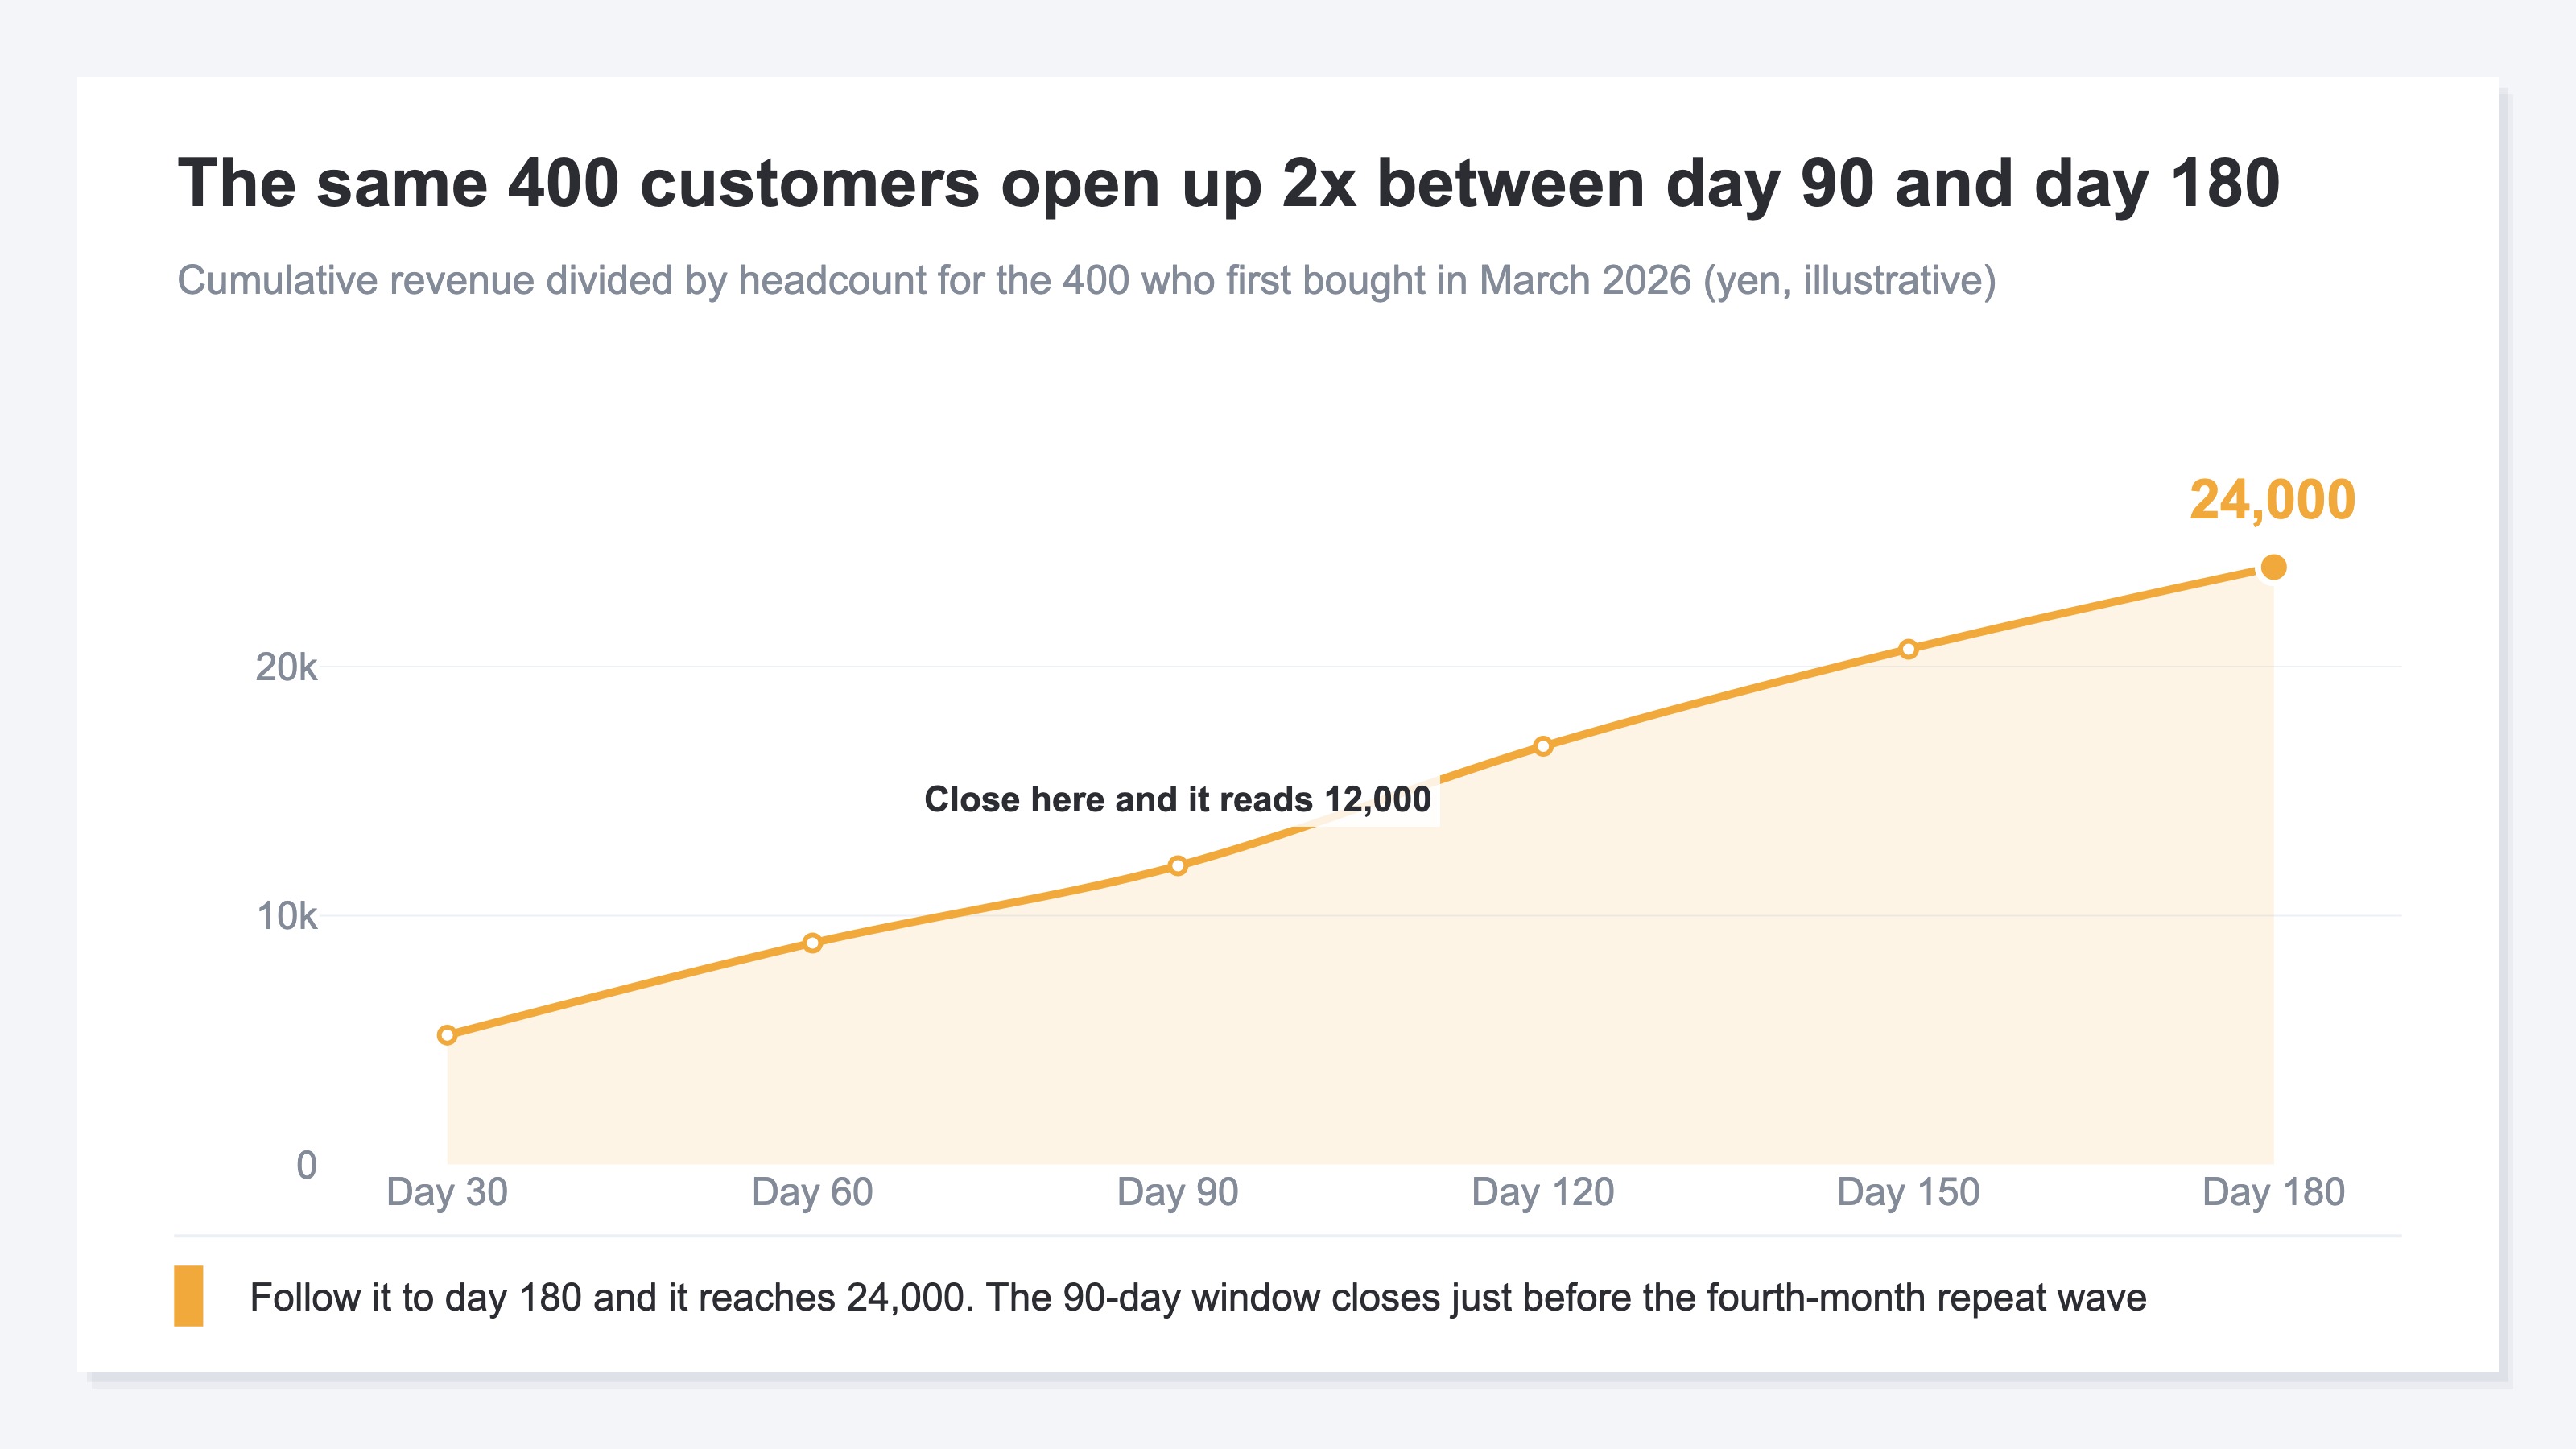
The difference in how you close reaches the decision when channels pay back at different speeds. A campaign launched last month and organic search built over years do not share the same interval between a first purchase and the next one. Put a 90-day window on the slower one and revenue that has not happened yet gets counted as zero. Decide to pull out on that basis and you let go of revenue that would have come back by day 180.
2. The Finer the Cut, the More One Order Decides#
Lower the level of detail and fewer customers land in each segment, so a small number of orders produce the result.
Hold that 180-day window and split the same 400 customers by traffic source. Organic search has 180 customers and 4,320,000 yen in cumulative revenue, or 24,000 yen each. Ads have 190 customers and 3,800,000 yen, or 20,000 yen each. Referral has 30 customers and 1,480,000 yen, or 49,333 yen each. Add the three and you are back at 9,600,000 yen across 400 customers, the same 24,000 yen overall.
On the numbers, referral leads. Per customer it is more than double organic search, which reads as grounds for moving budget toward referral acquisition.
Now open up those 30 referral customers. One of them placed a single 900,000 yen bulk order. Take that one order out and 580,000 yen across 29 customers gives 20,000 yen. Exactly level with ads, and the lead is gone. The gap between the two readings is 2.47x.
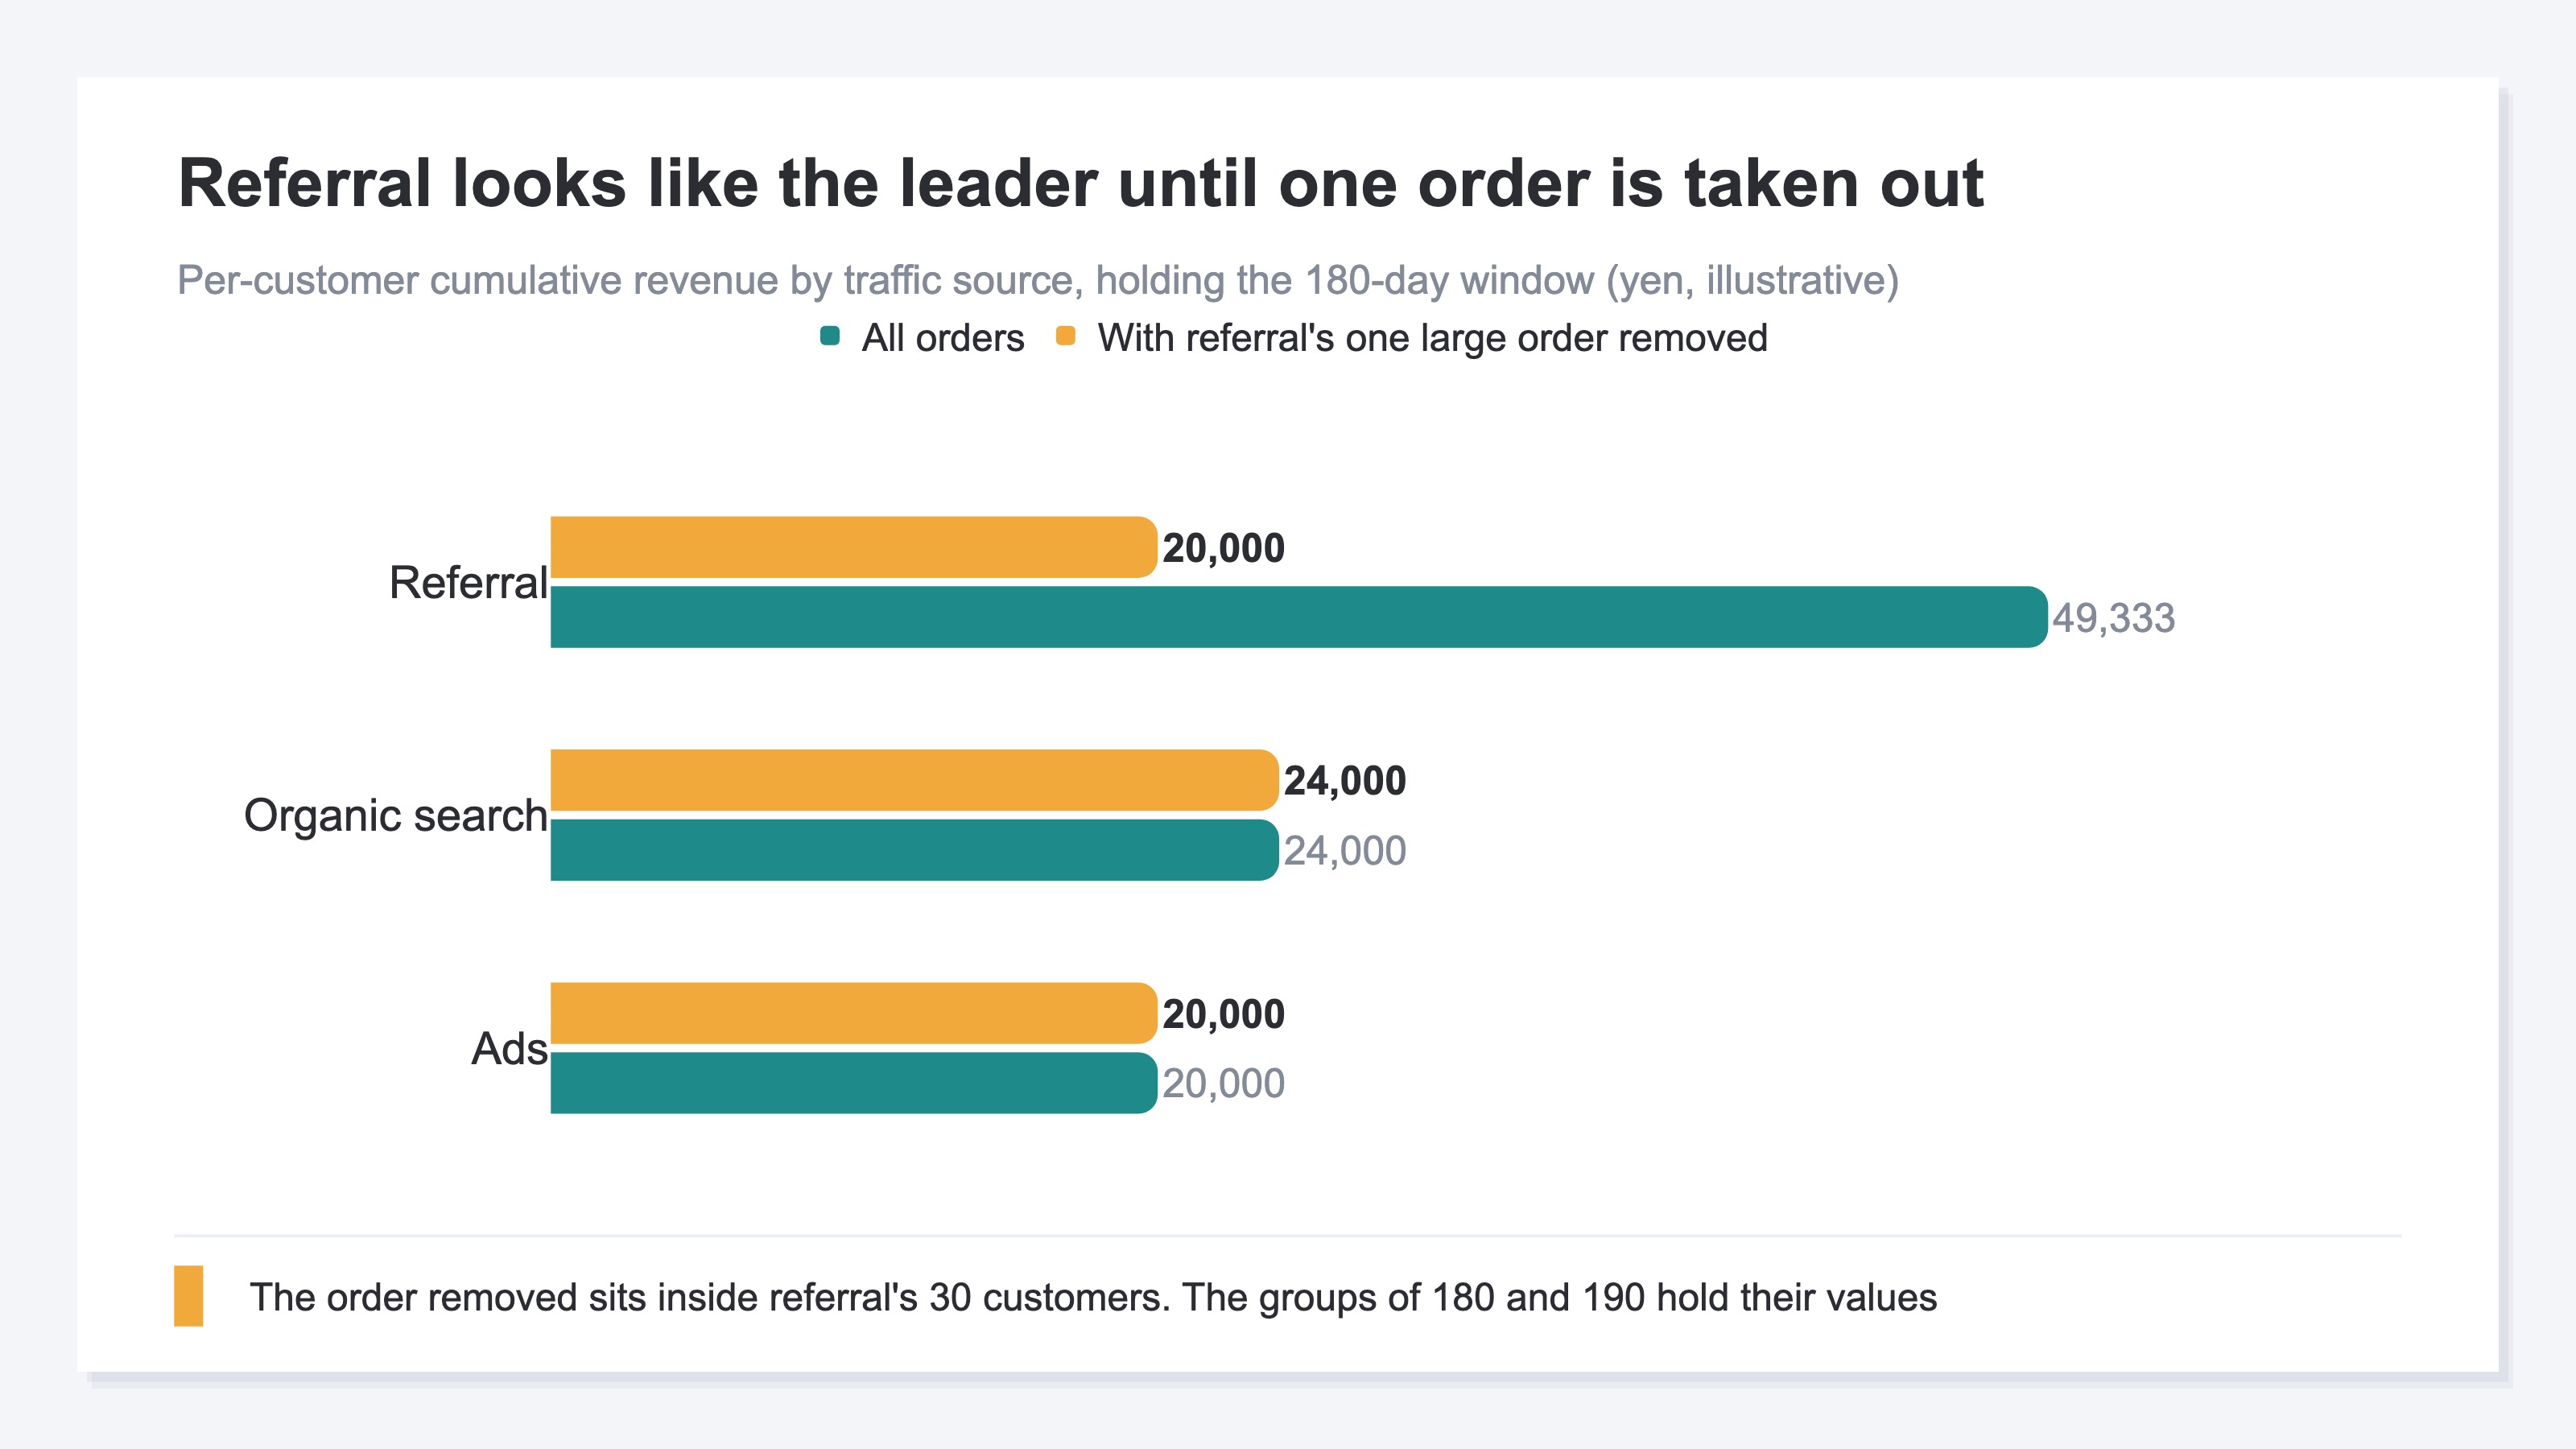
You can run the same operation on organic search and on ads, but with 180 and 190 customers the ranking survives having one order pulled out. The more customers a segment holds, the smaller the share any single order takes in the result.
Cutting finely helps the decision in itself. By country, by the device used on the first visit, by product category. More ways to cut make the place to act more specific. But every cut leaves fewer customers per segment. Past a certain point, a segment's figure reflects the handful of orders that happened to land in it rather than anything about those customers. That boundary does not announce itself, so set the floor on segment size before you cut.
How the makeup of revenue shifts between new and returning customers is covered in New versus returning revenue, and how to read a repeat rate against the average is covered in Average ecommerce repeat rate.
3. Fix Three Conditions Before You Compare#
Ahead of any work on precision, settle the arrangement that produces the figure on the same terms every time.
There are three things to fix. The first is the window. Decide on 90 days or 180 days, and produce every later figure at that same length. When you change the window, reproduce the past figures at the new length too. The second is the level of detail. Set how finely you divide, and set a floor on how many customers a segment needs. A segment under the floor still produces a figure, and that figure stays out of the decision. The third is the cohort's starting point. Count from the day of the first purchase, or from the day of the first visit to the site. Those two pull further apart the more a free sign-up or a document request sits in the middle.
Choosing the starting point is also choosing an attribution definition. For the same visitor, reading the traffic source of the first visit to the site and reading the traffic source of the visit where the purchase happened split the figures into separate reports [3]. The need to line up windows shows most sharply when you set the figure against acquisition cost. The cost of acquiring one customer is called CAC, and a widely used reading asks whether LTV is three times CAC. Build the numerator from 180 days and the denominator from this month's ad spend, and the ratio loses its basis. That benchmark is covered in What CAC is, and how it differs from grouping customers by their current state is covered in RFM analysis.
Everything to this point can be settled by hand. It is in producing those settled conditions again every month, source by source, that they drift a little at a time.
There is a second point where the materials run out: the moment you split by traffic source. What an order record holds is when, who and how much. Whether the customer was first brought in by organic search or by ads is not written on the order side. What is absent never appears in a listing, so nothing on screen tells you it is missing. It surfaces when you set out to split by traffic source and your hand stops.
Record the traffic source of the purchase up front, and acquisition efficiency by channel can be produced again on the same terms every month.
RevenueScope solution
What RevenueScope covers is recording the traffic source at the moment a purchase happens, and producing the same calculation again every month.
The traffic source of the visit where the purchase happened is held still, channel by channel. The channel list carries sessions, revenue and RPS (revenue per session). Open one channel and it drops to the utm_campaign level, where AOV (average revenue per order) and CVR sit on the same screen. For periods where ad spend was registered by year, month and channel through the form or a CSV, ROAS lines up on the ad band. Purchases that never tied to a traffic source stay on a separate row as unattributed revenue.
The attributes tab of the same dashboard shows sessions, revenue, RPS, AOV and CVR split between new and returning visitors. The test is a return on a different day: a visitor who already has a session on an earlier calendar day counts as returning.
Channel efficiency at a fictional store (illustrative)
| Channel | Sessions | Revenue | RPS |
|---|---|---|---|
| Google Search | 4,820 | 1,180,000 yen | 245 yen |
| Meta | 3,640 | 0 yen | 0 yen |
| Direct | 2,110 | 640,000 yen | 303 yen |
| Referral | 890 | 210,000 yen | 236 yen |
Note: this table is one worked example of how to read the screen. The sample store behind the CTA swaps its sample data every day, so the values you actually see differ from this table.
Meta sits second on sessions with 0 yen in revenue. Those 3,640 visits tie to not a single purchase. Before any work on refining the per-customer figure, what shows first is that the quality of the traffic being bought splits by channel. The material for deciding where budget goes is here first.
FAQ#
Frequently Asked Questions#
Q. Which window should I choose, 90 days or 180 days?
A. Decide from the repeat-purchase interval of what you sell. Find how many days it takes most customers to buy a second time, and pick a length that contains it. Once it is set, reproduce whatever you compare against at the same length. Being aligned matters more to the decision than the number of days itself.
Q. Should the cohort start from the first purchase date or the first visit date?
A. Choose from the purpose of the decision. To look at ad spend payback, the first visit date corresponds better, because that is where the cost occurred. To look at how a product gets used or how repeat purchases cycle, use the first purchase date. Either way, keep producing figures from the same starting point afterwards.
Q. How many customers should the floor for a segment be?
A. There is no published benchmark I can point to. In the worked example, a 30-customer segment opened up by 2.47x on whether a single order was present. As a method, take the largest order out of the segment, watch how much the figure changes, and raise the floor if the ranking swaps.
Q. Does a longer window simply give a more accurate figure?
A. The figure grows the longer you go, but what stays usable for a decision is the period that has actually closed. With a 180-day window, customers who first bought within the last 180 days are not in it yet. The longer the window, the later recent acquisition shows up in the result. Set the length against how quickly you need to decide.
Summary#
When your LTV figure comes out different every time, settle how many days it was closed at before you go back over the formula. In the worked example, the same 400 customers and the same formula gave 12,000 yen at 90 days and 24,000 yen at 180 days. Split that same 180-day window by traffic source and the 30-customer referral group appeared to lead at 49,333 yen, dropping to 20,000 yen once one large order was taken out.
The window, the level of detail, and the cohort's starting point. Fix those three first, set the floor on segment size alongside them, and next month's figures come out on the same terms. Record the traffic source of each purchase on top of that, and acquisition efficiency can be compared channel by channel in the same shape every month.
See which ads actually drive revenue, at a glance
Free up to 2,000 sessions/month, AI connection included. No credit card required. Up and running in 5 minutes.