"Is our repeat customer rate high or low compared with the average?" — plenty of people arrive at a search box with exactly that question.
But an average tells you less than you would expect. Repeat rates move by an order of magnitude with the business model, and "we clear the average" tends to end as reassurance rather than a next move. What actually changes decisions is splitting new and returning customers by revenue and seeing how much each side earns. This article answers the benchmark question first, then covers what to watch in the definition. From there it lays out why revenue reads better than rate, and why the gap comes from purchase rate rather than order value.
Contents
TL;DR#
- The repeat customer rate people quote sits around 30–40%. Large-scale purchase data reports closer to 20%, so the quoted benchmark and the measured one are some distance apart
- Repeat rates move by an order of magnitude with the business model. Buy-once goods barely repeat at all, while subscription products can put close to 70% of orders on a second or later purchase
- Comparing against an average is only the entrance. What you can act on is revenue split between new and returning customers. In the sample store, revenue per visit differs by about 20x
- And that gap comes from purchase rate, not order value. Returning customers are efficient not because they spend more per order but because they buy when they come
1. What Is the Average Repeat Customer Rate?#
The figure quoted for ecommerce as a whole is around 30–40%. It does not transfer to your own store as it stands.
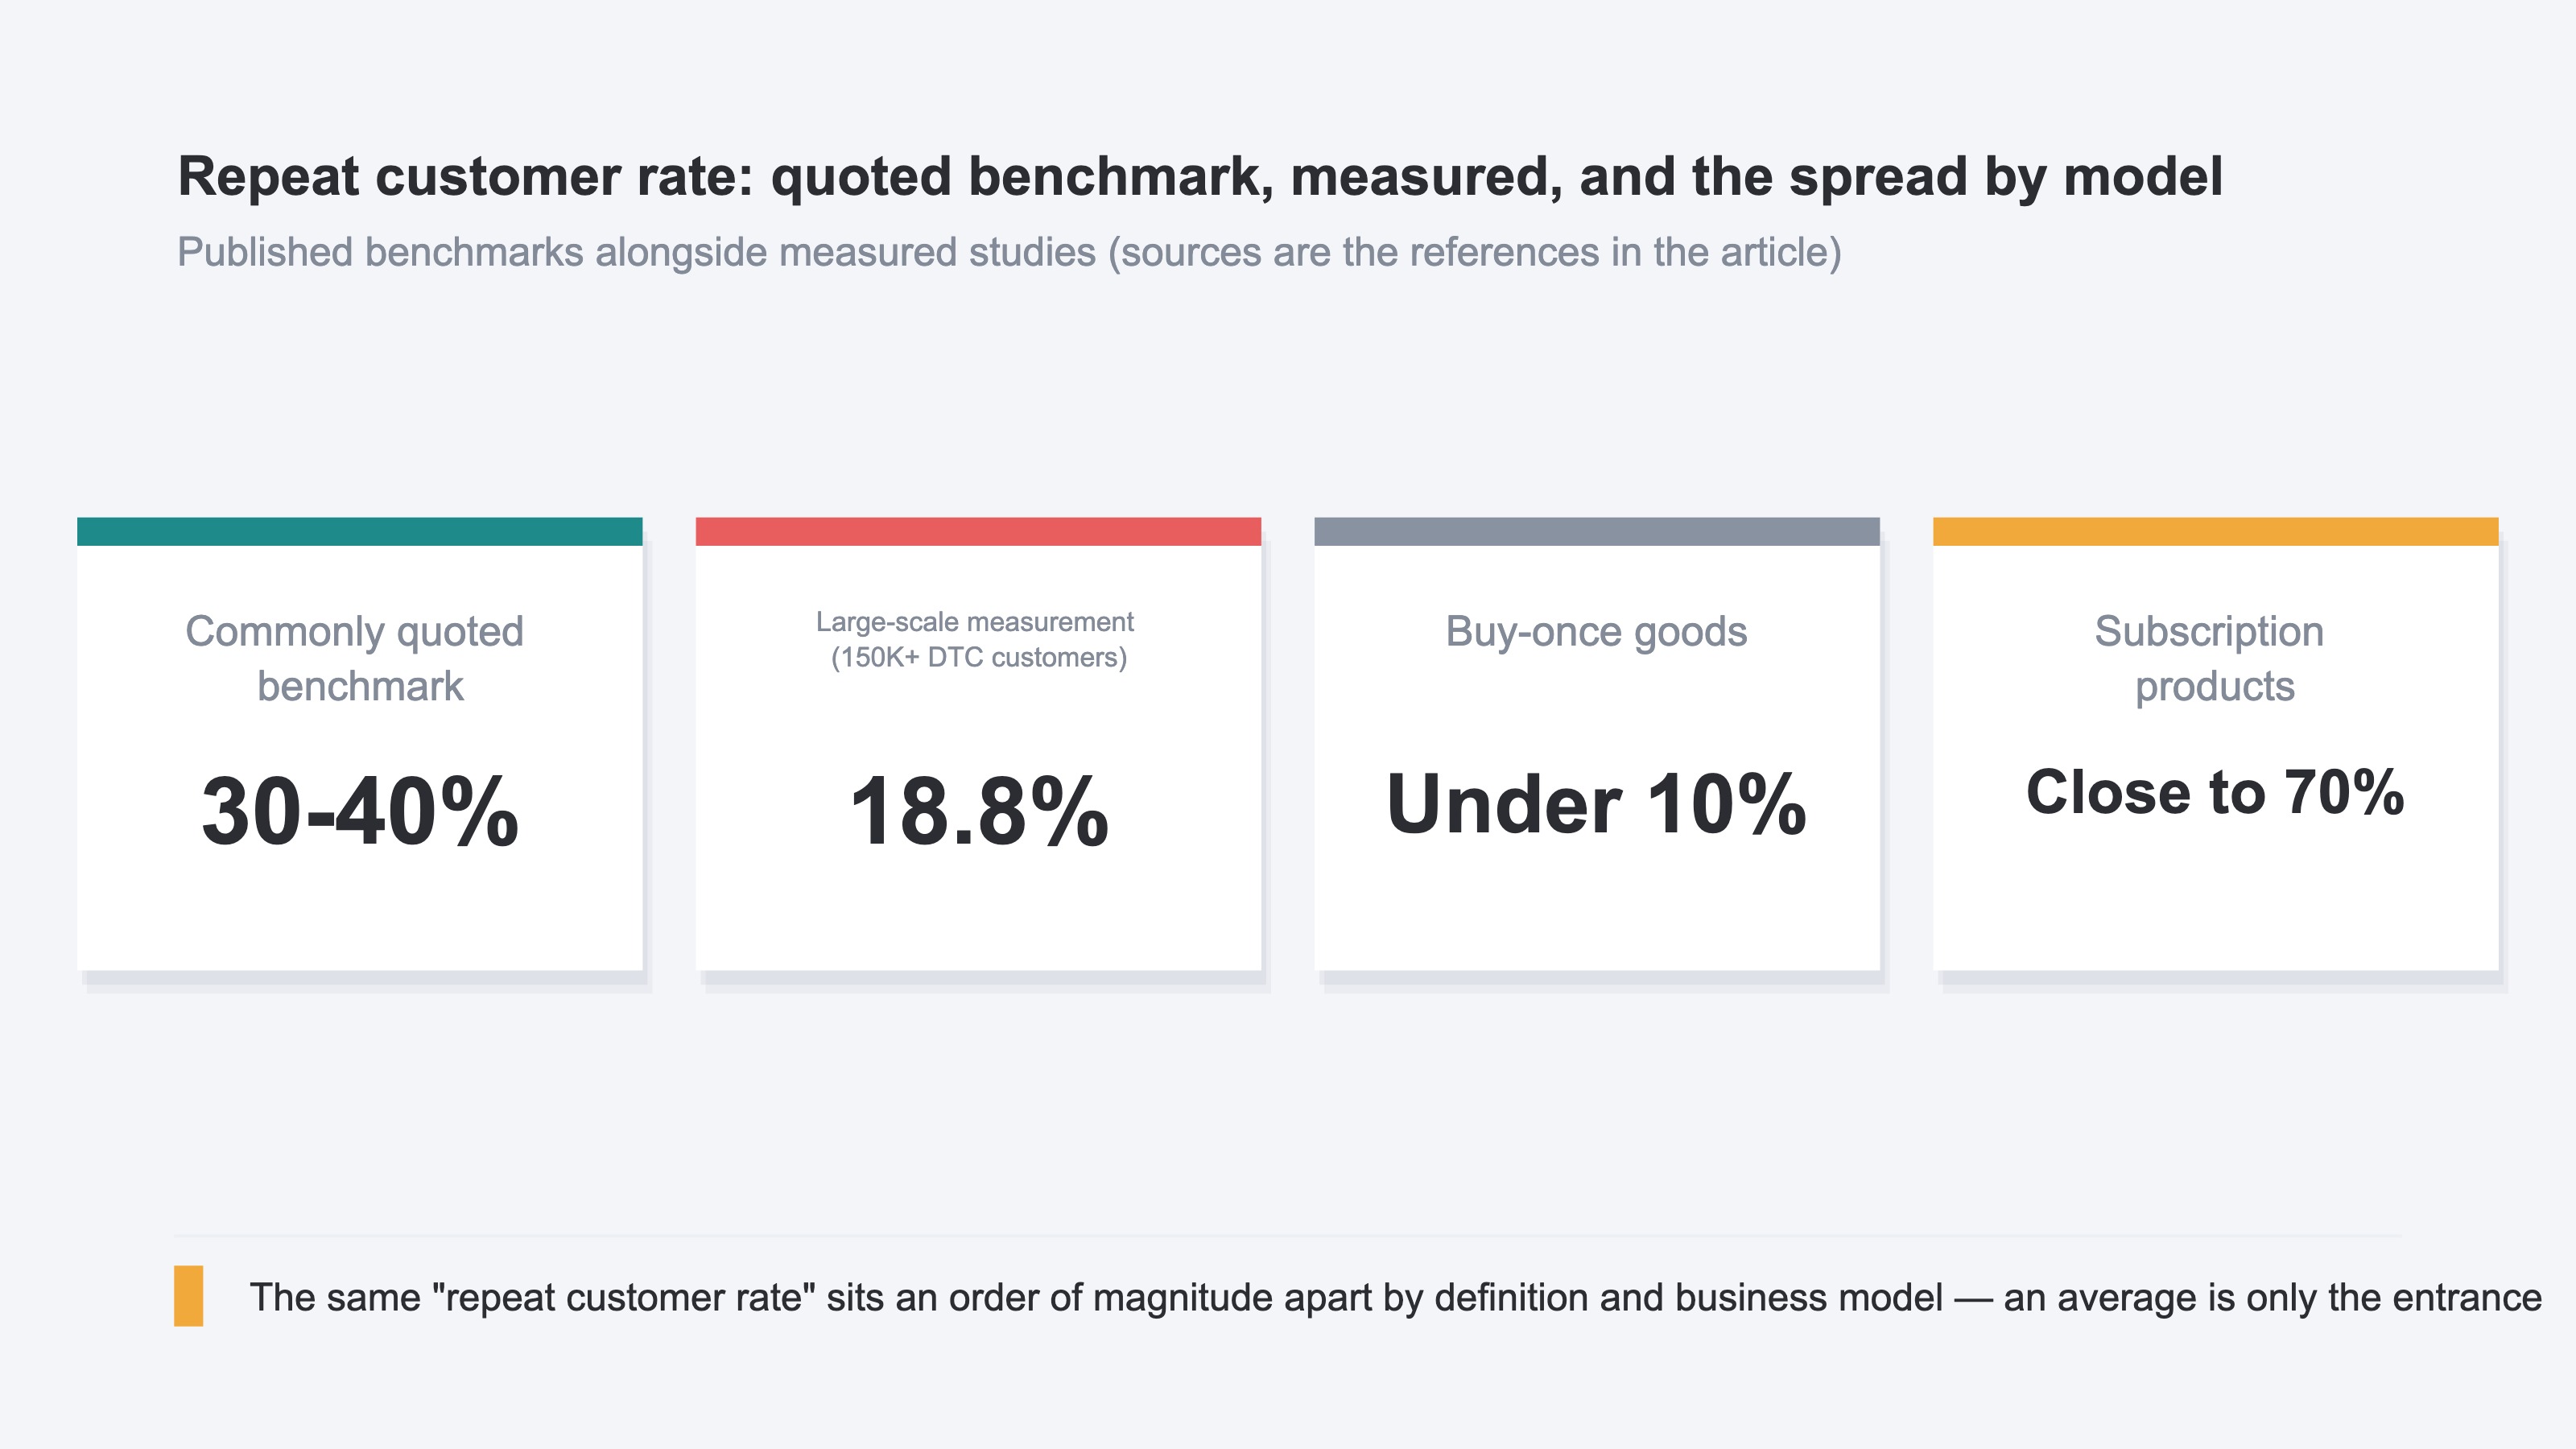
Start with the numbers that get quoted most often. A Japanese ecommerce consultancy puts ecommerce overall near 30%, apparel at 35% and cosmetics around 50%, as a set of industry benchmarks[1]. English-language write-ups land in a similar place: an ecommerce average of 25–30%, with anything under 20% treated as room to improve[2]. Read that far and the pull is to check where you sit.
Aggregate actual purchase data at scale, though, and the figure comes out lower. A study covering more than 150,000 customers across DTC brands found that 18.8% bought a second time within 365 days[3]. Roughly eight in ten stopped at a single order. That is how far the quoted benchmark sits from the measured one.
They diverge this much because "repeat customer rate" points at different things under different conditions. The denominator moves it (all customers, or only those who bought for the first time in the window). So does the window you aggregate over (30 days or a year). Above all, the business model moves it. For buy-once goods — the kind of tool you own for life — repeats barely happen at all, and the rate does not reach 10%. For consumables and subscription products, close to 70% of orders can be repeat purchases. The same phrase, an order of magnitude apart.
So clearing the industry average is reassurance and nothing more. What matters is knowing what counts as normal for your own structure. The average is only the entrance. Moves that lift the rate itself are laid out separately in how to raise ecommerce repeat rate.
2. Revenue Beats Rate: Returning Visits Earn About 20x#
Instead of lining repeat rate figures up against each other, look at how much revenue one visit generates for returning customers versus new ones. That reads straight into what to do next.
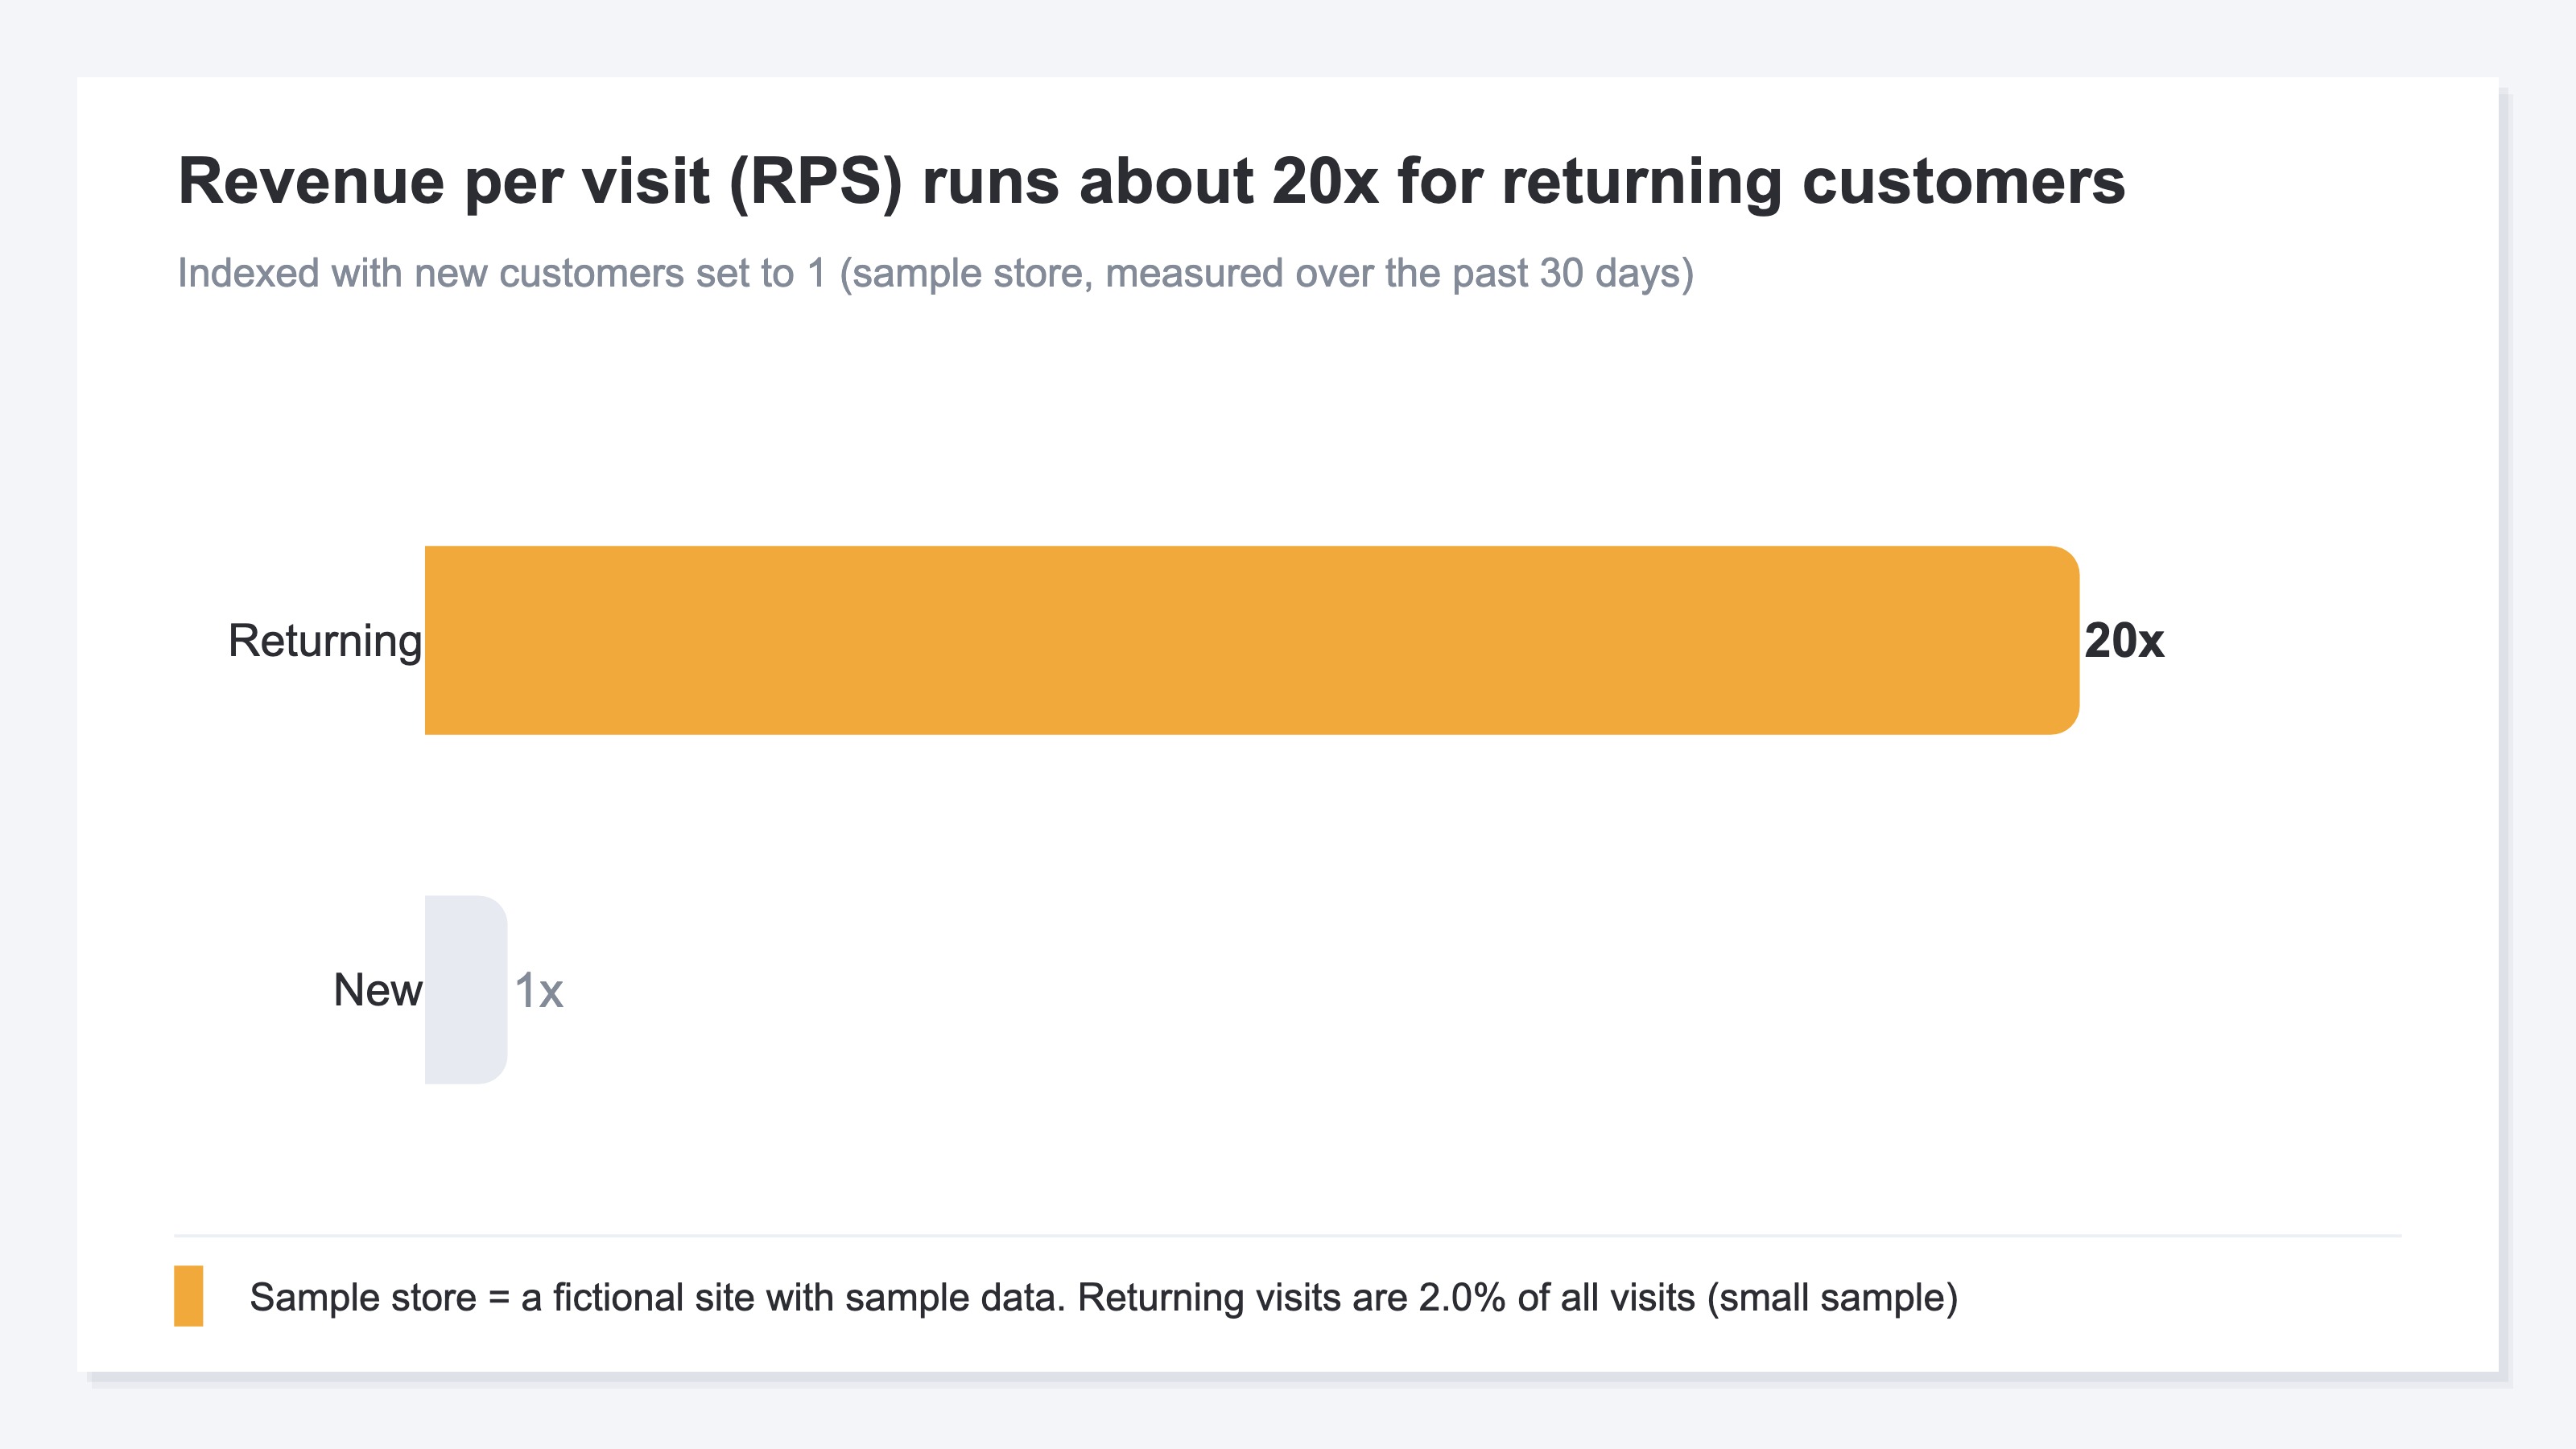
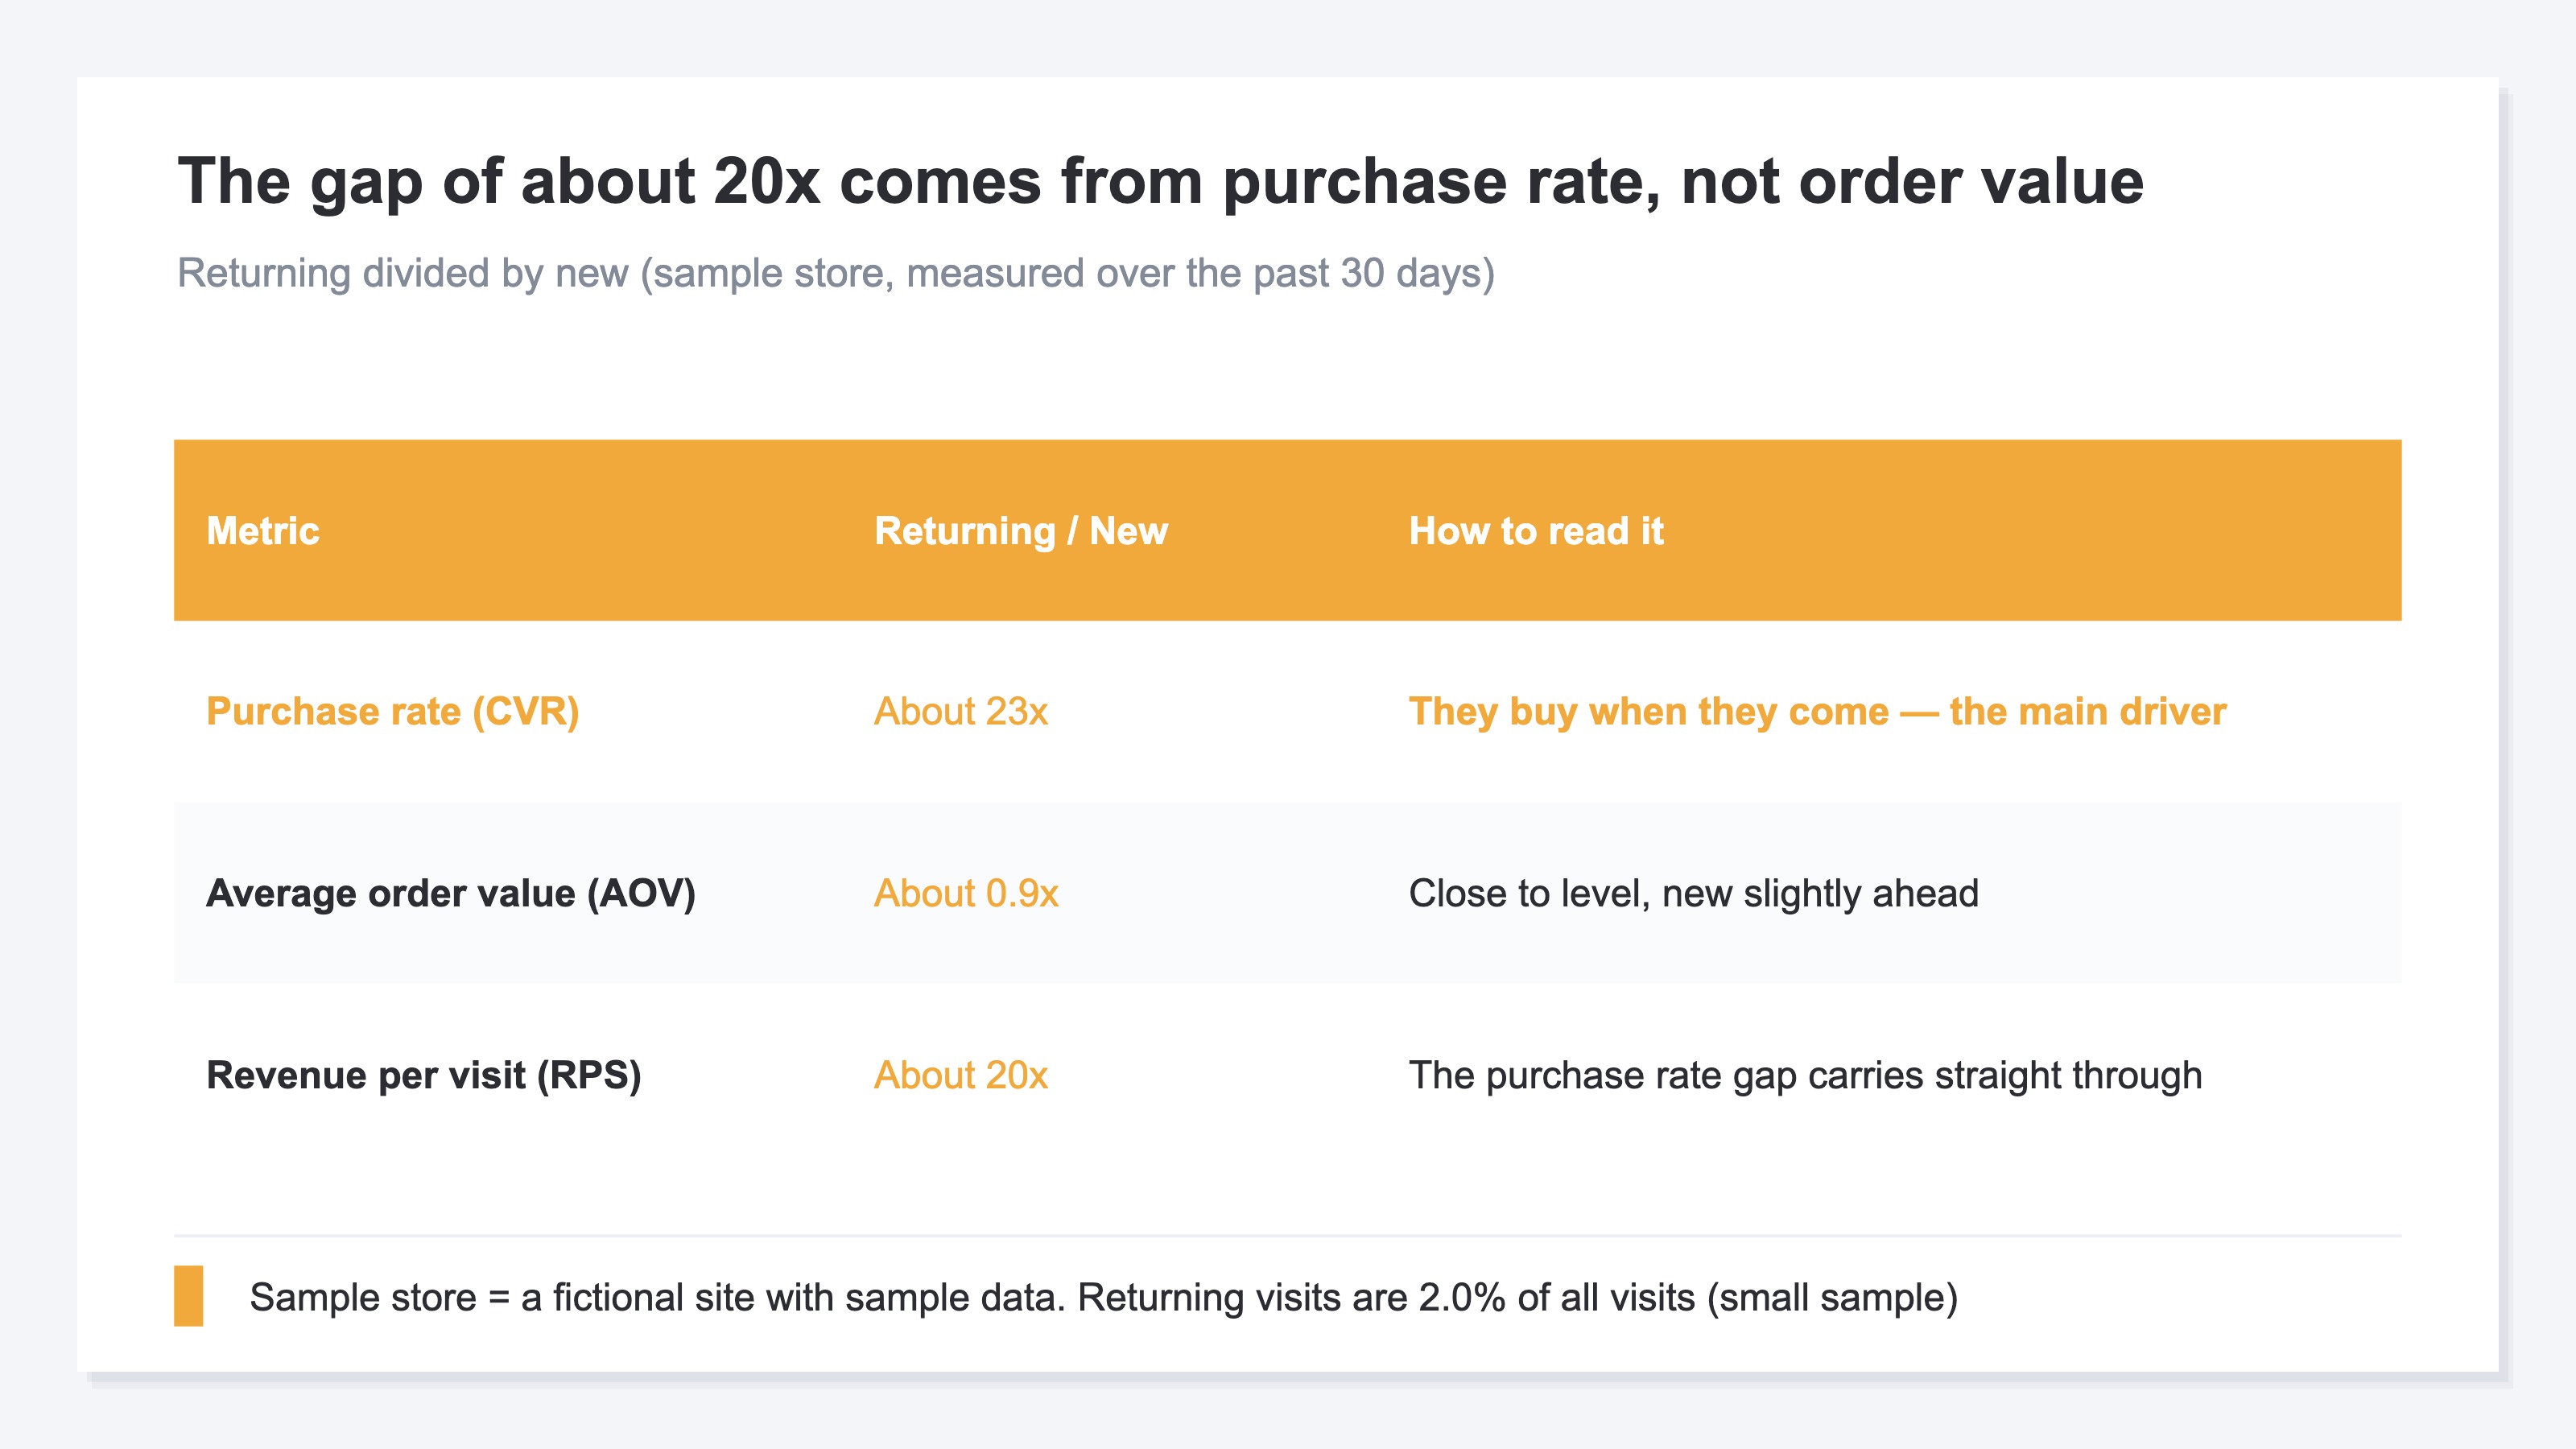
The measure for this is revenue per visit (RPS). RPS divides revenue by visits and shows how much revenue a single visit produced on average. In the sample store (a fictional site with sample data), over the past 30 days, RPS for returning customers ran about 20x that of new ones. Before any rate gets compared, one visit earns that differently.
That multiple cannot be taken at face value. Returning visits are only 2.0% of the total in the sample store (22 out of 1,081), and with a base that small a single outlier moves the figure a long way. The smaller the store, the more a handful of big regulars lift both the rate and the revenue, and the average bends easily. So treat the multiple itself as something that varies a great deal by store. What to hold onto here is not "about 20x" as a value but that rate alone hides how differently one visit earns.
Rate and revenue efficiency are separate things. A repeat rate above the average tells you nothing about how much revenue those returning customers generate. Whether winning them back is worth much is decided by revenue efficiency, not by rate. Once that is visible, the move changes. Before "lift order value" comes "stop leaking the efficient returning customers you already have." Order value itself is covered in the basics of average order value.
3. The Gap Comes from Purchase Rate, Not Order Value#
The gap of about 20x is not a gap in order value. Order value is close to level — if anything, new customers sit slightly higher. Almost all of the gap comes from purchase rate.
Break the sample store's numbers apart. Average order value (AOV), the mean amount of a single purchase, was almost the same for returning and new customers. As a multiple it came to about 0.9x, with new customers marginally ahead. Purchase rate (CVR) — the share of visits that ended in a purchase — was about 23x for returning customers. The gap of about 20x in revenue per visit (RPS) is very nearly explained by that difference in purchase rate. Not the amount, but the probability of buying.
Put the other way around, returning customers are not efficient because they spend more. They are efficient because they buy when they come. If that holds, the move is not to push order value but to build the mechanism that brings buyers back once more. Comparing against an average never produces that conclusion. It appears only once revenue is split between new and returning and broken down as far as purchase rate and order value.
The problem is that keeping this breakdown going is heavy. Line up the definition of where new ends and returning begins, exclude automated programs (bots), then produce CVR, AOV and RPS for each side together. GA4's standard reports do not hand you this single view[4]. The first pass is doable; lining the conditions up the same way after every campaign, and comparing month after month, is not. The steps themselves are not difficult — the cost of repetition is what ends it. That is the single biggest reason analysis never settles in. How to split new from returning, and the measurement traps that inflate the "new" side, are covered in detail in splitting revenue by new vs returning. If you want to cut customers finer still, RFM analysis is the next step.
RevenueScope solution
Try to cut new from returning by revenue and you arrive at the same wall every time. Line up the definitions, exclude automated programs (bots), then put revenue per visit (RPS), purchase rate (CVR) and average order value (AOV) into one table, and line it all up again every month to compare. That is where it gets heavy.
RevenueScope automates that monthly repetition. It splits new from returning and displays sessions, revenue, purchase rate (CVR), average order value (AOV) and revenue per visit (RPS) in a single table. The figures are shown after access from automated programs (bots) has been excluded.
The table below is one example (illustrative). The figures are fictional, not figures from the actual screen.
| Segment | Sessions | Revenue | RPS | CVR | AOV |
|---|---|---|---|---|---|
| Returning | 260 | ¥850,000 | ¥3,270 | 71.0% | ¥4,600 |
| New | 10,400 | ¥1,660,000 | ¥160 | 3.4% | ¥4,750 |
What marks this example is that the difference in purchase rate (CVR) carries straight through into the difference in revenue per visit (RPS). Average order value (AOV) is close to level, so the efficiency of returning customers comes from purchase rate, not from what they spend. New customers, with the larger base (10,400), still have room to grow, and the returning customers (260), few but efficient, are the ones you do not want to leak. Displayed split by new and returning, which side to invest in gets chosen on revenue-efficiency figures instead of on feel.
What RevenueScope specializes in is breaking efficiency (CVR, AOV, RPS) down with new and returning separated on a revenue basis. Instead of one ratio called repeat customer rate, it displays revenue efficiency — including how much higher the purchase rate of returning customers runs — lined up under the same conditions as new. So the next move can be settled as "win them back, or grow them."
FAQ#
Frequently asked questions#
Q. How is repeat customer rate calculated?
A. Generally as "the share of customers in the period who bought two or more times." The figure changes depending on whether the denominator is all customers or only those who bought for the first time in that period. It changes with the window you aggregate over too (30 days or a year). Lining the definition up inside your own company comes before comparing against an average.
Q. Our repeat customer rate is below the average. Should that concern us?
A. A below-average repeat rate is not a problem by itself. Repeat rates move by an order of magnitude with the business model, so comparing against an industry average does not produce a move. For buy-once goods, low is what you would expect. What matters is knowing what counts as normal for your own structure, and checking whether the revenue returning customers generate is being left on the table.
Q. If we lift the repeat customer rate, will revenue grow?
A. Before lifting the rate itself comes whether the revenue returning customers generate is being lost. At the same rate, revenue efficiency differs from store to store. Confirm first that the efficient returning customers are being won back, then think about how to grow the larger base of new customers — that is when the next place to expand becomes visible.
Summary#
The benchmark for repeat customer rate sits some distance apart depending on where you look: the commonly quoted 30–40%, and around 20% in large-scale measurement. It moves by an order of magnitude with the business model too, so whether you cleared the industry average tells you little. The average is only the entrance.
The key is splitting new and returning by revenue. In the sample store, revenue per visit (RPS) differed by about 20x between returning and new customers, and that gap came from purchase rate rather than order value. Returning customers are efficient not because they spend more but because they buy when they come. So the move points away from adjusting order value and toward bringing the people who buy back once more.
Line up the definitions, exclude bots, break new and returning down as far as purchase rate and order value, and compare month after month. Because that repetition is heavy by hand, having it displayed in one table lets the "win them back, or grow them" decision be settled on revenue figures instead of on feel.
See which ads actually drive revenue, at a glance
Free up to 5,000 sessions/month, AI analyst included. No credit card required. Up and running in 5 minutes.
References#
- [1] EC no Mikata "What Is Repeat Rate? How to Calculate It, Industry Averages, and How to Raise It" (2024)
- [2] MobiLoud "How Mobile Apps Increase Repeat Customer Rate in Ecommerce (+ Repeat Customer Rate Benchmarks for 2026)" (2026)
- [3] BS&Co "Repeat Purchase Rate Benchmarks: 18.8% Across 156K Customers" (2025)
- [4] Google Analytics Help "Analytics dimensions and metrics" (2026)