"Ads bring in new customers. But they don't buy a second time. So I want a higher repeat rate — I started emails, I started loyalty points. And yet I can't tell whether any of it is working." It's a very common frustration in ecommerce. You ran the tactics. But you can't see whether the register changed.
Repeat rate trips people up less on the how to raise it and more on whether you can confirm it worked. This article lays out how to think about levers that raise repeat rate, then how to confirm a tactic actually worked using "new vs returning revenue efficiency." So you stop pouring money into acquisition that was only cheap because it was one-and-done.
Table of Contents
TL;DR#
-
A higher repeat rate grows revenue without spending on ads
Someone who already bought buys again with less friction — so each visit is worth more
-
Levers come down to three: post-purchase experience, reminders, and reasons to return
The how isn't hard. The hard part is confirming it worked
-
Measure the effect by splitting revenue efficiency into new vs returning
Total revenue alone can't tell apart "the retention tactic worked" from "new traffic just went up"
-
Cheap but one-and-done acquisition is actually expensive
Judge acquisition not by how cheap it was, but by whether those people came back and bought
1. Why a higher repeat rate grows revenue#
Bottom line: someone who already bought buys with less friction than a new customer. So the same single visit produces more revenue from a returning customer.
Repeat rate is the share of customers who have bought before and buy again. Why raise it? Because bringing in a new customer through ads costs money every time, while someone who already bought already knows and trusts your store. That makes the next purchase more likely — revenue stacks up without more ad spend.
The numbers make the gap clear. New customers are often "just browsing," so the revenue from a single visit is small. Returning customers come intending to buy, so revenue per visit is several times higher.
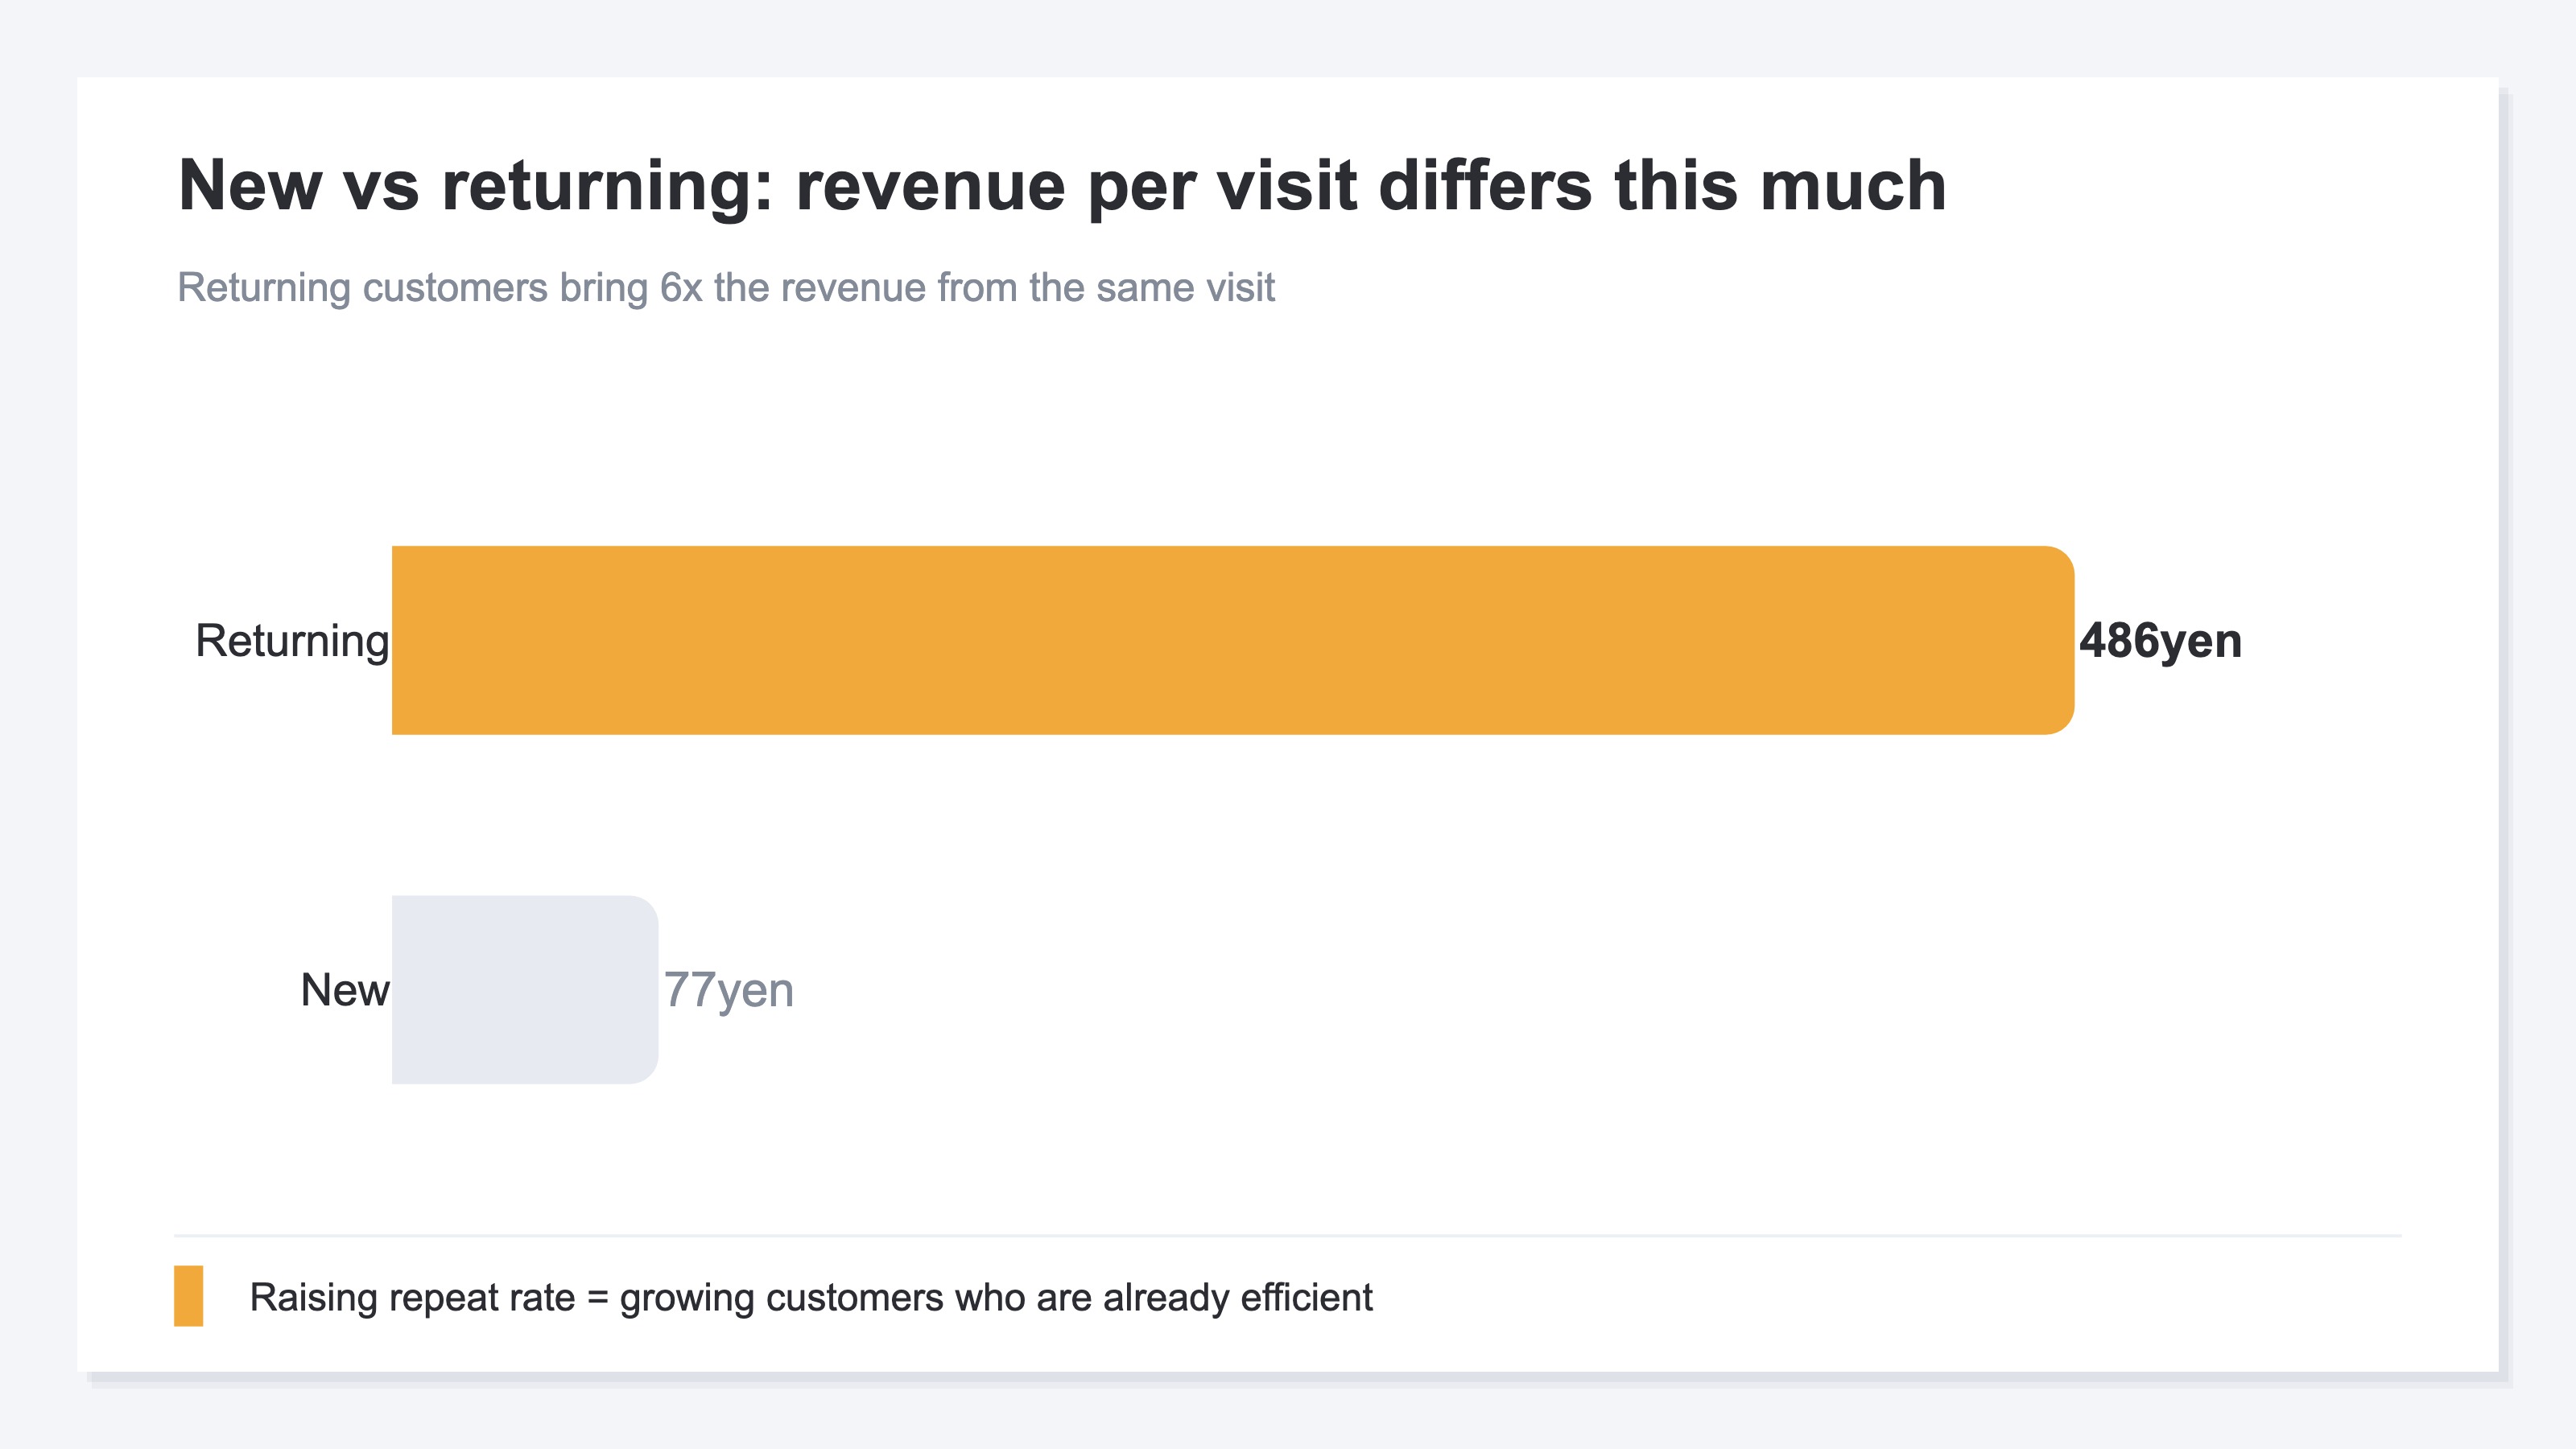
So raising repeat rate means growing the customers who are already efficient. Getting one returning customer to buy again is far cheaper than bringing in one more new customer.
2. How to think about levers that raise repeat rate#
Bottom line: levers sort into three directions — post-purchase experience, reminders, and reasons to return. The how itself isn't hard.
There are countless retention tactics, but the thinking comes down to three directions.
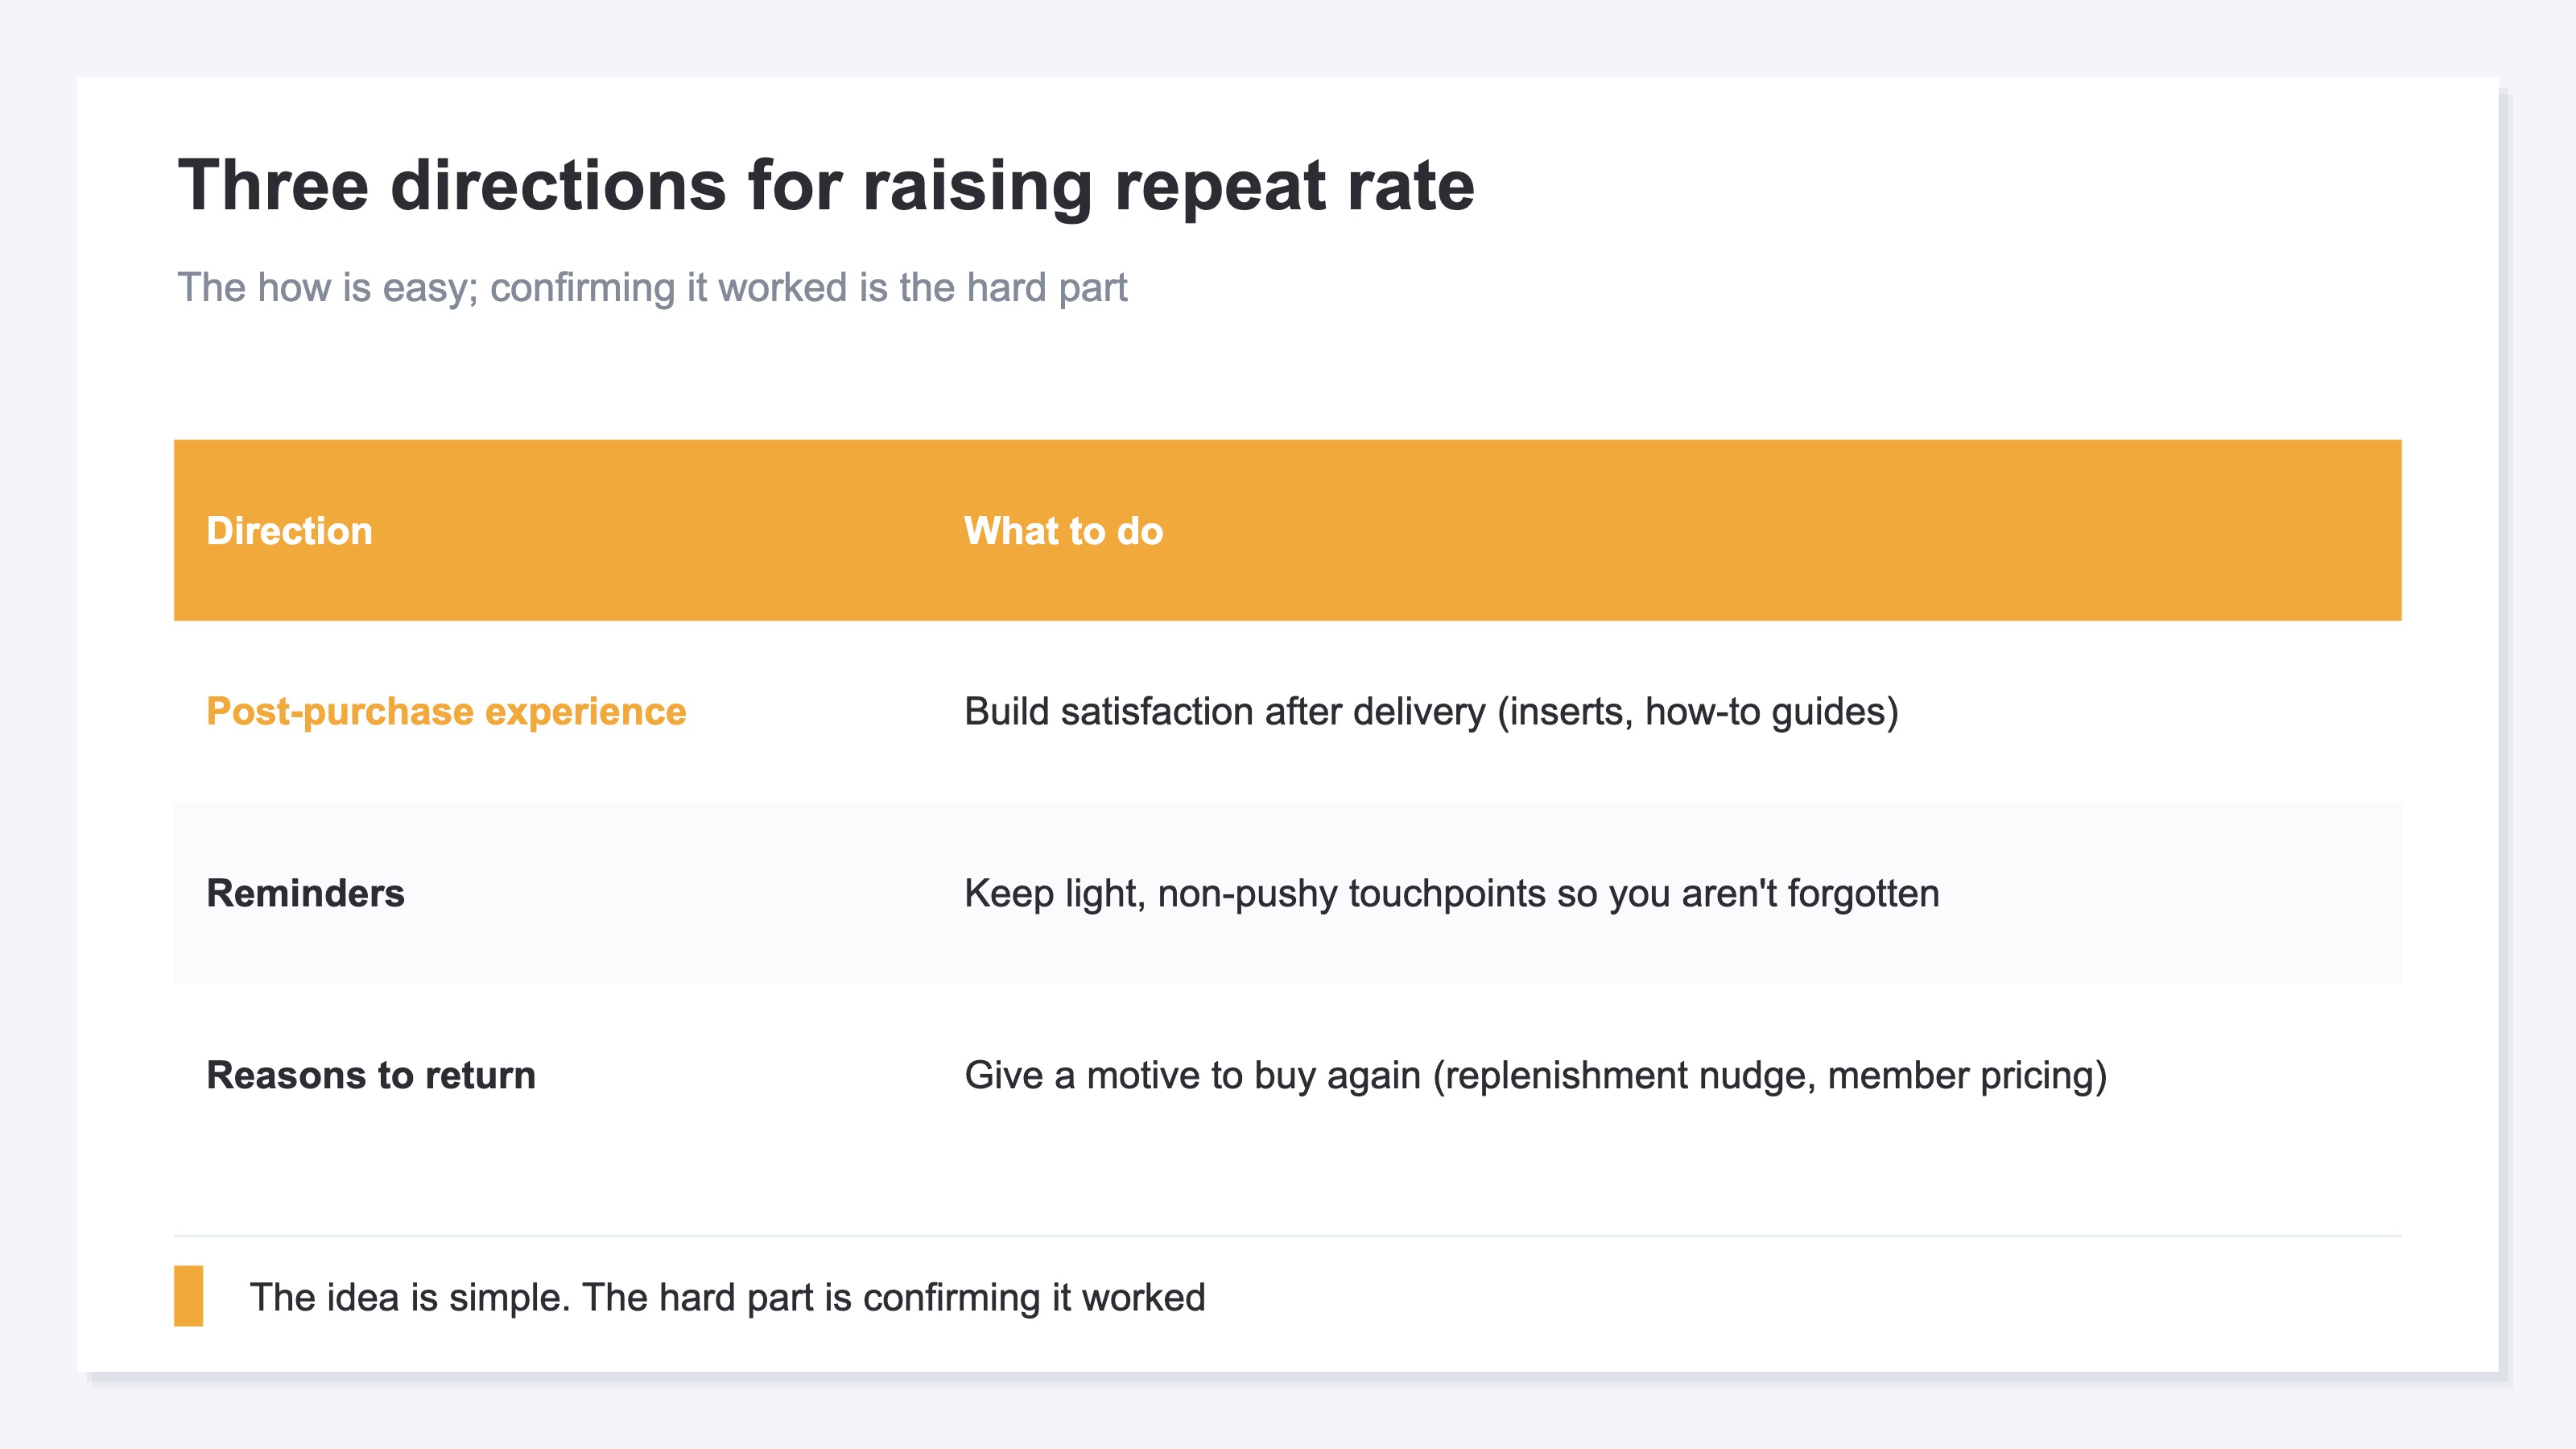
First, the post-purchase experience: after the product arrives, thoughtful inserts or a how-to-use guide that make people feel "I'm glad I bought this." Second, reminders: people forget even good stores, so keep light, non-pushy touchpoints via email or social. Third, reasons to return: give a concrete motive for the next purchase (a replenishment-timing nudge, member pricing).
None of this is hard as an idea. What's genuinely hard is confirming, after you start, "so — did it work?" You can run endless tactics, but if the effect stays invisible, only money and effort go out.
3. Prove it worked with new vs returning revenue efficiency#
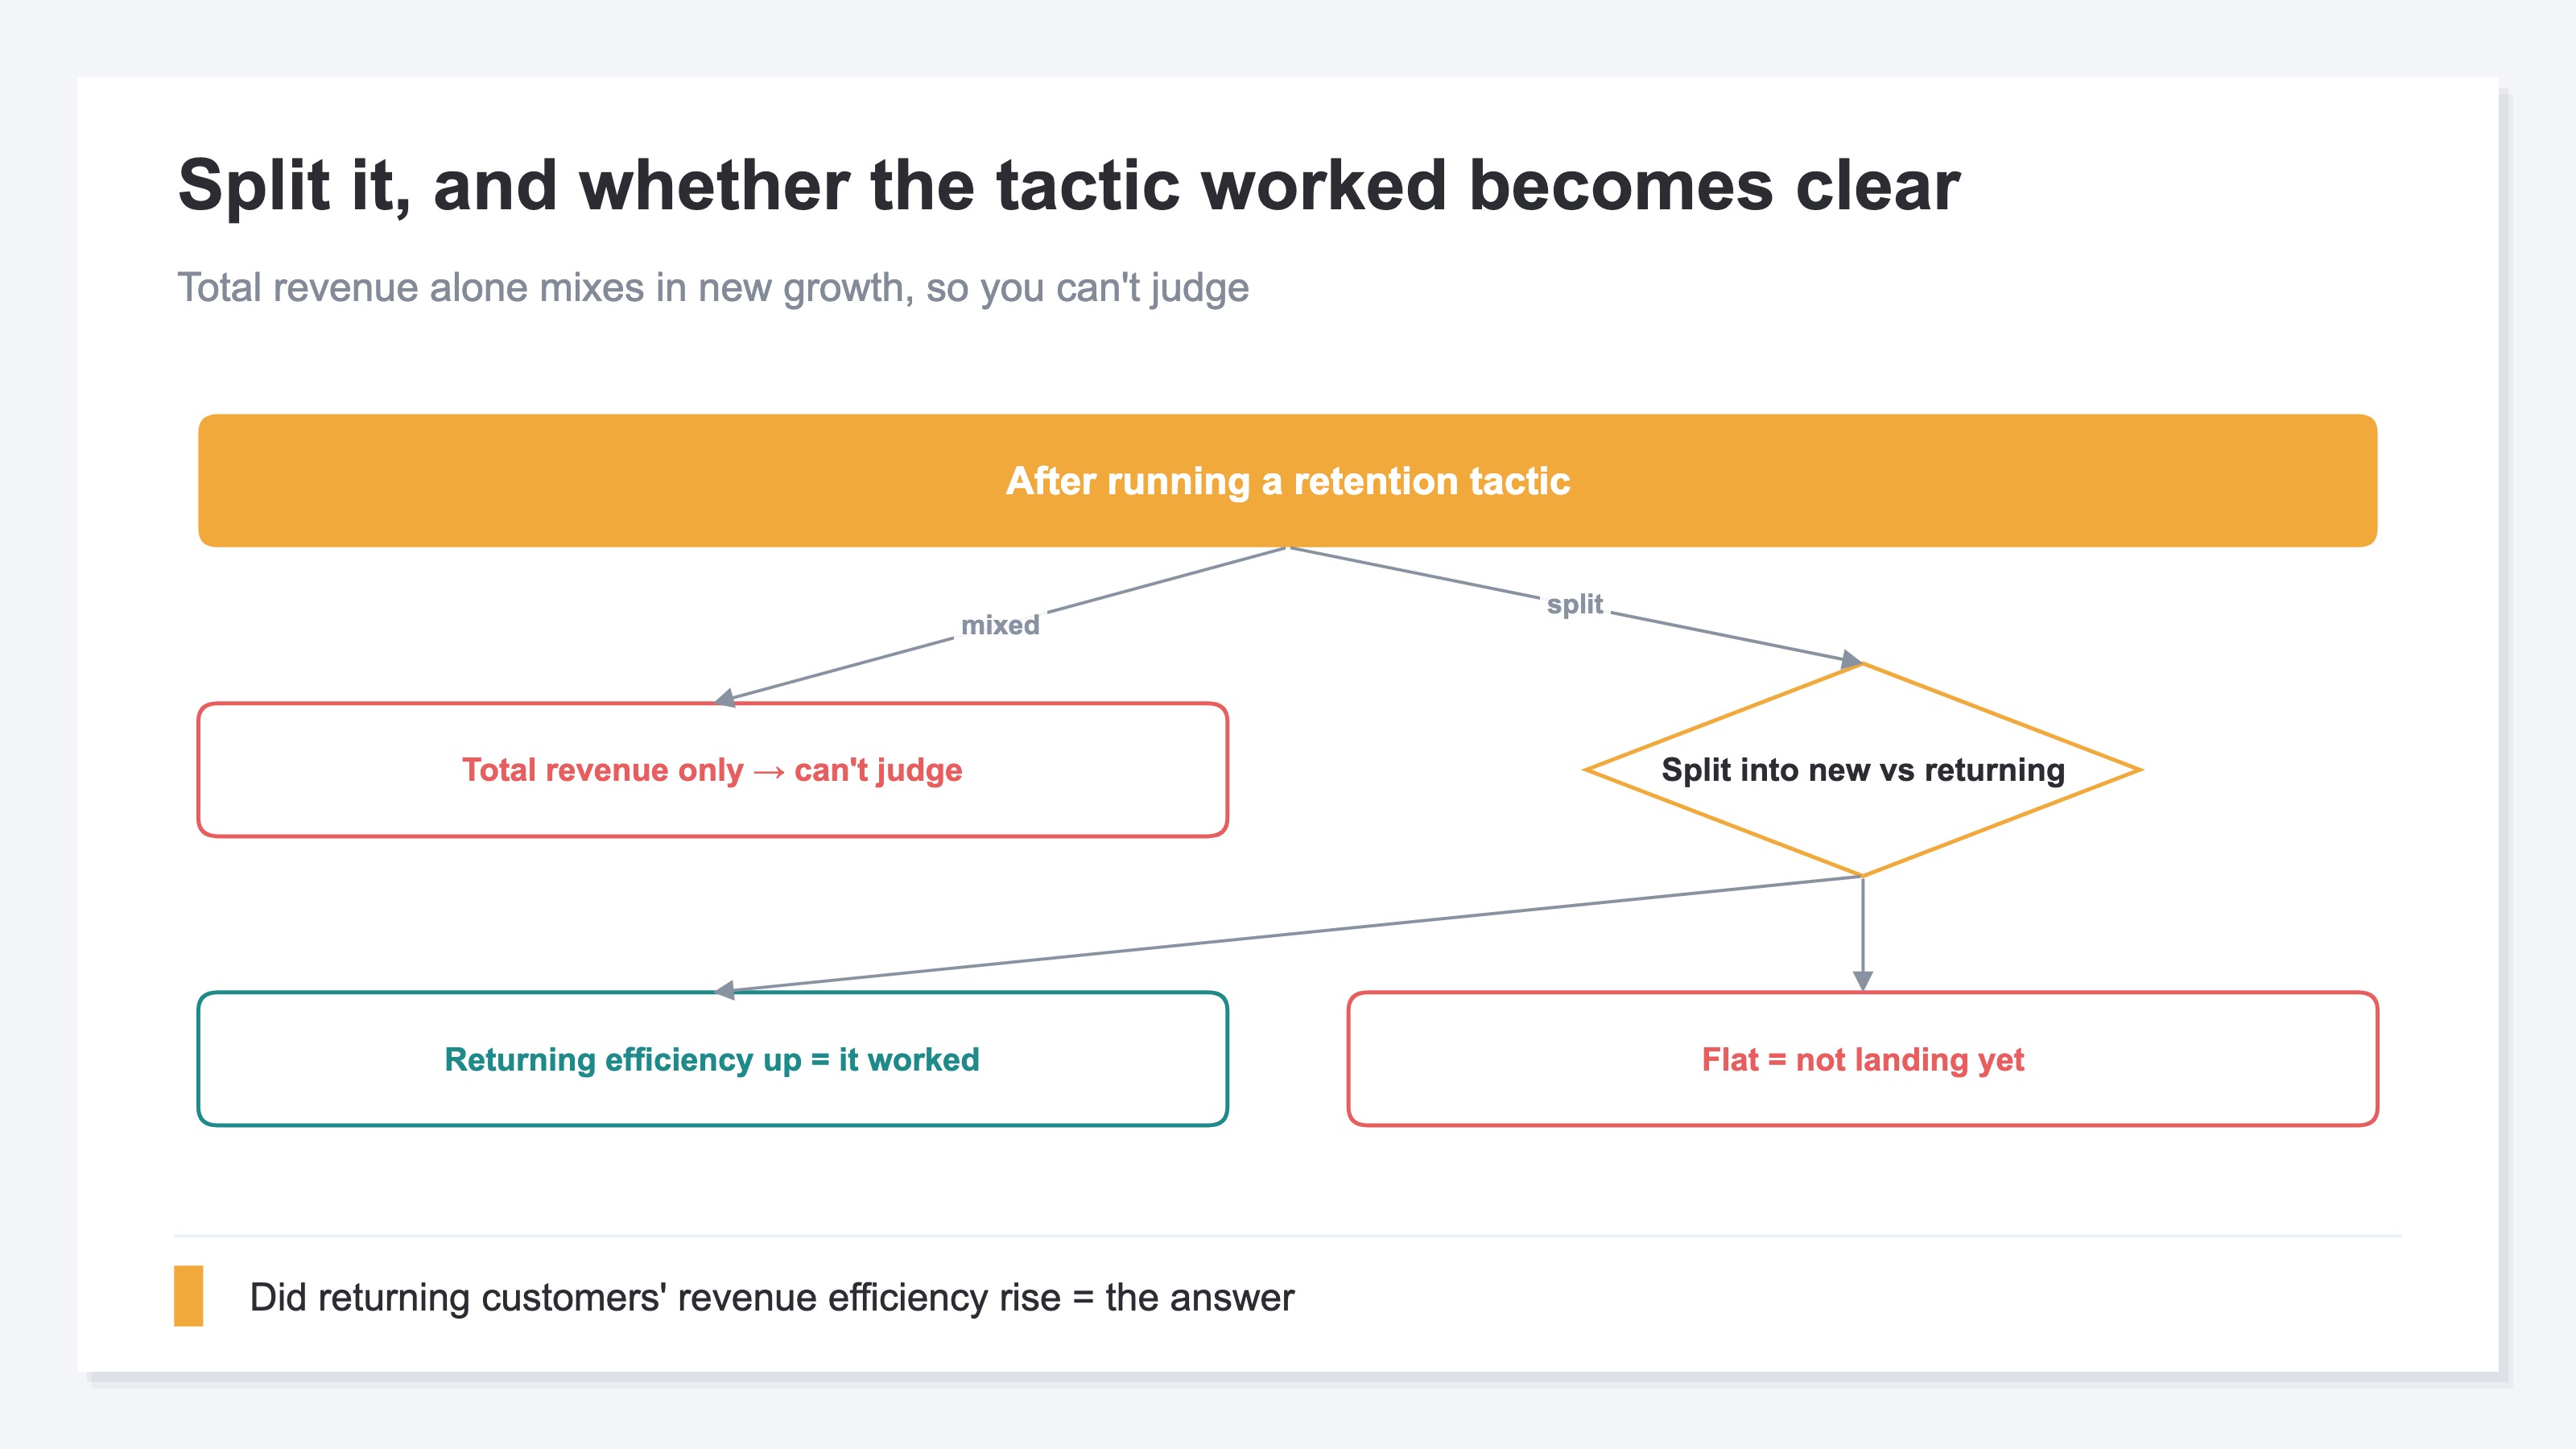
Bottom line: confirm a retention tactic by "revenue efficiency split into new vs returning," not by total revenue. Without the split, you can't tell the tactic's effect from a plain rise in new traffic.
Here's the heart of it. After starting a retention tactic, most people look at "did total revenue go up." But that can't separate whether the retention tactic worked or whether ads simply brought in more new customers. The total mixes both.
The right way is to split customers into "new" and "returning" and look at each one's revenue per session (RPS) and average order value. If the retention tactic is working, the count of returning customers — or their revenue efficiency — should be rising. If total revenue grew but returning customers' efficiency didn't change, the growth leaned on new customers and the retention tactic hasn't landed yet.
This lens works for evaluating acquisition too. Ecommerce operators abroad resonate with the confession: "I judged channels on cheap acquisition cost alone — the cheaply-won customers churned after one order, and the 'expensive' channel I avoided was bringing in customers who repeated for months." Judge acquisition not by how cheaply you won someone, but by whether they came back and how much they bought. The returning lens makes you rethink both tactic measurement and ad quality at once.
That said, grasping the idea of splitting is one thing; actually being able to line it up is another. Lining up new-vs-returning revenue efficiency by before/after or by channel means rebuilding GA4 exploration reports over and over, and the manual work piles up every time.
RevenueScope solution
Bottom line: revenue efficiency split by new vs returning can sit on one screen from the start, without rebuilding GA4 every time.
The reason a retention tactic's effect is hard to see comes back to GA4's design. GA4 is optimized for last-click revenue and on-site behavior, and isn't built to line up new-vs-returning revenue efficiency by before/after or by channel. So you end up rebuilding report after report yourself.
RevenueScope precomputes the aggregations ecommerce decisions actually need. Ask it, and it returns revenue efficiency split into new and returning (demo data):
| Segment | Sessions | Revenue per session (RPS) | Average order value (AOV) |
|---|---|---|---|
| New | 8,200 | ¥77 | ¥4,290 |
| Returning | 1,600 | ¥486 | ¥5,800 |
Compare this table before and after a tactic, and "did returning customers' revenue efficiency rise?" is clear at a glance. If the retention tactic worked, returning RPS or count goes up; if not, it hasn't landed. RevenueScope returns the same split by channel too, so you can see which channels bring repeat-efficient customers — and stop paying for cheap, one-and-done acquisition. Not a tool for outputting a repeat-rate percentage, but for measuring whether retention and acquisition actually pay in revenue — that's what RevenueScope is for.
FAQ#
Frequently asked questions#
Q. Does RevenueScope output the repeat rate (the percentage) itself?
A. Calculating a repeat-rate percentage is a different tool's job. What RevenueScope returns is "revenue efficiency split by new vs returning (RPS, AOV)" — the numbers for confirming whether a retention tactic pays in revenue. That makes the tactic's ROI easier to judge than chasing the percentage alone.
Q. If total revenue went up, the retention tactic succeeded, right?
A. Not yet known. Total revenue mixes new and returning, so it could just be ads bringing in more new customers. Judge a retention tactic by whether returning customers' revenue efficiency or count rose.
Q. Shouldn't I just get more new customers instead of retention?
A. It depends. But if your new customers are mostly cheap and one-and-done, acquisition cost just stacks up. Compare new and returning revenue efficiency, and decide based on where the upside is — "acquisition that brings customers who return" or "retention tactics."
Conclusion#
A higher repeat rate grows revenue without ad spend, because someone who already bought buys with less friction — so revenue per visit is higher. Levers sort into three directions — post-purchase experience, reminders, and reasons to return — and the how itself isn't hard.
The hard part is confirming a tactic worked. Measure it by revenue efficiency split into new vs returning, not by total revenue. That lets you tell the retention tactic's effect from a plain rise in new traffic. As a first step, split your own numbers into "new" and "returning" and compare each one's revenue per session. Whether to keep a tactic or rethink it becomes clear.
See which ads actually drive revenue, at a glance
Free up to 5,000 sessions/month, AI analyst included. No credit card required. Up and running in 5 minutes.