For a long time, when shifting ad budget between channels, I would stop at the ROAS (return on ad spend) and CPA (cost per acquisition) on the dashboard. I rarely reconciled it back to the actual revenue on my own side, channel by channel. But increasing budget on the channel with the best ROAS can backfire. Ad platforms tend to push delivery toward "returning customers who would buy anyway," so a higher-ROAS channel is often skewed toward repeat buyers. This guide explains why judging channels on ROAS alone is risky, how to split new from returning, and how to read profit instead of ROAS.
Table of Contents
TL;DR#
-
Higher-ROAS channels skew toward returning customers
Ad platforms push delivery toward whoever buys most cheaply — usually returning customers who would have come back anyway
-
Split new from returning with "total orders" and "first-time orders"
Pull two numbers per channel; the gap between them is the volume of returning-customer re-engagement
-
Judging by contribution profit instead of ROAS flips the ranking
At the same ROAS, a low-margin product and a high-margin product leave very different profit
-
Evaluate new-customer contribution on a separate yardstick
A search channel that harvests demand and a channel that grows new customers should not be compared on the same ROAS
1. Why high-ROAS channels can be risky#
Bottom line: ad platforms push delivery toward cheap returning buyers, so higher-ROAS channels skew toward repeat customers.
ROAS is a channel's ad-driven revenue divided by its ad spend. At a glance, a higher ROAS looks like a better channel. But ROAS alone can't tell you whether that revenue came from "a new customer" or from "an existing customer who would have bought anyway."
A platform's delivery algorithm finds whoever converts most cheaply and pushes delivery toward them. The cheapest converters are usually "returning customers who already know your product and would come back anyway." So channels that pick up returning customers tend to show a higher ROAS.
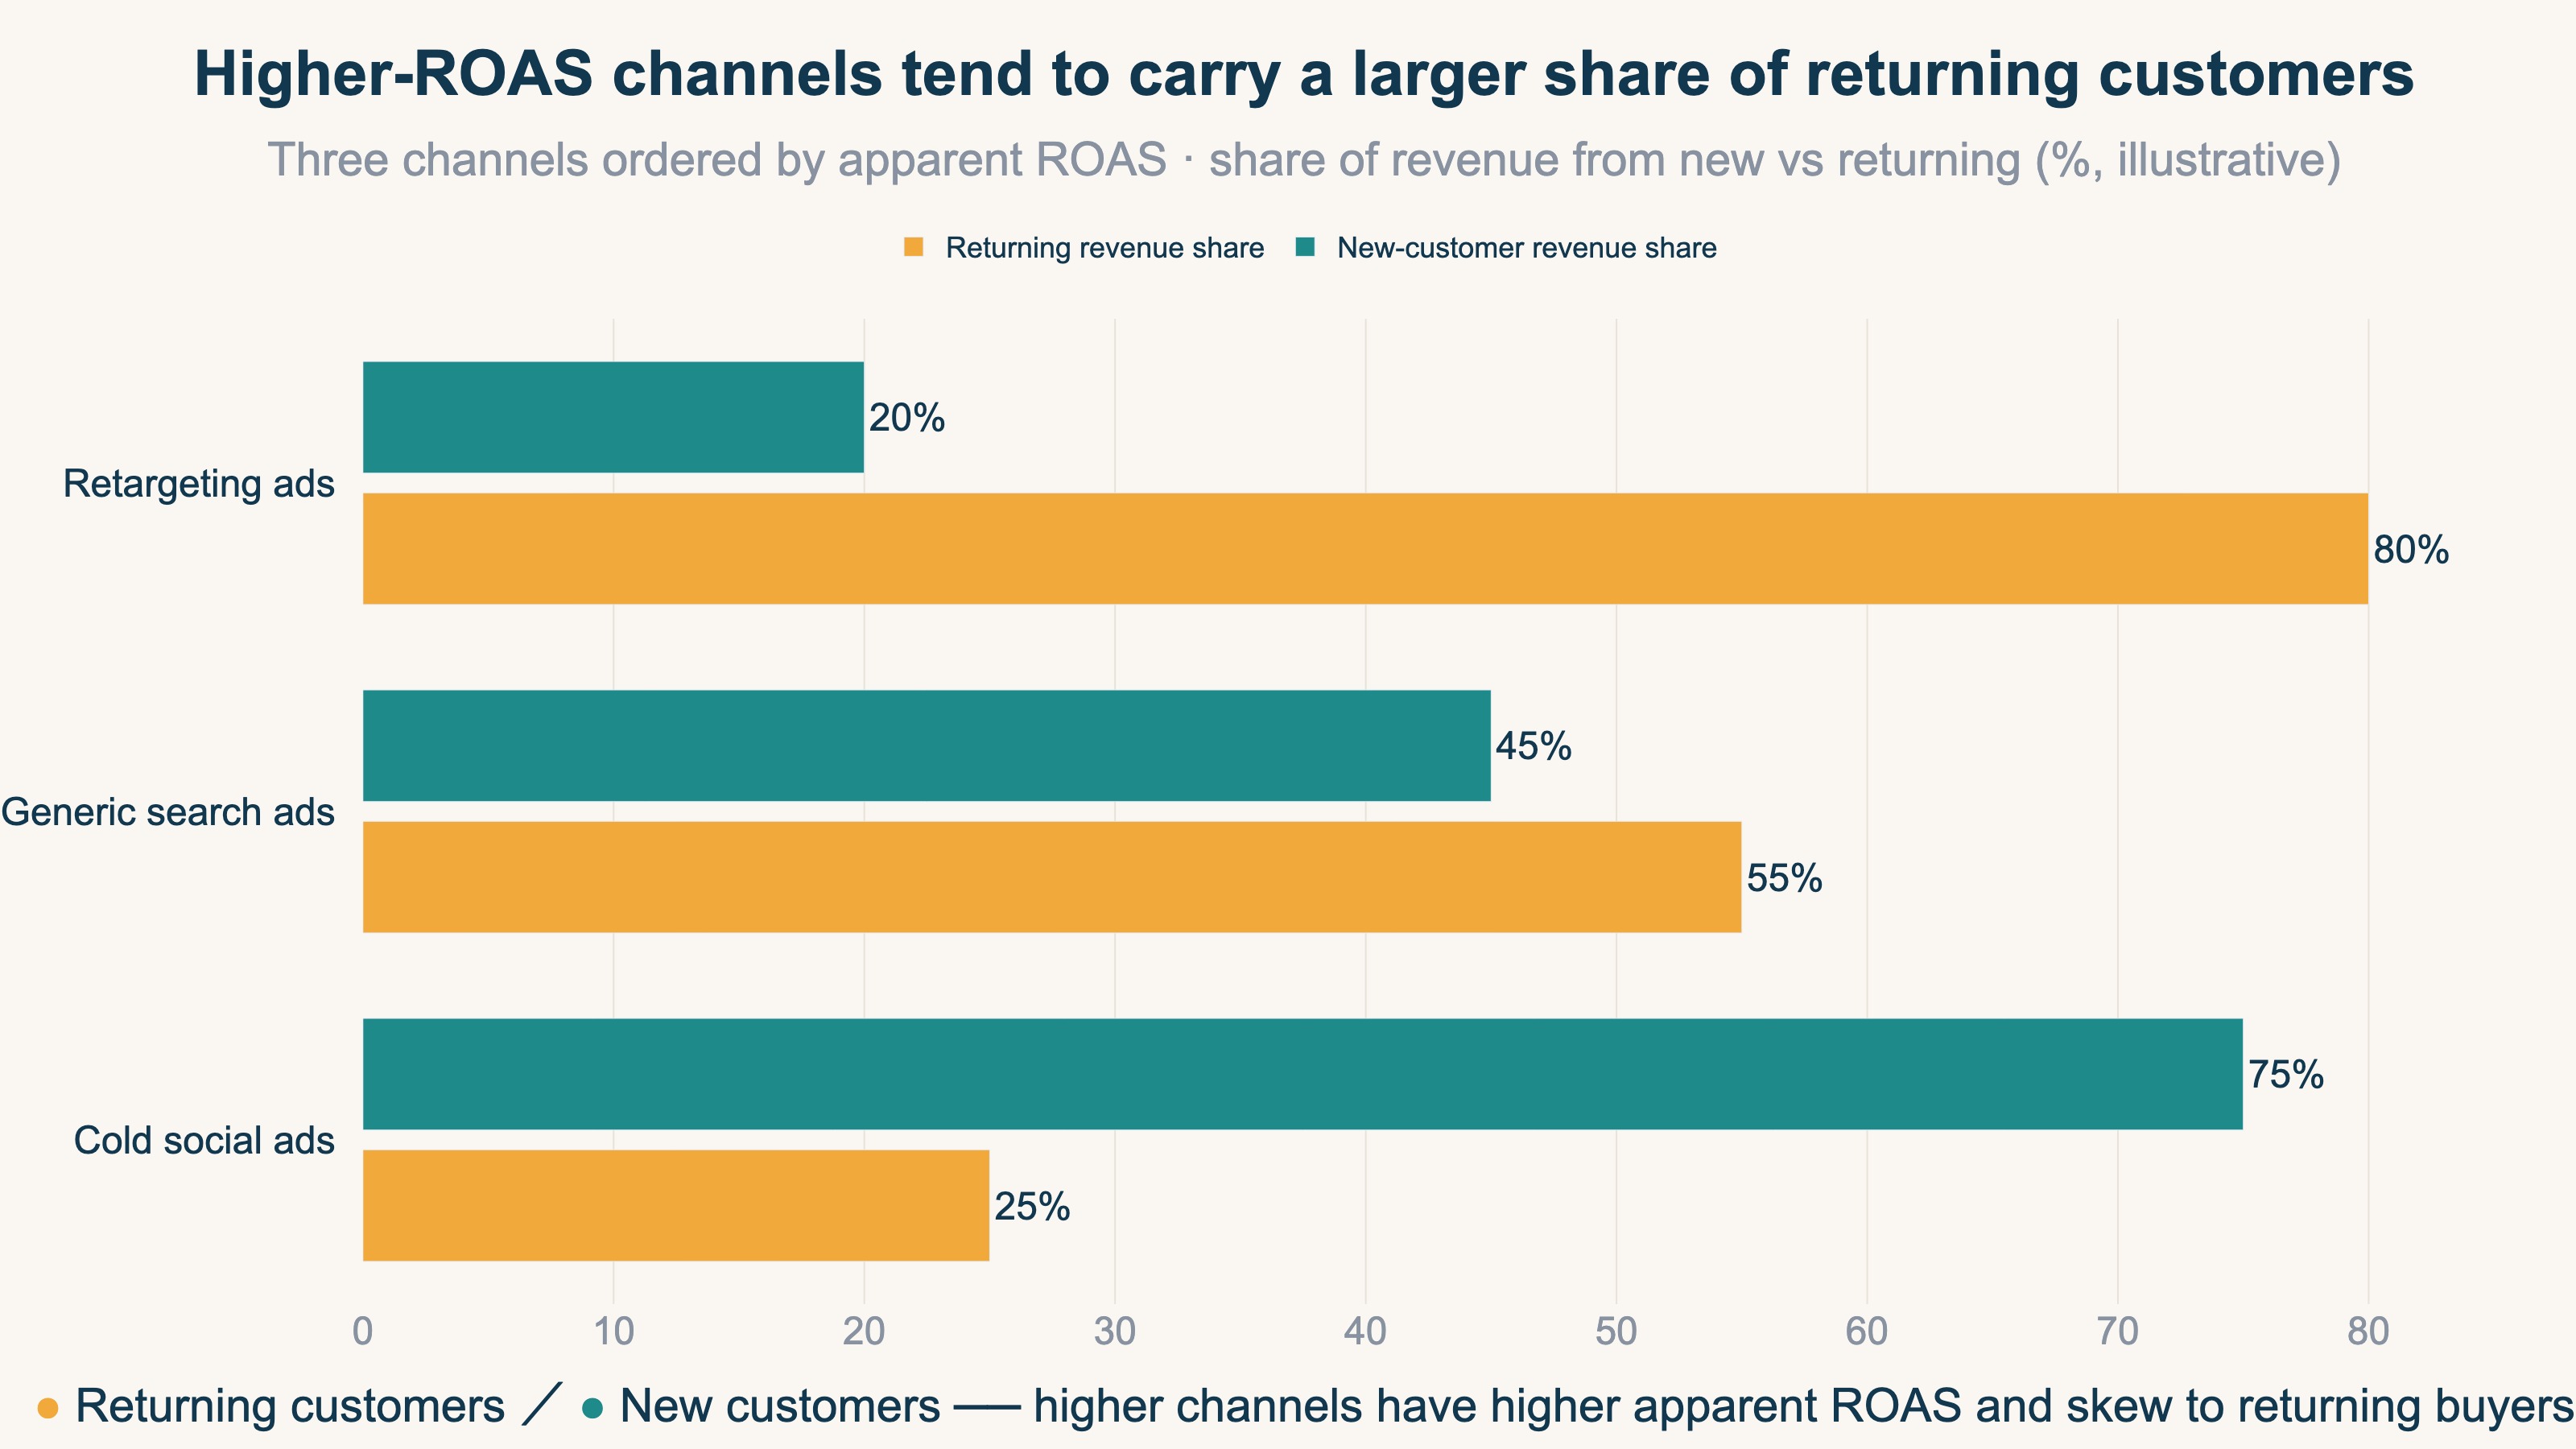
By contrast, channels that reach new customers who don't know your product yet rarely convert on the spot, so their ROAS looks low. If you cut such a channel "because its ROAS is low," you close off the entry point for new customers who would have become repeat buyers. One brand cut its podcast ads because the ROAS was low — and the next quarter, search-driven revenue dropped sharply. Those ads had been creating the "first spark" for people who later searched and bought.
In other words, the premise that high ROAS equals a good channel is itself shaky. You need to separate whether a channel is winning new customers or merely re-engaging existing ones.
2. Two numbers that split new from returning#
Bottom line: pull "total orders" and "first-time orders" per channel; the gap shows the volume of returning-customer re-engagement.
Splitting new from returning doesn't require a complex analytics tool. For each channel, just pull two numbers.
Total orders      = all orders via that channel
First-time orders = of those, orders from first-time buyers
Returning (repeat) = Total orders − First-time orders
Look at total orders alone and every channel seems to be pulling its weight. But line up first-time orders and the picture changes. A channel with a big gap between total and first-time orders earns most of its results from returning customers. A channel with a small gap is genuinely bringing in new customers.
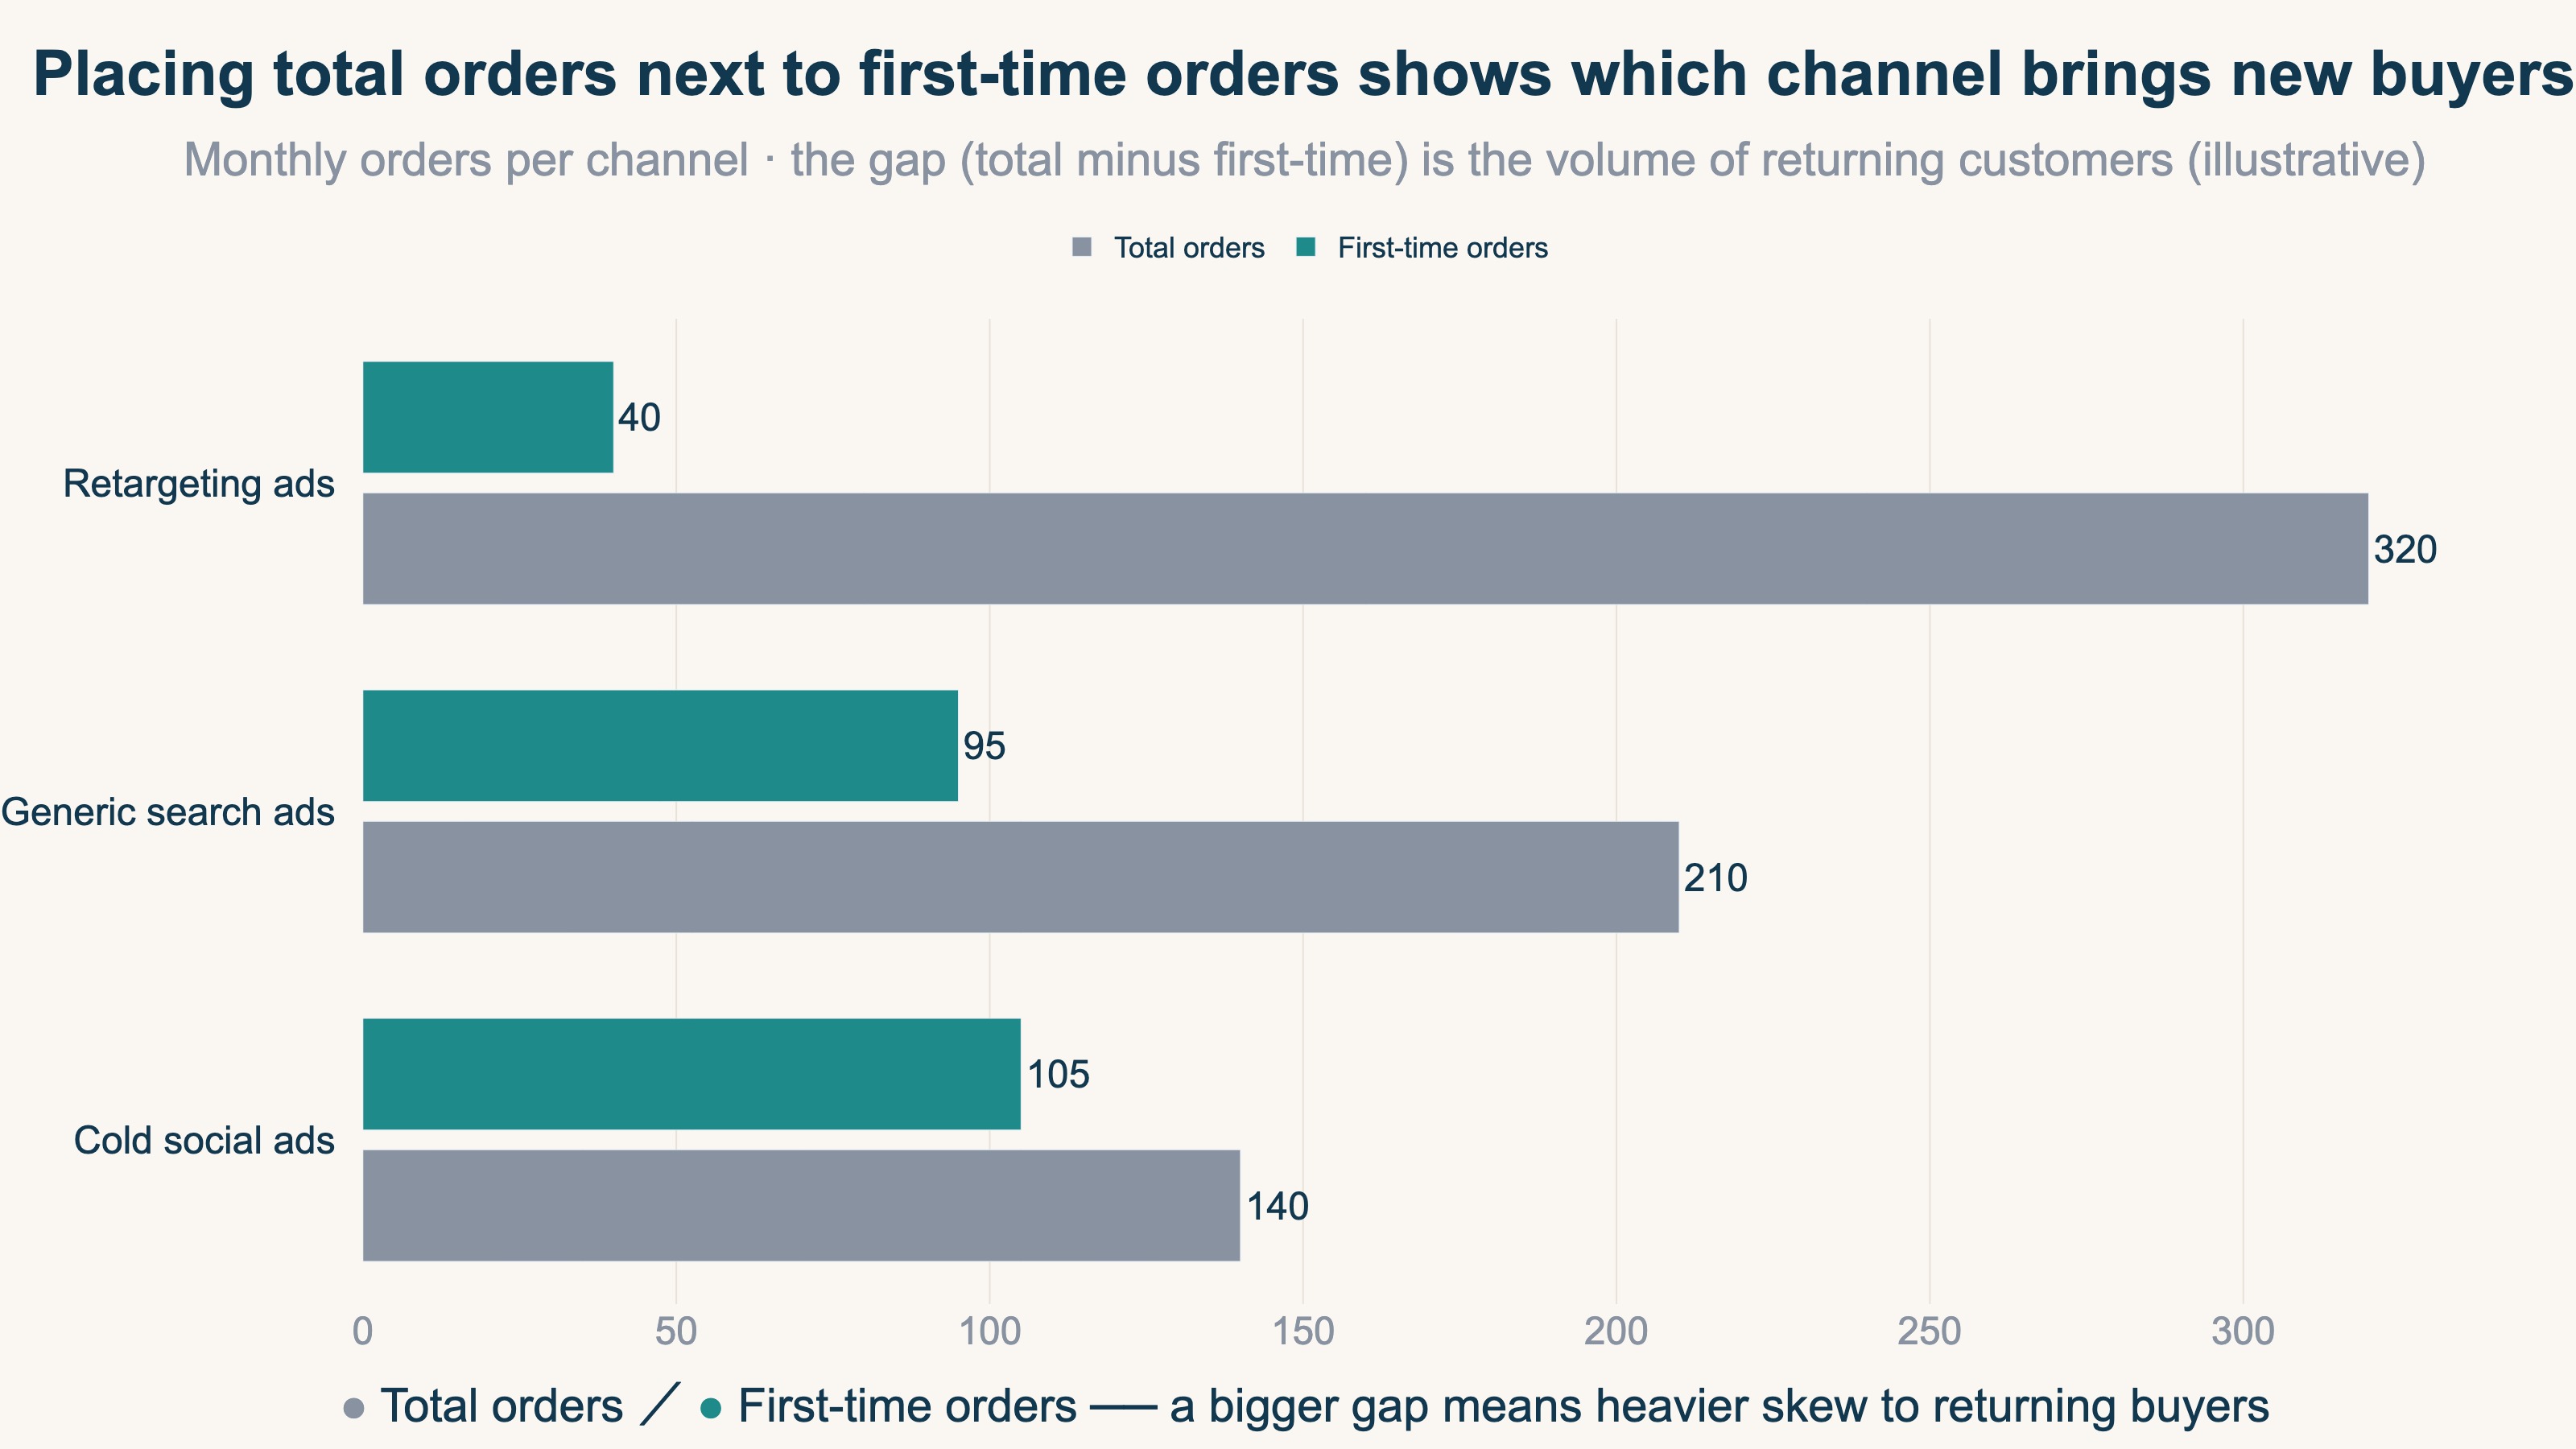
Retargeting ads (ads that chase people who already visited your site), for example, often show many total orders but very few first-time orders. That may not be new-customer acquisition at all — just bringing returning buyers back one more time. Meanwhile a social ad with mediocre ROAS may have a higher share of first-time orders.
The important part of this view is that the conclusion can flip against ROAS. A channel with good ROAS is actually skewed toward re-engaging existing customers. A channel with poor ROAS is actually doing the work of new-customer acquisition. Only once you make this distinction can you judge where budget should go.
3. Read profit, not ROAS: the contribution-margin lens#
Bottom line: at the same ROAS, different product margins leave different profit. Read profit through contribution margin, not ROAS.
There is one more trap ROAS can't see: ROAS looks at revenue, not profit.
Contribution margin is the profit left after subtracting the costs directly tied to that revenue.
Contribution profit = Revenue − (COGS + shipping + payment fees + ad spend)
Compare two channels, each given ¥500K of ad spend.
Meta ads  : ROAS 3x · 40% margin → ¥1.5M revenue · ¥100K contribution profit
Google ads: ROAS 2x · 70% margin → ¥1.0M revenue · ¥200K contribution profit
On the report Meta has the higher ROAS and looks superior. But it sells a low-margin product, so the profit left relative to revenue is thin. Google, with a lower ROAS, sells a high-margin product, so its final contribution profit is double. The ROAS ranking and the profit ranking are reversed.
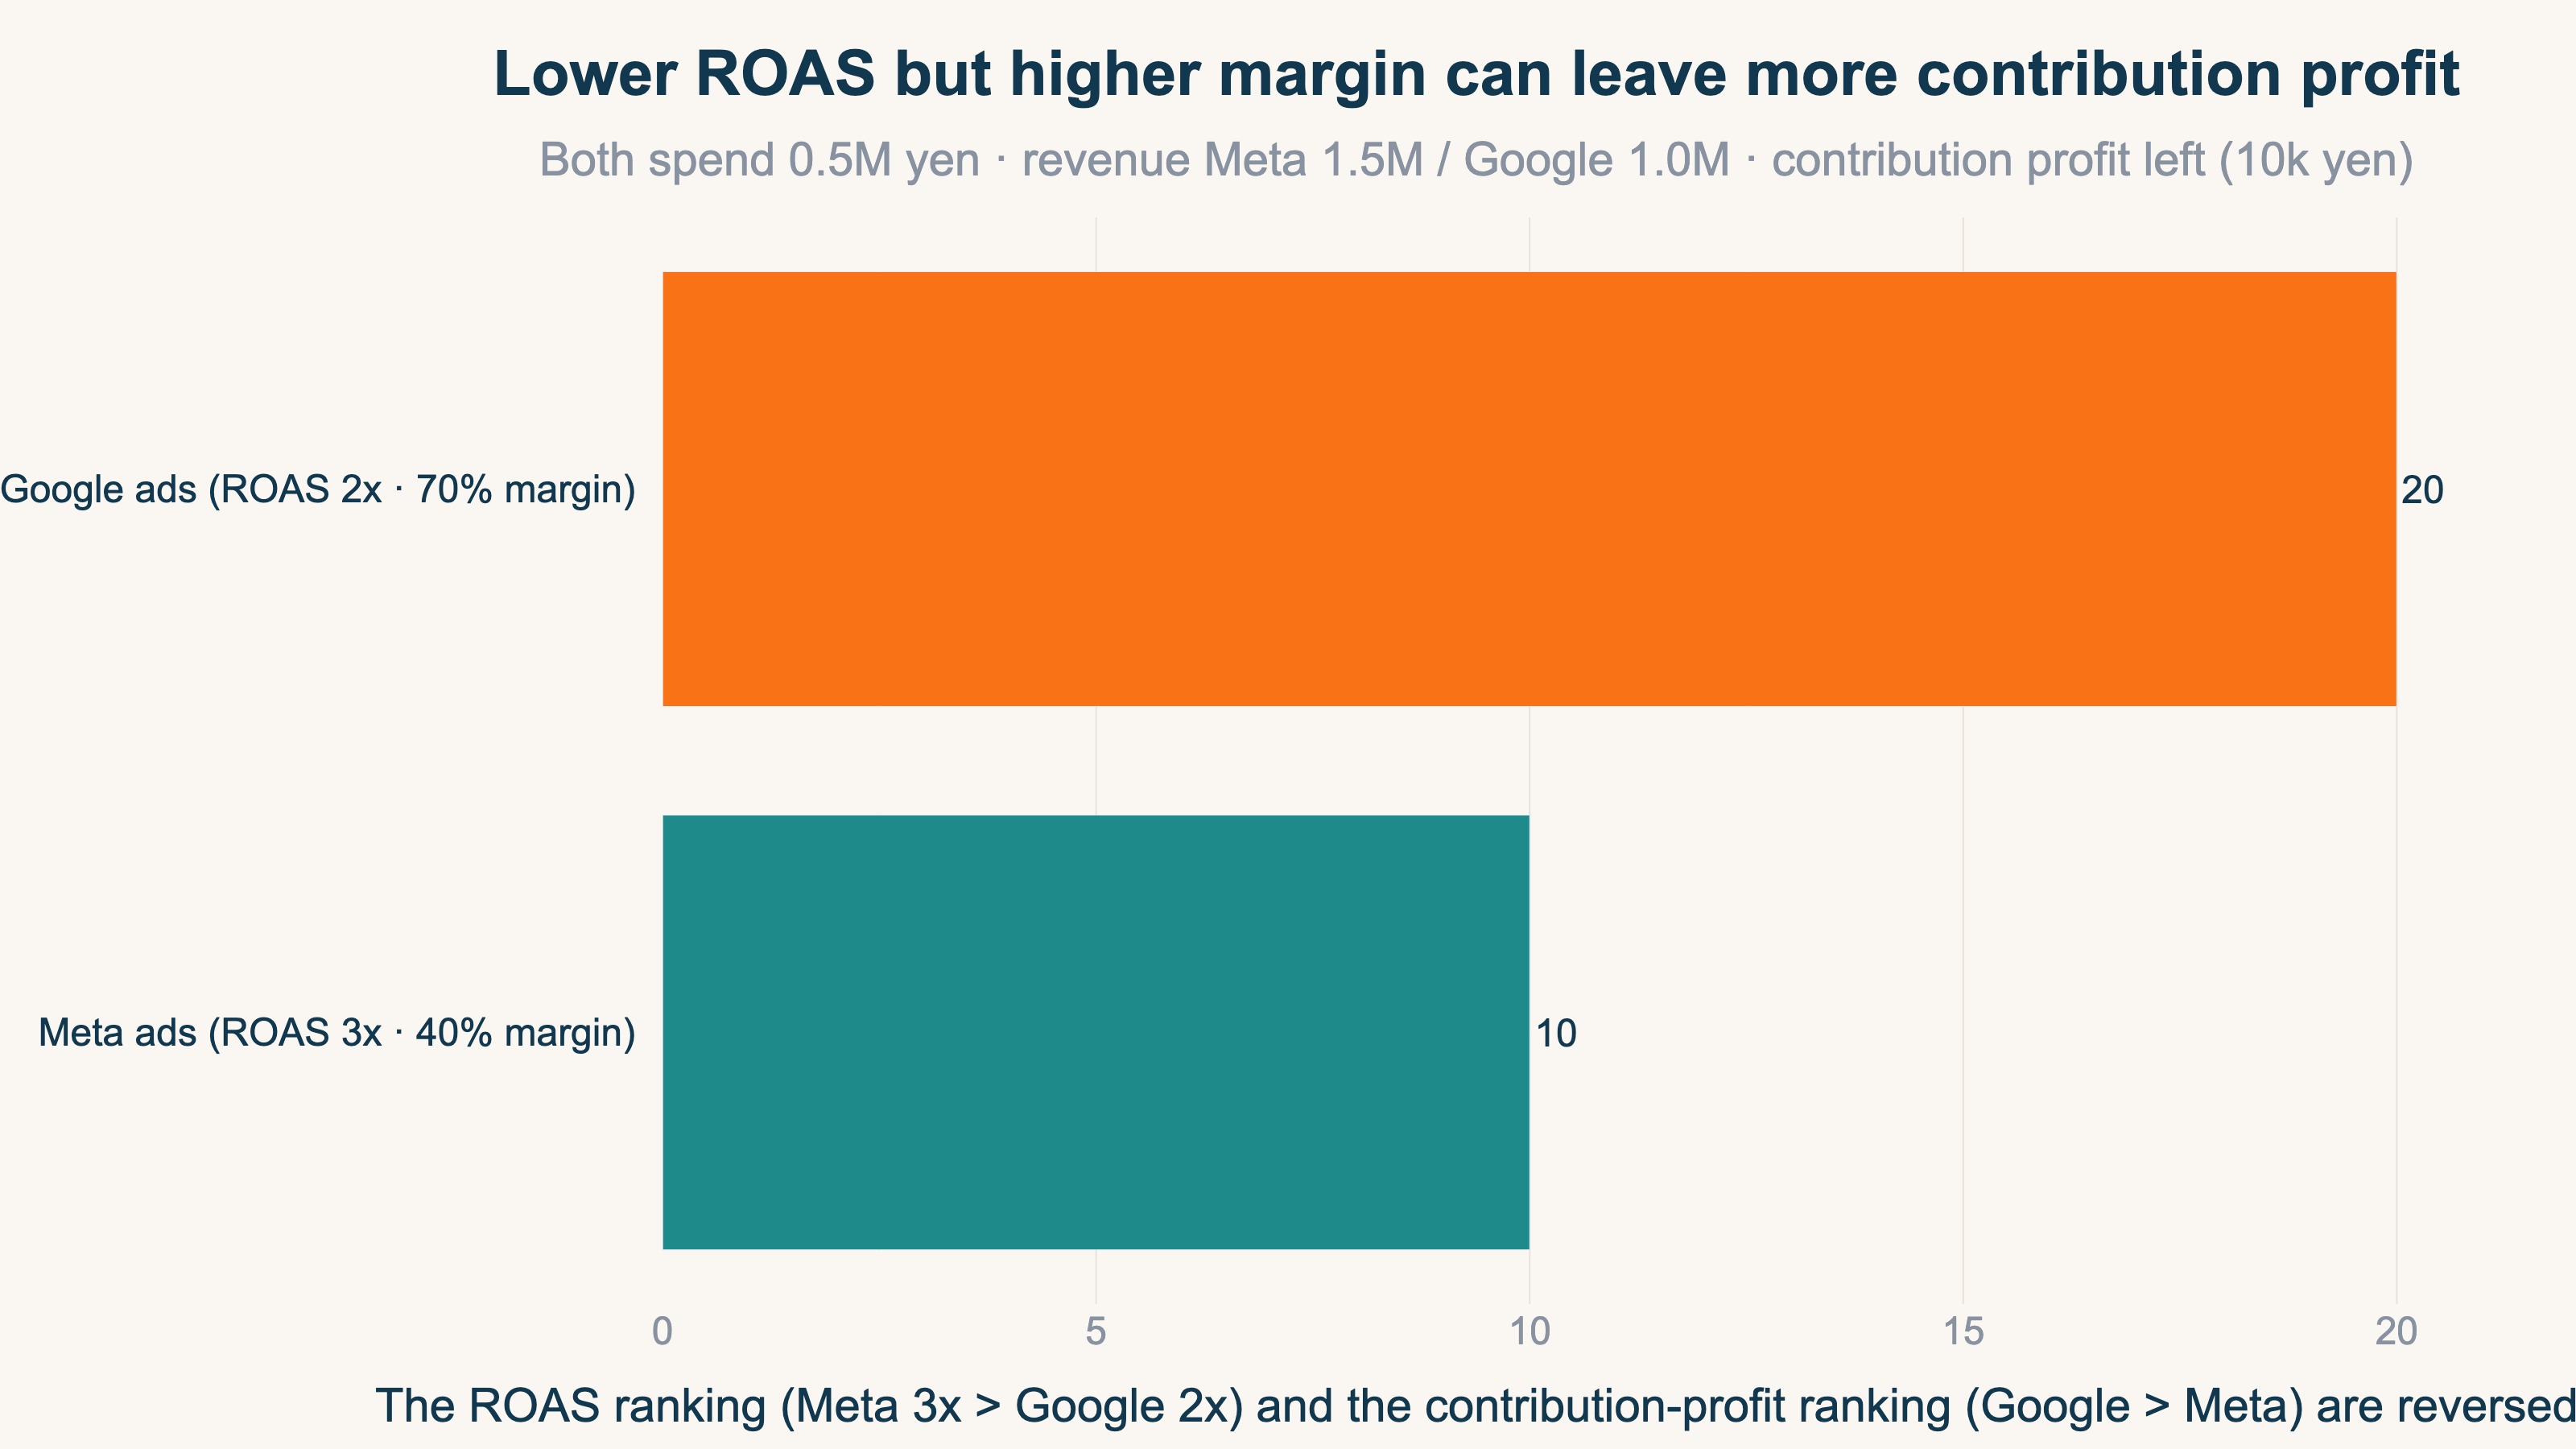
There is a saying in advertising: "revenue is vanity, margin is sanity." Revenue and ROAS are numbers that feel good, but if profit is thin behind them, the business quietly wastes away. When you evaluate channels, translate ROAS into profit (contribution margin) before comparing. That alone changes the ranking of which channels to scale.
RevenueScope solution
ROAS skewing toward returning customers, and ROAS failing to reflect profit, share one root: "which channel, for which customers, created how much profit" is only visible through each ad platform's self-report.
RevenueScope uses its own tracking to remove duplicates and align each channel's revenue on one screen. Rather than the figures each platform claims separately, it aligns every channel by where the buyer last came from (Last-touch) — one common basis for comparison.
On top of that, RevenueScope lets you view channel revenue split by new versus returning. Concretely, you can compare RPS (revenue per session) by channel, broken down by new and existing customers. That means you can separate "a channel with high apparent ROAS that is really skewed toward returning customers" from "a channel with plain ROAS that genuinely brings in new customers."
See new-customer contribution and overall efficiency from the same starting point, instead of being swayed by each platform's self-report. That is the next step toward allocating budget without getting it wrong.
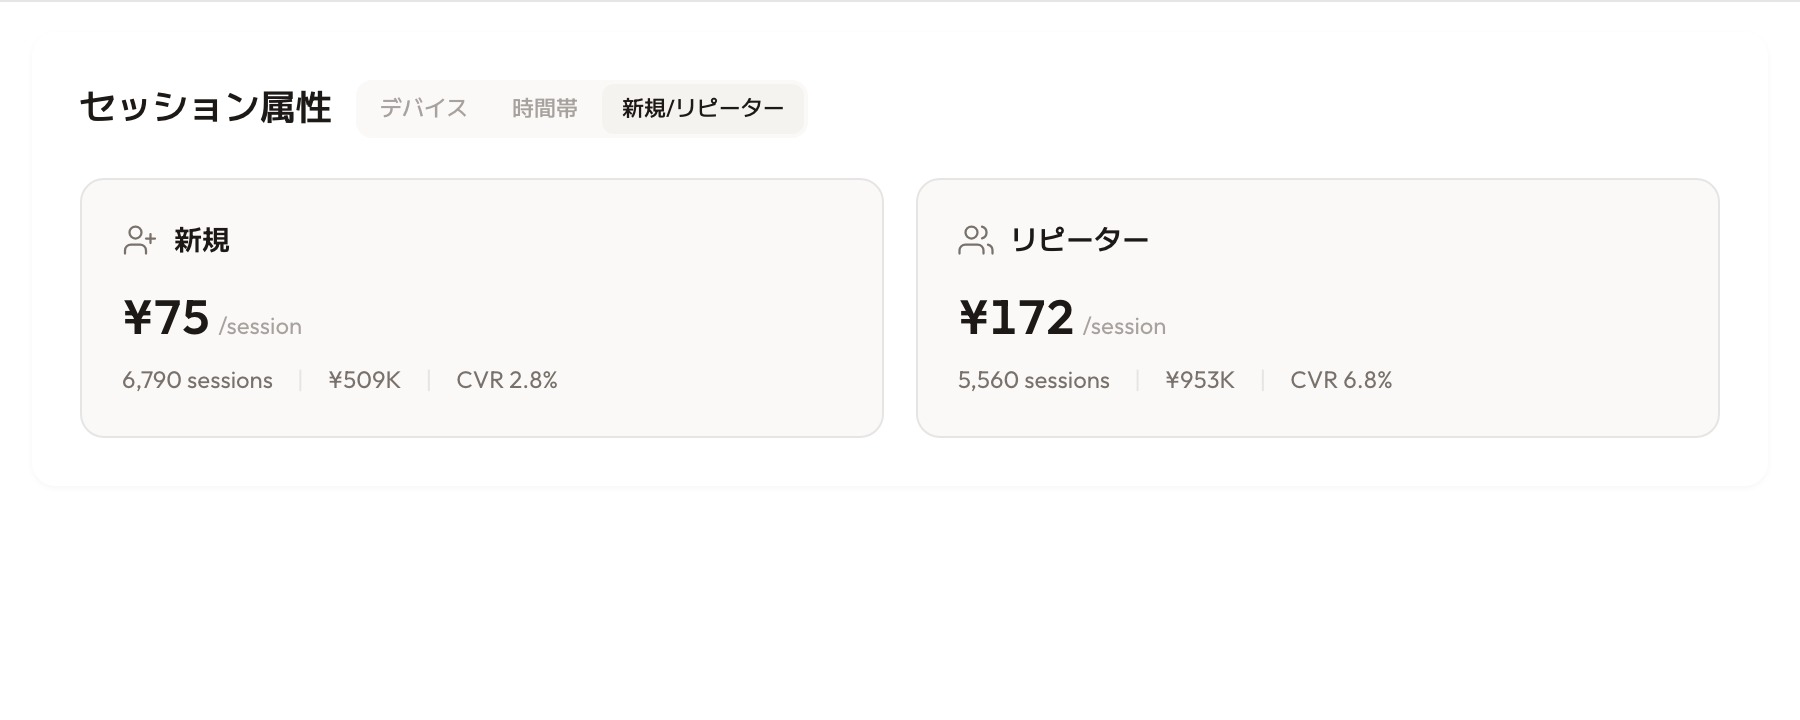
RevenueScope's new-versus-returning revenue efficiency (demo data shown). The same visit converts very differently for new versus returning customers.
In the screen above, returning customers run at RPS (revenue per session) ¥172 and a 6.8% purchase rate, while new customers sit at RPS ¥75 and 2.8% — returning is more than twice as efficient. That is why channels heavy on returning visitors who would have come back anyway tend to show a high apparent ROAS, while channels that bring in new customers look plain, with low on-the-spot RPS and ROAS. Because RevenueScope splits this new-versus-returning view by channel, you can separate "an efficient-looking channel" from "the channel that is actually the doorway to future returning customers" — and protect that budget.
FAQ#
Q. Does this mean I shouldn't look at ROAS?
A. No. ROAS is a useful number for daily per-channel tuning. The problem is deciding channel superiority — and moving budget — on ROAS alone. Refine inside channels with ROAS, but make allocation decisions by adding "new versus returning" and "how much contribution profit."
Q. Do I need a special tool to split new from returning?
A. Not for the first step. Pull total orders and first-time orders per channel, and the gap is the volume of returning-customer re-engagement. Most EC dashboards and GA4 can show the new-versus-returning distinction. Once you need a consistent basis across channels, a dedicated tool is worth considering.
Q. How precise does contribution margin need to be?
A. You don't need perfection at the start. A rough figure — revenue minus COGS, shipping, payment fees, and ad spend — is enough. What matters is not absolute accuracy but whether the ranking between channels changes from what ROAS showed. If it changes, that is proof that judging on ROAS alone is risky.
Conclusion#
A high-ROAS channel is not necessarily a good one. Because ad platforms push delivery toward cheap returning buyers, higher-ROAS channels are often skewed toward repeat customers. You can split new from returning using the gap between each channel's total orders and first-time orders. And translating ROAS into contribution profit changes the ranking of which channels to scale.
As a first step, take just your main channels and line up three numbers: total orders, first-time orders, and a rough contribution profit. The "channels truly worth protecting" — invisible in the ROAS report alone — start to show up in concrete numbers.
See which ads actually drive revenue, at a glance
Free up to 5,000 sessions/month, AI analyst included. No credit card required. Up and running in 5 minutes.
References#
- Google Ads "About attribution models" 2024
- Shopify "Customer Acquisition Cost (CAC): How To Calculate and Reduce It" 2026
- Meta for Business "About Meta Advantage+ shopping campaigns" 2024