"Ad ROAS 300%, so we're profitable." On a 30%-margin product, that line is barely above breakeven. Gross margin — not revenue — determines how much cash actually stays in the business, and every breakeven decision starts there.
This article first walks through the gross-margin formula and how to back-calculate break-even ROAS (1 / gross margin), then shows how to tell which channels are actually selling efficiently above the break-even line using revenue per session (RPS).
Table of Contents
Key takeaways#
-
Gross margin = (revenue − COGS) ÷ revenue × 100
Whether you're profitable starts from gross margin, not revenue
-
Break-even ROAS = 1 ÷ gross margin
30% margin → 333%, 50% → 200%. Only above this do you profit
-
The same ROAS 300% flips between profit and loss by margin
Judging on ROAS alone gets more dangerous the lower the margin
-
Once you confirm profit, find efficient channels by revenue per session (RPS)
ROAS can't tell you which channel sells efficiently above break-even
1. The gross-margin formula and break-even ROAS#
Gross margin is the share of revenue left after subtracting COGS. The formula:
Gross margin (%) = (revenue − COGS) ÷ revenue × 100
Revenue of $1,000,000 with COGS of $600,000 gives a 40% gross margin — the same thing accounting calls "gross profit margin." The EC COGS bucket holds four items: purchase cost (or manufacturing cost for in-house), inbound shipping, packaging materials, and payment processing fees. Ad spend, payroll, and rent are SG&A and don't belong in gross margin.
Once you know your gross margin, the minimum ROAS to break even on ads falls right out. That's break-even ROAS. ROAS means "how much revenue per $1 of ad spend" (revenue ÷ ad spend), and break-even ROAS is the ROAS at which profit is exactly zero. The formula is simple:
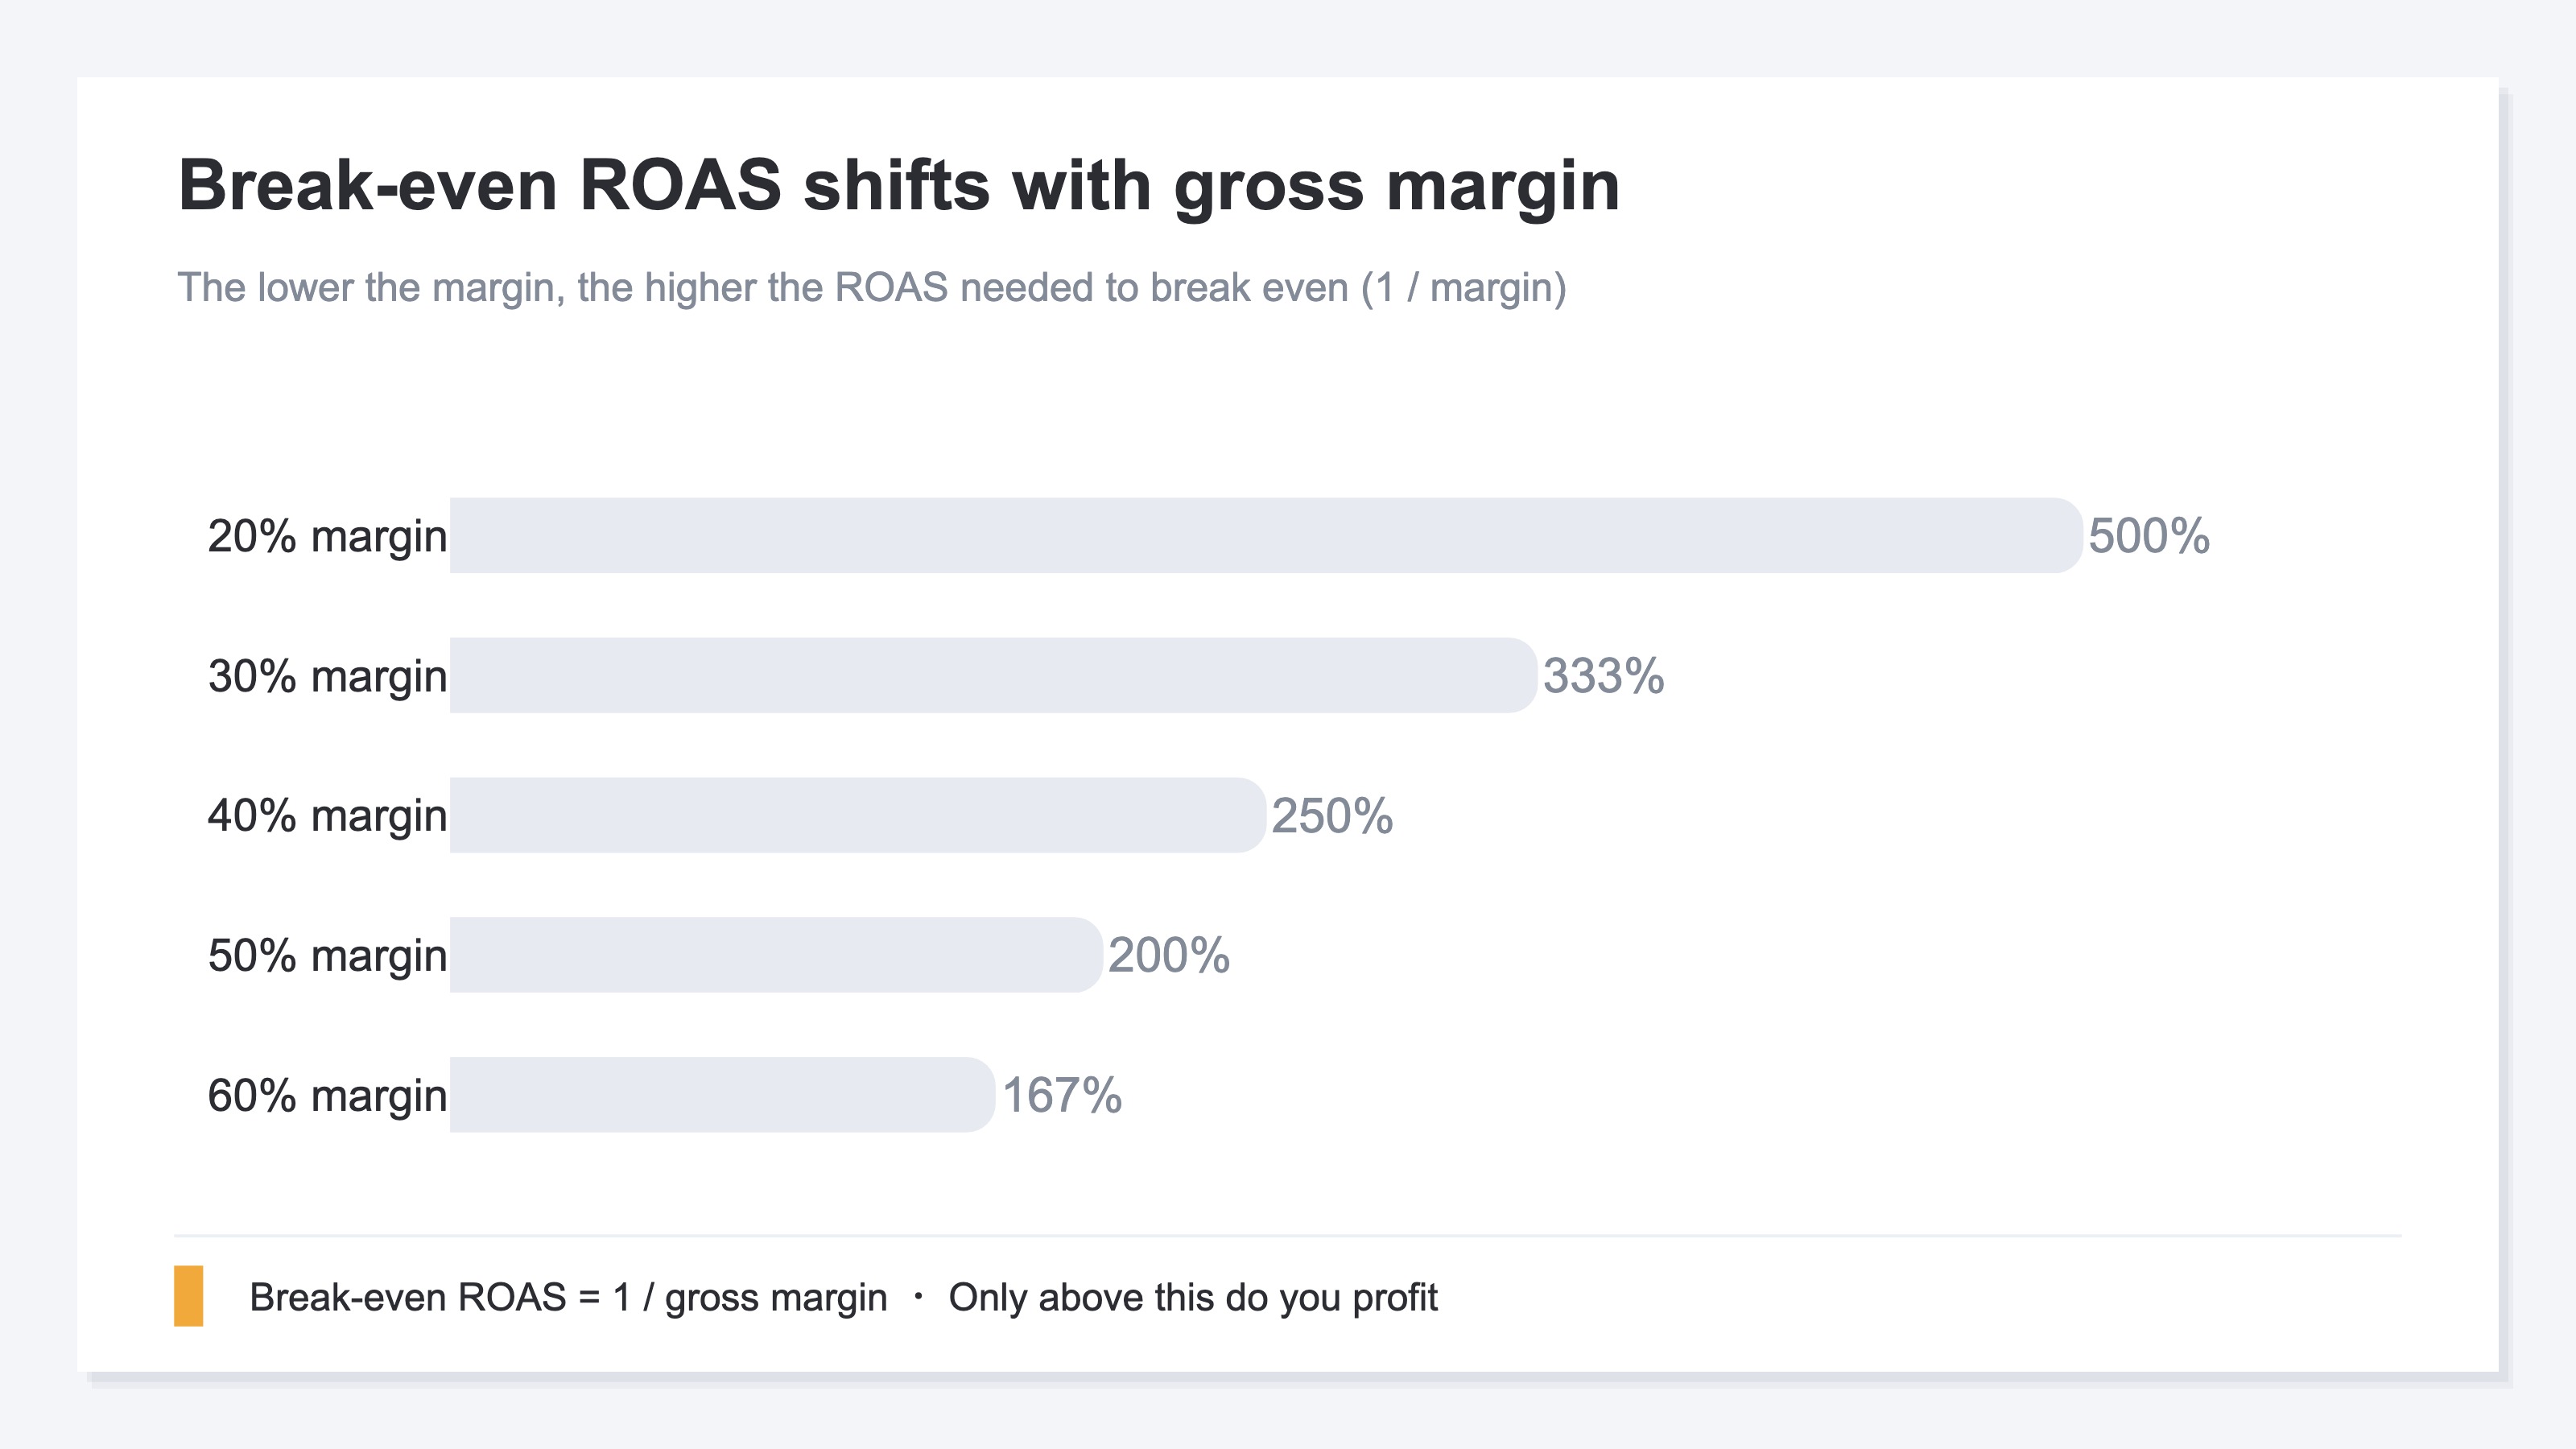
Break-even ROAS = 1 ÷ gross margin
| Gross margin | Break-even ROAS | Meaning |
|---|---|---|
| 20% | 500% | Only at 500% do you break even |
| 30% | 333% | Below 333% is a loss |
| 40% | 250% | 250% is the profit line |
| 50% | 200% | Recovered at 200% |
| 60% | 167% | Profitable above 167% |
The lower the margin, the higher the ROAS you need just to break even. That's exactly why the right reference is your own break-even point, not the industry-average ROAS. The full back-calculation is covered in the ROAS Complete Guide.
2. The same ROAS 300% flips between profit and loss#
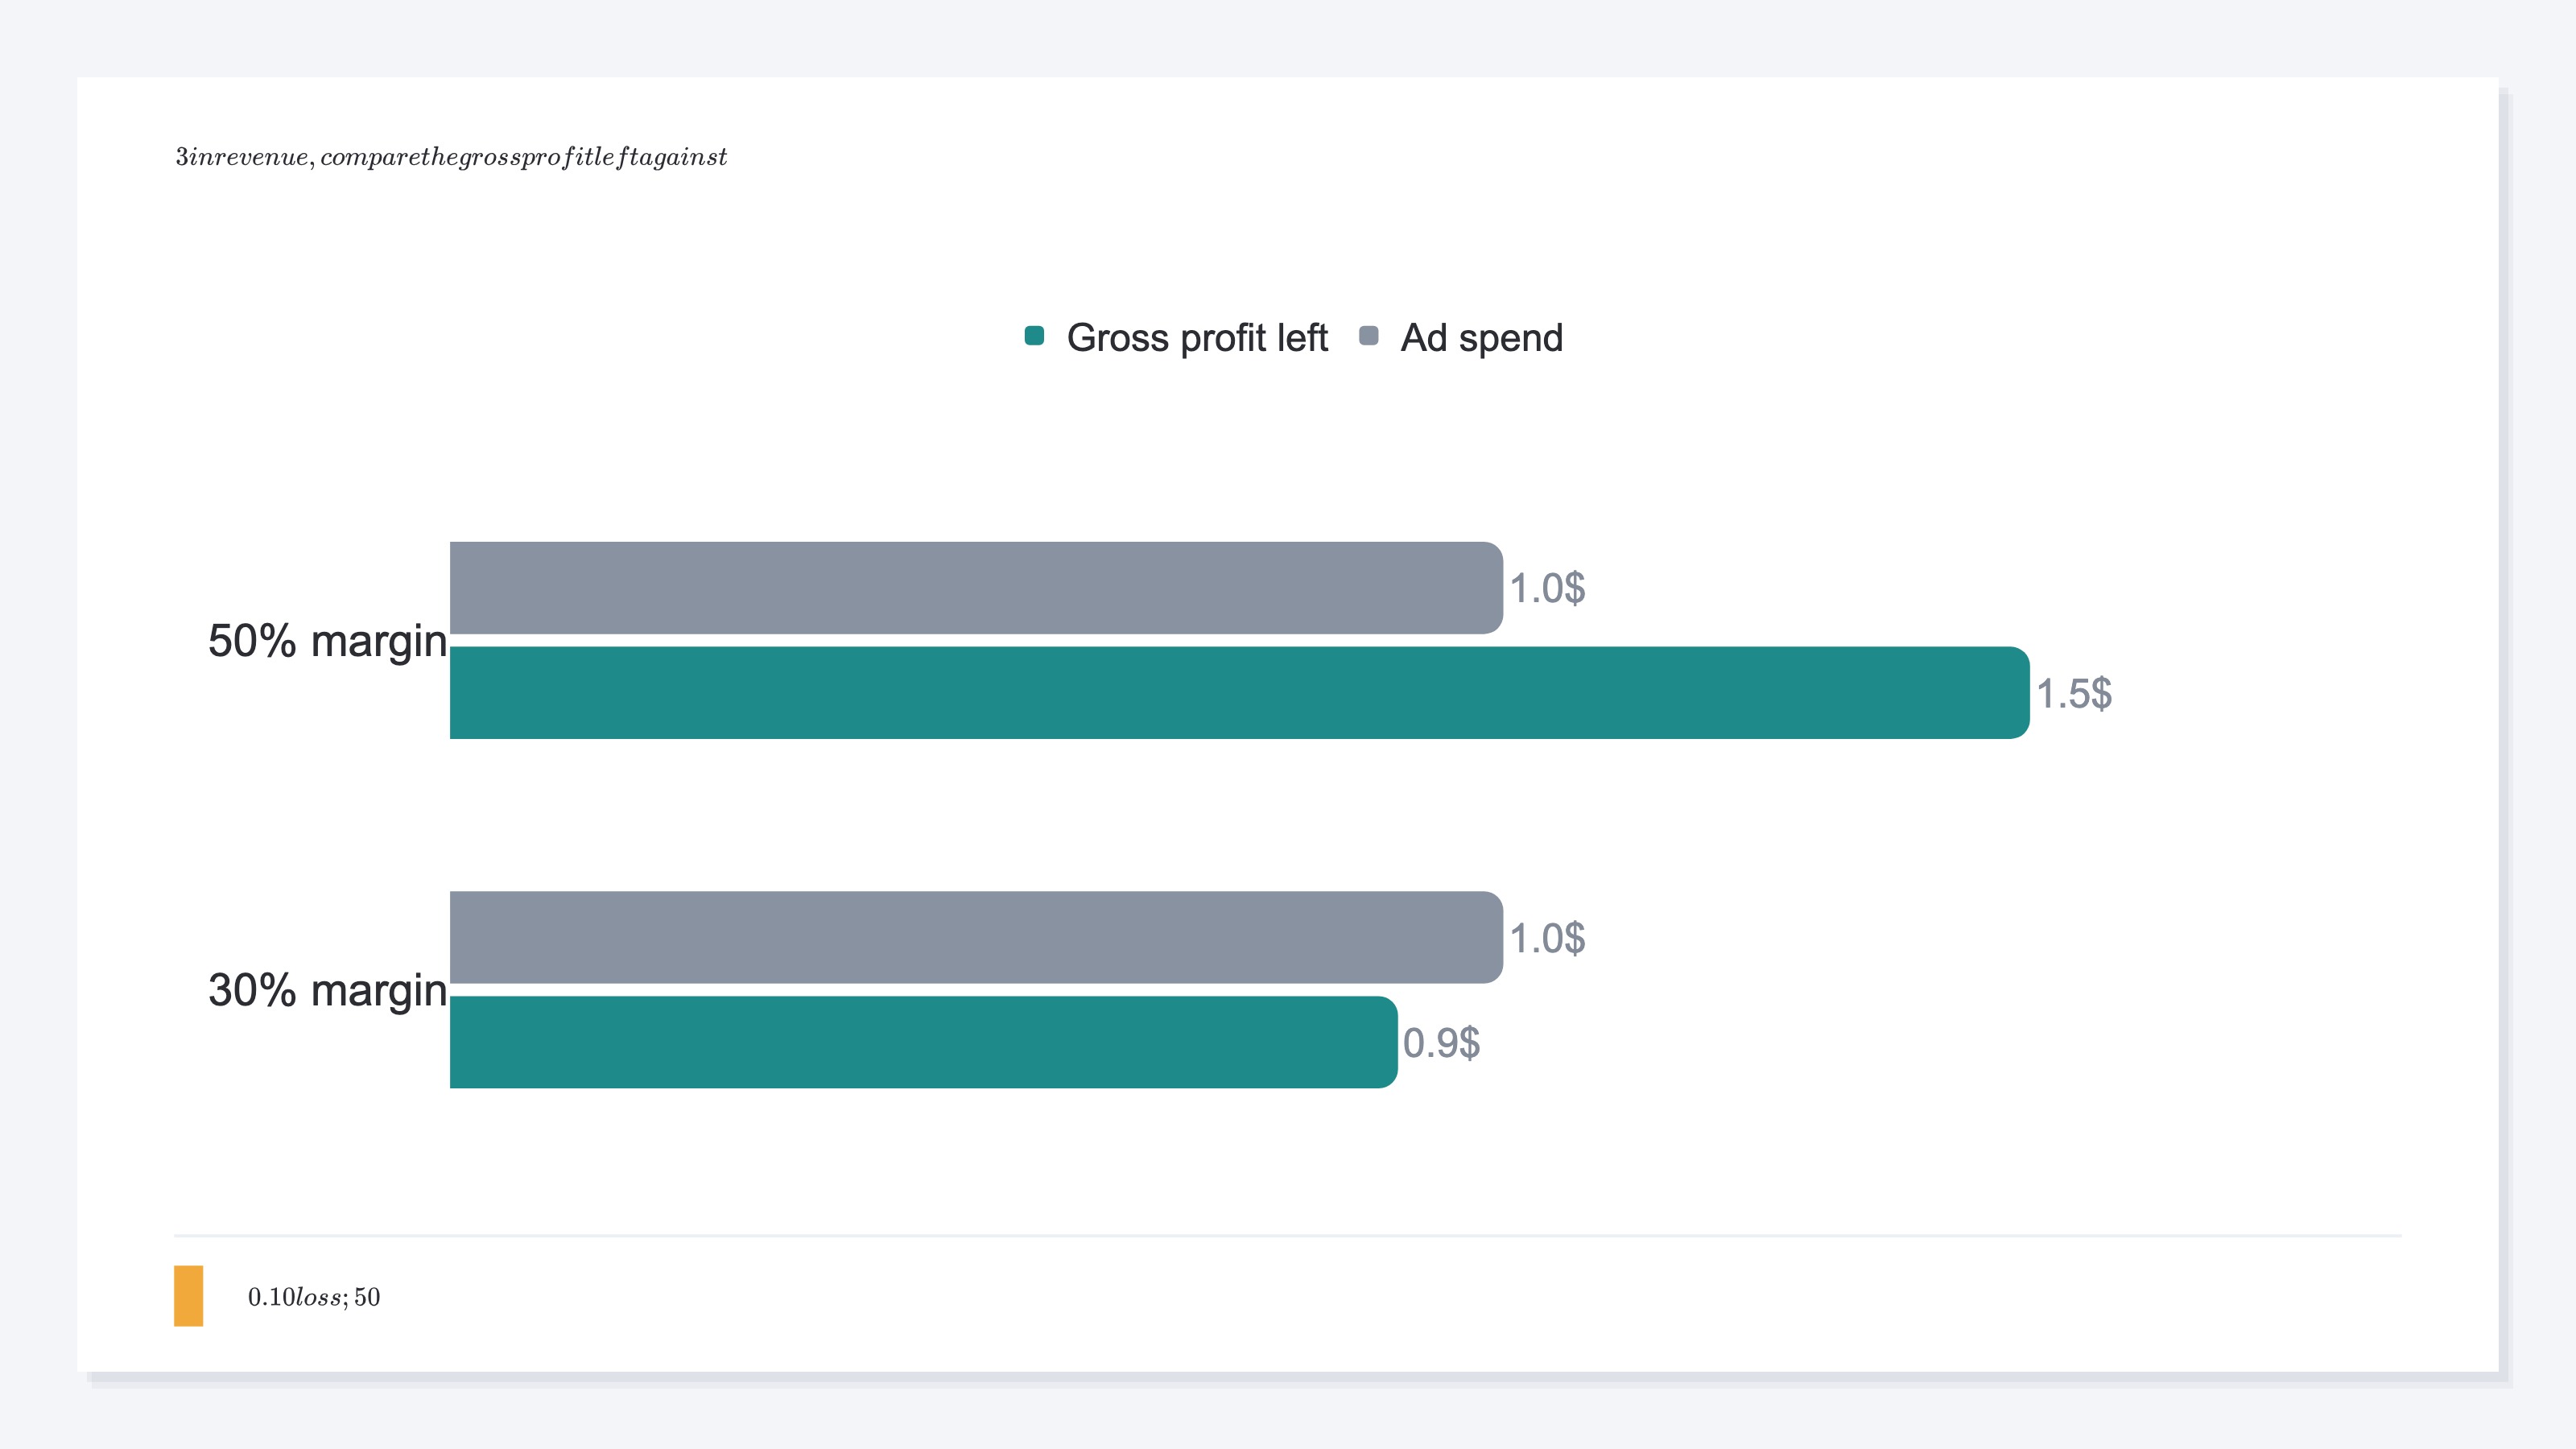
ROAS 300% means "$3 of revenue per $1 of ad spend" — revenue, not profit. At the same 300%, a different gross margin flips you between profit and loss.
Break that $3 of revenue down. At 30% margin, gross profit is $0.90; subtract $1.00 of ad spend and you're at a $0.10 loss. At 50% margin, gross profit is $1.50; subtract $1.00 and you keep $0.50. Same ROAS 300%, opposite outcome — one a loss, one a profit.
This is where judging on ROAS alone gets dangerous. The ad dashboard shows ROAS in big numbers, but that figure alone doesn't decide profit or loss. The lower the margin, the more often a healthy-looking ROAS leaves no profit behind.
Lining up break-even ROAS by margin makes the required level obvious. Thin-margin goods like electronics carry a high break-even point; thick-margin goods like cosmetics, a low one. So the same 300% can be a loss for electronics and a comfortable profit for cosmetics. Industry ranges are organized in ROAS Benchmarks by Industry 2026.
3. Judge by whether you clear break-even ROAS#
The order is simple. Instead of cheering or worrying against the industry average, check whether you clear your own break-even point.
First, confirm your gross margin. If COGS isn't clean, a rough "revenue − purchase cost − shipping − payment fees" estimate is fine. Once you have the margin, compute 1 ÷ gross margin for break-even ROAS, then compare it to your actual ROAS.
| Actual ROAS vs break-even | Verdict | Next move |
|---|---|---|
| Below 0.8× break-even | Loss | Pause delivery; revisit creative and targeting |
| 0.8–1.2× break-even | Even | Improve toward profitability |
| 1.2× break-even or above | Profit | You can consider scaling budget |
One caveat: repeat-driven products. For cosmetics and subscriptions, where second and later purchases are expected, first-purchase ROAS can sit below break-even and still turn profitable once you count the revenue a customer generates over time (LTV). The RPS calculation guide is a useful companion here. Pausing on first-purchase ROAS alone can cut a channel that was about to mature.
Up to this verdict, the thinking itself isn't hard. Get the margin, compute break-even ROAS, compare it to actual ROAS. The weight comes after this.
4. Even when profitable, ROAS alone can't decide the next move#
Break-even ROAS tells you "profit or loss." But "which channel to shift budget to next" isn't something ROAS can answer.
ROAS has a weakness: it can only evaluate channels you spent ad money on, and "biggest revenue" doesn't mean "most efficient." This is where revenue per session (RPS = Revenue Per Session) helps. RPS reflects how efficiently you turned the visits you gathered into revenue.
| Channel | Revenue per session (RPS) | How it reads |
|---|---|---|
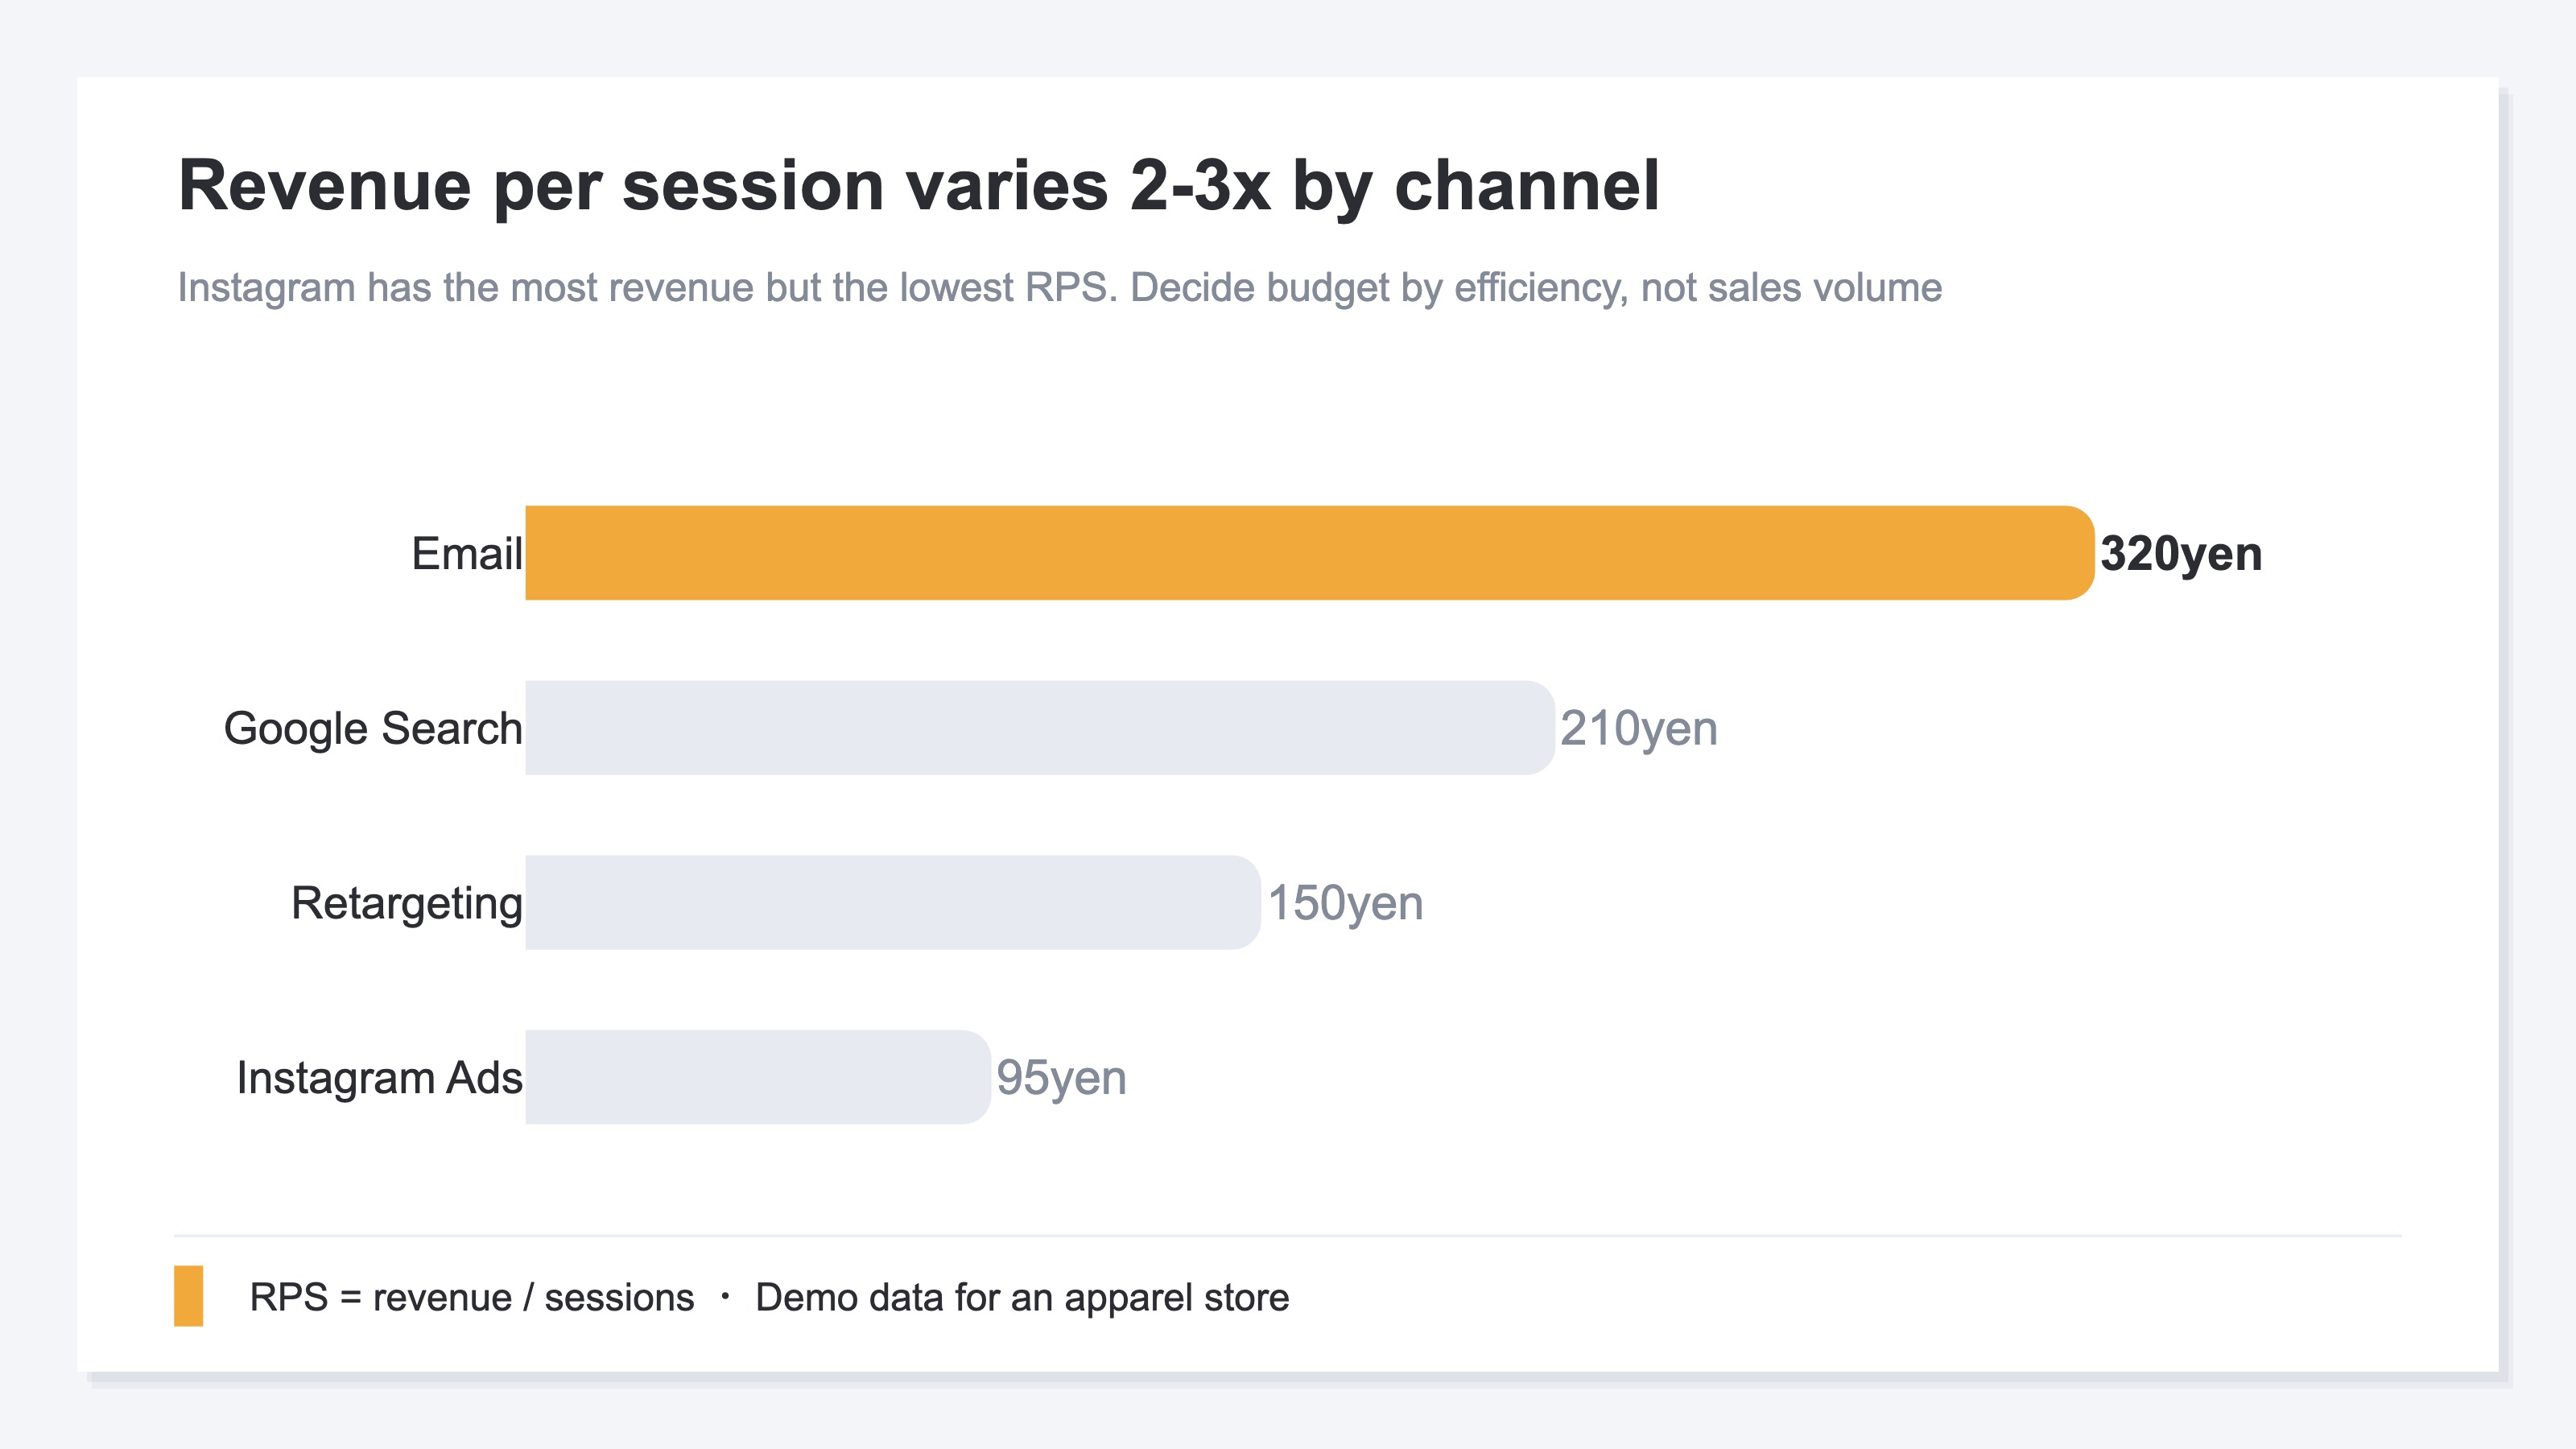
| Newsletter | ¥320 | Low delivery cost; the most efficient |
| Google search | ¥210 | Consistently efficient |
| Retargeting | ¥150 | Mid |
| Instagram ads | ¥95 | Biggest revenue, but lowest per visit |
Instagram ads often have the biggest revenue, so on ROAS alone the instinct is "spend more." But per visit it's the lowest, and adding budget just buys more low-efficiency visits. Meanwhile the newsletter, highest per visit and cheap to run, gets overlooked. Decide the next move by efficiency per visit, not by revenue size — that's the number to read once you're above break-even.
The thinking itself isn't hard. What's heavy is doing this every time, lining it up across channels by hand. Each platform's dashboard uses its own definitions, and duplicates creep in. GA4 can give you per-channel totals, but bringing RPS, AOV, and CVR onto one screen by channel — with duplicates removed — is a structural manual rebuild.
RevenueScope's solution
Let's see how "confirm profit at break-even, then decide the next move by per-channel efficiency" actually looks. RevenueScope brings per-channel revenue efficiency onto one screen from your GA4 and on-site sales data. It shows four metrics: Revenue / AOV / RPS / CVR.
| Channel | RPS (per session) | AOV (order value) | CVR (purchase rate) |
|---|---|---|---|
| Newsletter | ¥320 | ¥4,000 | 8.0% |
| Google search | ¥210 | ¥3,500 | 6.0% |
| Retargeting | ¥150 | ¥3,200 | 4.7% |
| Instagram ads | ¥95 | ¥5,300 | 1.8% |
(An illustration of how it looks per channel in RevenueScope. Figures are demo data.)
Reading this table (demo data for an apparel store) makes two things clear at once. First, the newsletter's RPS of ¥320 is the highest, while Instagram ads — biggest in revenue — have the lowest RPS at ¥95. Second, Instagram's conversion rate (CVR) is also low, so the visit quality itself is weak. Whether you clear break-even is judged against your margin, but which channels sell efficiently is obvious from this single view.
The next move follows directly. Pause the increase on Instagram, and shift the next budget toward the top-efficiency newsletter and the consistently strong Google search. Where ROAS alone might push you the wrong way — "grow Instagram, it has the biggest revenue" — per-channel RPS corrects it.
Note that RevenueScope does not compute gross margin, break-even ROAS, or profit itself. Break-even ROAS is a number you back-calculate from your own margin, and RevenueScope deliberately holds no direct ad-API connection. What it surfaces — with one tag, in five minutes — is per-channel real revenue efficiency (Revenue / AOV / RPS / CVR) with duplicates removed. Confirm profit with break-even ROAS, then use this efficiency view to decide which channels to grow.
FAQ#
Q. How do I calculate break-even ROAS?
A. It's 1 ÷ gross margin. At 30% margin that's 333%; at 50%, 200%. Only above that do you profit. If you don't have a clean margin, a rough "revenue − purchase cost − shipping − payment fees" estimate works.
Q. If my ROAS beats the industry average, am I safe?
A. No. A low-margin store can beat the industry average and still lose money. Compute your own break-even ROAS first and judge against that. For industry ranges, see ROAS Benchmarks by Industry 2026.
Q. Can RevenueScope output gross margin or ROAS?
A. No. RevenueScope surfaces revenue efficiency — Revenue / AOV / RPS / CVR — and does not compute gross margin, ROAS, or profit. Back-calculate break-even ROAS from your margin, then use RPS to decide which channels to grow once you're profitable.
Summary#
Gross margin is the share of revenue you keep ((revenue − COGS) ÷ revenue × 100). From it, the minimum ROAS to break even on ads back-calculates as break-even ROAS (1 / gross margin) — 333% at 30% margin, 200% at 50%. The same ROAS 300% flips between profit and loss depending on margin.
The reference for judgment is whether you clear your own break-even point, not the industry average. And once you've confirmed profit, decide the next move by per-channel revenue per session (RPS), not ROAS. Which channels sell efficiently above break-even — keeping that comparison ready is the shortest path to spending your ad budget without waste.
See which ads actually drive revenue, at a glance
Free up to 5,000 sessions/month, AI analyst included. No credit card required. Up and running in 5 minutes.