
"Our ad ROAS is 300%, so we're profitable." That line in marketing reports flips ad-budget decisions in the wrong direction. For a product at 30% gross margin, ROAS 300% is barely breakeven; at 20% margin, it's a loss.
This article covers the ROAS formula, breakeven ROAS from gross margin, why industry benchmarks mislead, four improvement levers, where RPS complements ROAS, and a 3-step self-measurement.
Table of contents
- The ROAS formula and the "100%" trap
- Don't confuse ROAS with ROI
- Breakeven ROAS — back-calculate the target from gross margin
- Industry benchmarks — reference points, not targets
- Four ways to improve ROAS — in priority order
- What ROAS doesn't see — complement it with RPS
- Measuring your own ROAS in 3 steps
- FAQ
TL;DR#
-
ROAS = ad-attributed revenue ÷ ad spend × 100 (%)
100% is not the breakeven point. The actual breakeven is breakeven ROAS = 1 ÷ gross margin × 100
-
Industry benchmarks (200–500%) are reference points, not targets
AOV, margin, and LTV vary within the same industry. Back-calculate from your own margin
-
ROAS is an ad-scoped metric
Organic search, social, and direct revenue need a separate axis — RPS — for whole-site decision-making
-
Your own ROAS can be measured in 3 steps
GA4 e-commerce events + UTM hygiene + an internal gross-margin check are the three pieces that put breakeven-ROAS judgment into routine operation
1. The ROAS formula and the "100%" trap#
Bottom line: ROAS 100% is not the breakeven point. Judge profit/loss against a margin-aware "breakeven ROAS."
ROAS (Return On Advertising Spend) measures how much revenue comes back per $1 of ad spend.
ROAS (%) = ad-attributed revenue ÷ ad spend × 100
Spend $1,000, get $3,000 in ad-attributed revenue → ROAS = 300%. Intuition says "ad spend equals revenue = breakeven," but revenue includes the cost of goods. For 70% COGS (30% margin) at ROAS 300%: revenue $3 − COGS $2.10 − ad spend $1 = −$0.10, a loss. Judging profit/loss on ROAS alone becomes more dangerous the lower the margin.
2. Don't confuse ROAS with ROI#
Bottom line: ROAS uses revenue, ROI uses profit. If someone says "ROI 300%" in an ad context, ask which definition.
| Metric | Formula | Numerator | Main use case |
|---|---|---|---|
| ROAS | revenue ÷ ad spend × 100 | Revenue (pre-margin) | Ad-campaign efficiency |
| ROI | profit ÷ investment × 100 | Profit (gross or operating) | Investment returns |
ROAS is ad-scoped and revenue-based. ROI is broader, profit-based, and includes non-ad costs. When someone says "ROI 300%" in an ad context, ask whether they mean ROAS or a true gross-profit ROI. Mixing the two on low-margin products produces backwards budget calls.
3. Breakeven ROAS — back-calculate the target from gross margin#
Bottom line: Breakeven ROAS = 1 ÷ gross margin × 100. Aim for 1.3× of breakeven as the profit target.
The most important formula in the article.
Breakeven ROAS (%) = 1 ÷ gross margin × 100
By margin:
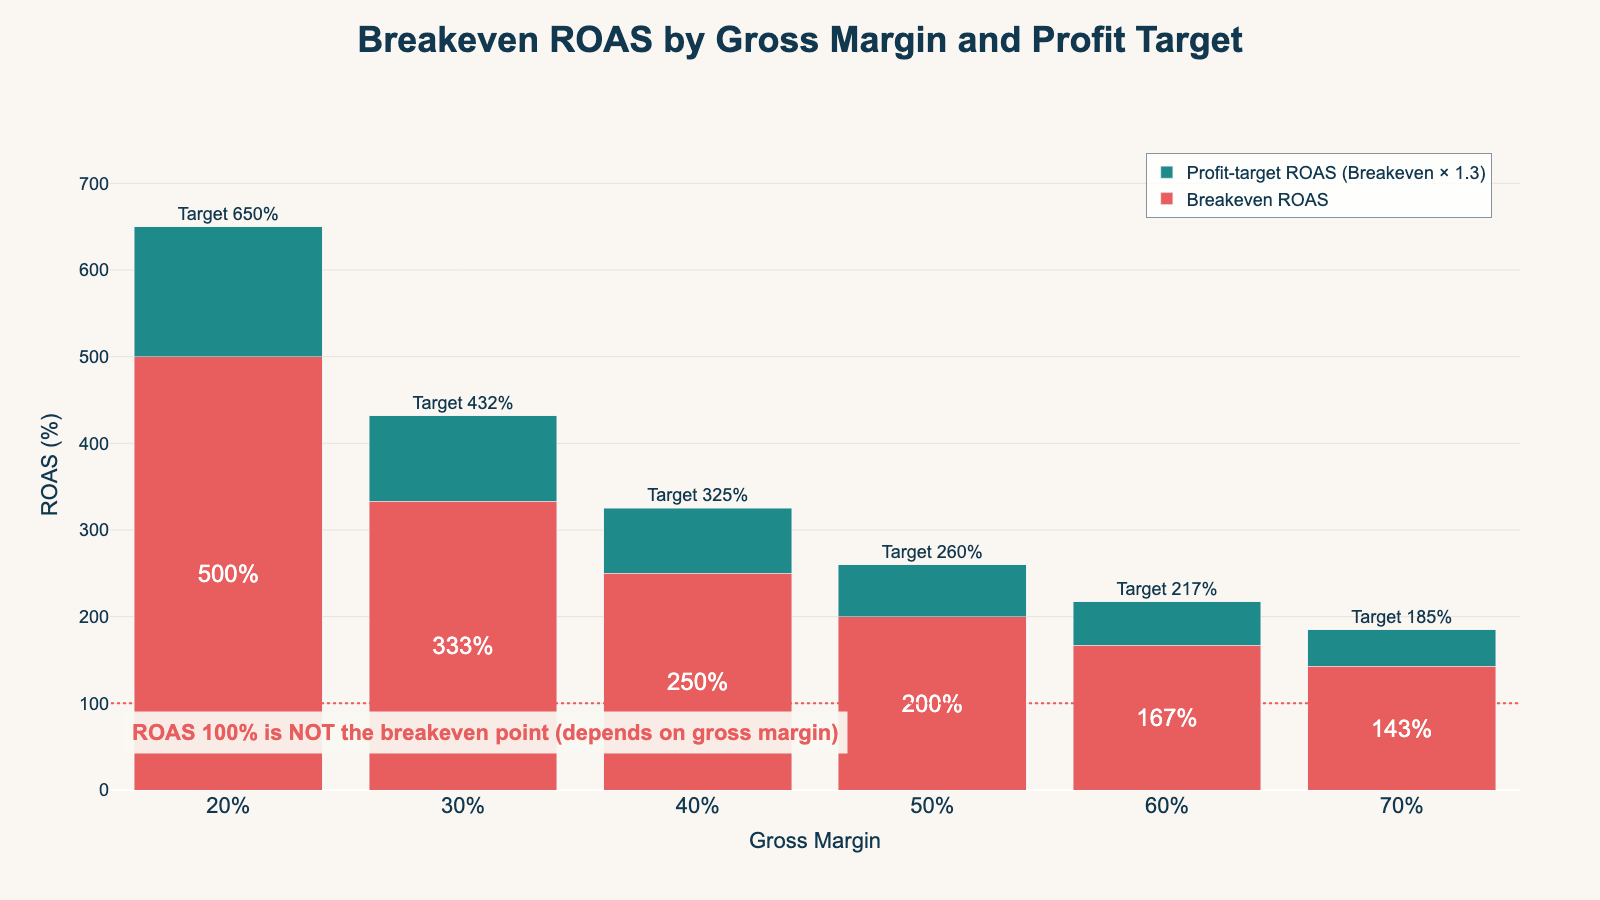
| Gross margin | Breakeven ROAS | Profit-target ROAS (× 1.3) |
|---|---|---|
| 20% | 500% | 650% |
| 30% | 333% | 433% |
| 40% | 250% | 325% |
| 50% | 200% | 260% |
| 60% | 167% | 217% |
| 70% | 143% | 186% |
At 40% margin, ROAS 250% is breakeven and 325% the threshold for ad-driven profit. "ROAS 300% so we're safe" is wrong for any sub-40%-margin product.
LTV changes the math#
For repeat-purchase categories (cosmetics, supplements, subscription EC), first-purchase ROAS alone can't determine profitability. At average 3 purchases, an LTV view makes first-purchase ROAS of 100–150% routinely viable (details: LTV Calculation Guide 2026 / the last-click trap).
4. Industry benchmarks — reference points, not targets#
Bottom line: Industry ROAS numbers are reference points. Set your own target from AOV, margin, and LTV.
Industry-specific ROAS data isn't well-covered by Japan's public statistics as of April 2026. Start with macro context.
Dentsu's "Advertising Expenditures in Japan 2024" reports internet ad spend at ¥3.65 trillion (109.6% YoY) in 2024[1], with EC-platform ad spend at ¥217.2 billion (103.4% YoY). CPC keeps rising; holding ROAS flat year over year requires steady gains in LP CVR or AOV.
METI's "EC Market Survey FY2024" puts Japan's B2C goods-EC market at ¥15.22 trillion with overall EC penetration at 9.78%[2]. By industry:
| Industry | EC penetration | Market size |
|---|---|---|
| Consumer electronics, AV, PC, peripherals | 43.03% | ¥2.74 T |
| Living goods, furniture, interior | 32.58% | ¥2.56 T |
| Apparel and accessories | 23.38% | ¥2.80 T |
| Cosmetics and pharmaceuticals | 8.82% | ¥1.02 T |
| Food, beverage, alcohol | 4.52% | ¥3.12 T |
High-penetration segments (electronics, living goods, apparel) have the most ad-platform competition and the highest CPCs, requiring margin-aware product economics and LTV-based judgments.
Industry targets shift with AOV and margin#
Even with "apparel EC ROAS benchmark 300–500%" in a vendor report, the target moves with AOV, margin, and repeat behavior:
- AOV $30, 40% margin, 1 purchase: breakeven 250%, profit target 325%
- AOV $150, 55% margin, 1 purchase: breakeven 182%, profit target 237%
- AOV $50, 45% margin, 3 repeats (LTV $150): first-purchase ROAS 200% is LTV-positive
Treat industry benchmarks as "where peers are landing" and base profit/loss judgment on breakeven ROAS.
5. Four ways to improve ROAS — in priority order#
Bottom line: Cut → CVR → AOV → measurement, in that order. "Courage to cut spend" outperforms "courage to add spend."
When ROAS falls below target (breakeven × 1.3 is a workable rule of thumb), the levers split into four categories.
Lever 1: Sharpen targeting — find the spend to cut first#
Most low-ROAS campaigns have the same root cause: ad spend is going to audiences that don't convert. Break out CV rate by platform/keyword/audience and pause the bottom 20% of ROAS — total ROAS routinely improves 20–30%. "Courage to cut spend" matters more than "courage to add spend."
Lever 2: Lift LP CVR#
ROAS is sensitive to "click → CV" probability. Moving CVR from 1.0% to 1.5% lifts ROAS by 1.5× at the same ad spend. Standard improvements: first-view headline + CTA visibility / fewer form fields / mobile optimization / social proof.
Lever 3: Lift AOV#
The numerator of ROAS is revenue. With CVR constant, raising AOV raises ROAS proportionally. Standard EC plays: cross-sell, bundles, free-shipping thresholds, subscription. Watch the free-shipping-threshold trap — it can lift AOV while dropping CVR. Judge with RPS (details: AOV Guide 2026).
Lever 4: Fix measurement leakage — UTM loss and Direct / (none)#
Often overlooked: the numerator of ROAS leaks. When UTM drops or referrer disappears in a redirect, ad-driven CV gets re-classified as "Direct / (none)" and ROAS is understated. When Direct / (none) exceeds 30%, 10–20% of ad-driven CV is typically hiding there — fix measurement first (details: GA4 'Direct / (none)' — 5 causes).
6. What ROAS doesn't see — complement it with RPS#
Bottom line: ROAS is ad-scoped, RPS is session-scoped. Read both side by side for budget decisions.
ROAS divides "ad-driven revenue" by "ad spend." By construction it ignores everything else: organic search, social, email, direct.
In real businesses ad-driven revenue is usually 30–50% of total; the remainder comes from organic, social, and repeat. ROAS shows ad-campaign efficiency but whole-site revenue efficiency stays invisible.
This needs RPS (Revenue Per Session) = revenue ÷ sessions — revenue-per-visitor across paid, organic, social, and direct. ROAS measures revenue per ad-dollar; RPS measures revenue per visitor. The two-axis view is the standard budget-decision toolkit (details: RPS Guide 2026).
7. Measuring your own ROAS in 3 steps#
Bottom line: GA4 e-commerce events + UTM hygiene + an internal gross-margin check are the three pieces that put breakeven-ROAS judgment into routine operation.
The formula is simple, but producing the number for your own business and comparing it against the target is separate work. Shortest path: 3 steps.
Step 1: Set up GA4 e-commerce events correctly#
Get the purchase event firing on every channel's converting checkout. Three things to verify:
- GTM fires
purchaseon the post-checkout thank-you page - Parameters
transaction_id/value/currencyare all captured - "Default channel grouping × purchase" matches your internal sales system within ±10% for 28 days
Step 2: Standardize UTM across the five main channels#
Align UTM across Google Ads, Meta Ads, LINE Ads, email, and social. A workable convention:
utm_source: google / meta / line / mailchimp / xutm_medium: cpc / display / email / socialutm_campaign: lowercase ASCII + hyphens
Aligning UTM with GA4's default channel grouping sharply reduces Direct / (none) leakage (details: Meta Ads UTM Source Complete Guide).
Step 3: Confirm gross margin internally and derive breakeven ROAS#
The last piece neither GA4 nor Google Ads gives you — gross margin. Weight by sales if margins differ by SKU, then compute 1 ÷ gross margin × 100 for the breakeven ROAS. Set profit target at 1.3× breakeven.
Once these run, put platform ROAS next to GA4 ROAS each week and ask: "Where is the numerator leaking? How does each tool define the denominator?"
RevenueScope solution
Bottom line: RevenueScope pulls the "compare the denominator and numerator every week" part of this 3-step workflow onto one screen. When ad spend is connected, it places per-channel ROAS (conversion value ÷ spend) and saturation next to your revenue metrics, lets you switch attribution models (last / first / linear / time_decay) in one click, and shows revenue that tends to sink into Direct / (none) as "Unattributed."
RevenueScope works with revenue-based ROAS and specializes in revenue, sessions, RPS, AOV, and CVR — plus per-channel ROAS and saturation once ad spend is connected. The gross margin you need for breakeven ROAS gets confirmed internally, as in the steps above. What RevenueScope aggregates is the ROAS denominator and numerator — which diverge between ad platforms and GA4 — lined up on a revenue-first basis so you can compare them. It complements GA4, so the weekly review runs on one screen.
FAQ#
Q1. Why don't platform ROAS and GA4 ROAS match?#
Different attribution logic. Google Ads uses in-platform attribution, Meta uses Meta Pixel, GA4 uses UTM. Same campaign commonly diverges by 10–30%. Always note which source you used as the numerator.
Q2. Is sub-breakeven first-purchase ROAS a problem for repeat categories?#
Short term yes, long term judge with LTV ÷ CAC. 3 purchases per customer, LTV $300, CAC $100 → LTV/CAC = 3.0, profitable. Standard for subscription / cosmetics / supplement EC.
Q3. Should I prioritize ROAS or CPA?#
Both. ROAS = revenue per ad-dollar, CPA = ad-dollar per CV. High-AOV products read more naturally on ROAS; low-AOV on CPA. In practice, track both.
Q4. Why are we above the industry-average ROAS but still unprofitable?#
Industry averages don't reflect your margin. An industry average 300% is a loss at 25% margin (breakeven 400%). Judge against your own breakeven ROAS, not an industry average.
Wrap-up#
- ROAS = ad-attributed revenue ÷ ad spend × 100 (%). 100% is not breakeven
- Breakeven ROAS = 1 ÷ gross margin × 100. Back-calculate the target from your own margin
- Industry benchmarks (200–500%) are reference points. Set targets from your AOV, margin, and LTV
- Four improvement levers — targeting, LP CVR, AOV, measurement fixes — in that order
- ROAS is ad-scoped. Whole-site revenue efficiency requires RPS
- Your own ROAS can be measured with GA4 e-commerce events + UTM hygiene + a gross-margin check
See which ads actually drive revenue, at a glance
Free up to 5,000 sessions/month, AI analyst included. No credit card required. Up and running in 5 minutes.
References#
- Dentsu "Advertising Expenditures in Japan 2024" February 2025
- Ministry of Economy, Trade and Industry "FY2024 E-Commerce Market Survey" August 2025


