You spend $3,000 a month on ads, yet you can't quickly answer "which ad made how much revenue." If you've ever clicked around GA4 and sighed, this article is your way out. Here's the bottom line first: GA4 not showing you "the ad that drove revenue" isn't a setup mistake. GA4 is built to fix site structure, not to show revenue directly. So what you need isn't to drop GA4 — it's to add a second axis beside it that reads revenue directly.
Table of Contents
TL;DR#
-
GA4 is a tool for fixing site structure
It's strong at reducing page drop-off and improving CVR, but it's not designed to show revenue directly
-
CVR is only an indirect metric of revenue
CVR can rise while revenue falls. It measures a ratio, not how much you earned
-
So add a direct metric as a second axis
Put one axis next to GA4 that reads "which channel earned how much" in actual revenue
-
RPS (revenue per session) sits at the center of that axis
Don't be fooled by traffic volume — compare channels by how much revenue one session produced
1. GA4's purpose is optimizing site structure#
Bottom line: GA4 tells you "how to fix the site so people buy more." It isn't designed to show revenue directly.
GA4 is an excellent behavior-analytics tool. Pageviews, sessions, bounce rate, engagement time, and conversion rate (CVR) — all of it is tuned to record how customers move on your site.
With these you can learn things like:
- Which pages lose the most visitors
- Where in the funnel people stop buying
- Which page change lifted CVR
- How the experience differs between mobile and desktop
In other words, GA4 tells you "how to fix the site so people buy more easily." For improving product pages or optimizing the checkout form, and measuring those effects, it is very strong.
But what an EC seller really wants to know is a different question:
"I spent $500 on Instagram ads yesterday. How much of that became revenue?"
"Search ads versus display ads — which one is actually profitable?"
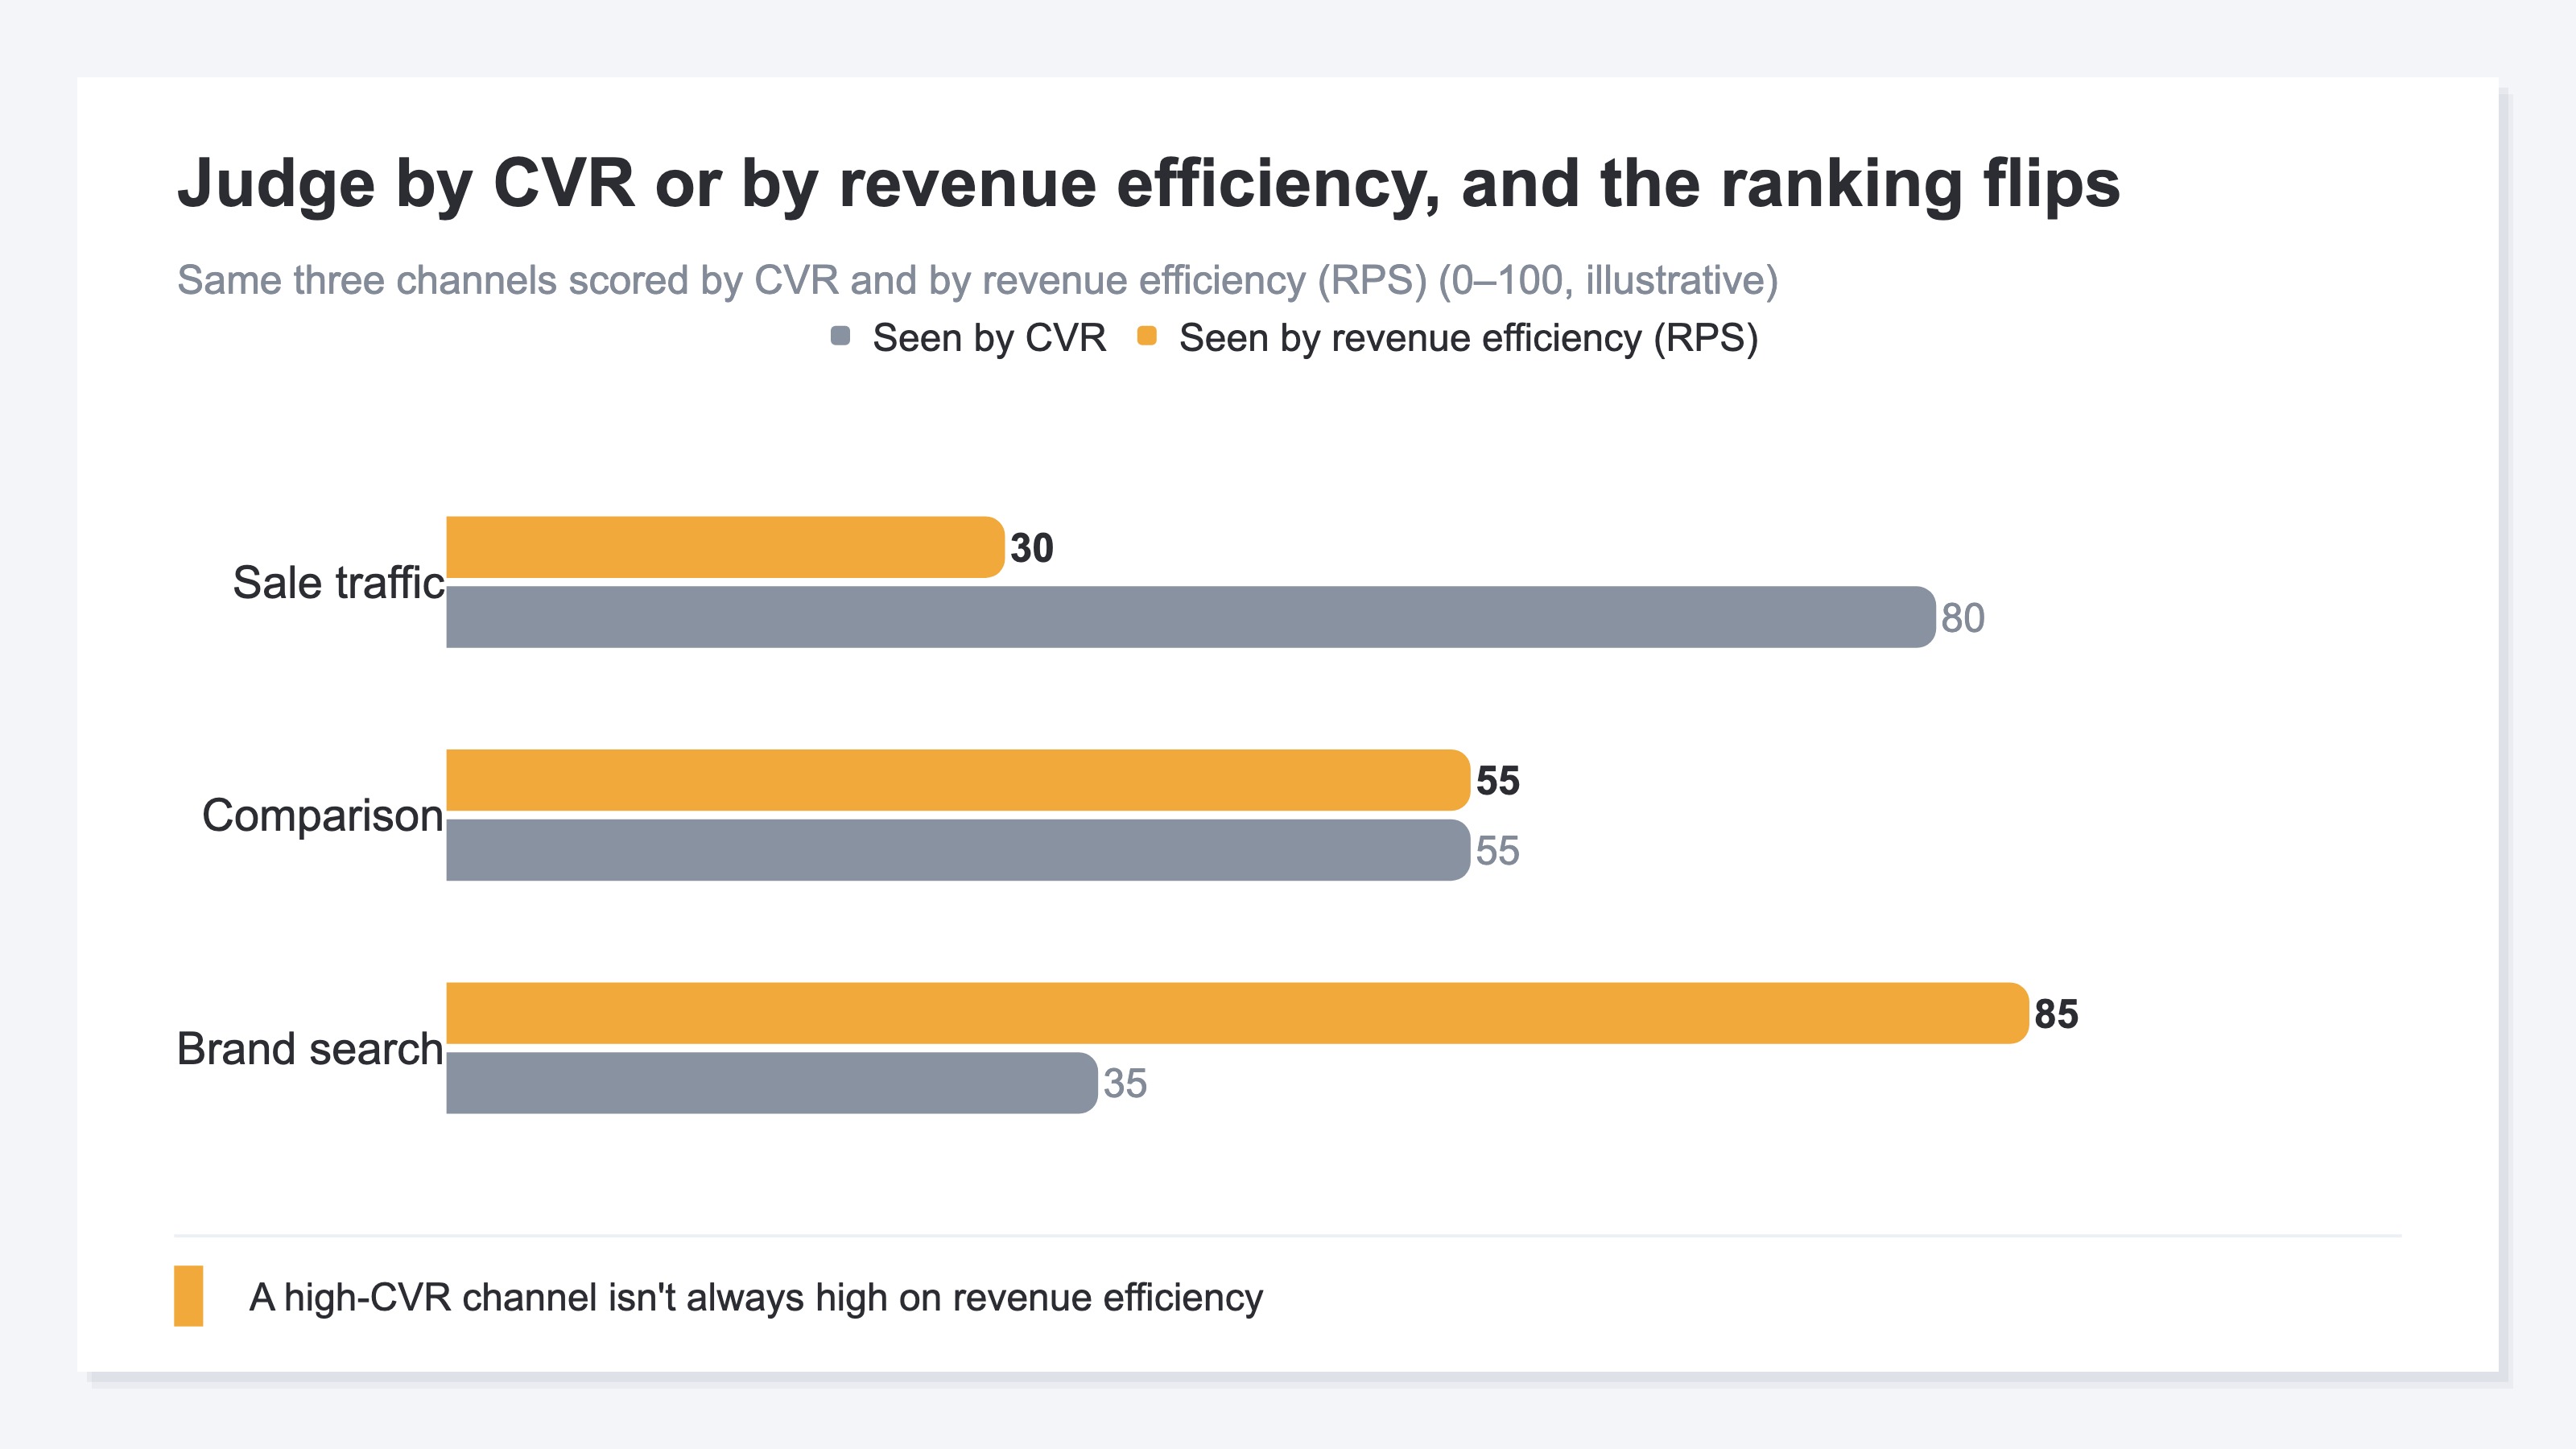
These sit on a different layer from "how to fix the site." You want the relationship between ad channels and revenue, not "where customers dropped off." It's only natural that no amount of clicking through GA4 answers this in one shot — GA4 wasn't built to answer it.
GA4 also defaults to last-click, assigning a sale to the final touch before purchase. That, too, hides upstream contribution — but switching models is its own topic, covered in a separate article (Moving budget on last-click alone costs you). Here we focus on the step before that: you need an axis that reads revenue directly in the first place.
2. What you lose by moving budget on CVR alone#
Bottom line: CVR is an indirect metric of revenue. Move budget on a high CVR alone, and revenue per session shrinks.
CVR, which many marketers chase daily, is an indirect metric of revenue. A higher CVR tends to come with higher revenue, but it doesn't translate directly. In practice, things like this happen all the time:
- CVR rose, but revenue fell. A form fix lifted CVR from 3% to 4%, but traffic dropped and purchases fell
- CVR fell, but revenue rose. A new channel doubled sessions, CVR slid from 2% to 1.5%, but revenue grew 1.3x
- CVR is flat, but the mix is skewed. The total is the same, yet low-priced items sell while high-priced ones don't
You can't catch these by watching CVR alone. CVR is the ratio of "how many you converted on-site," not "how much you earned."
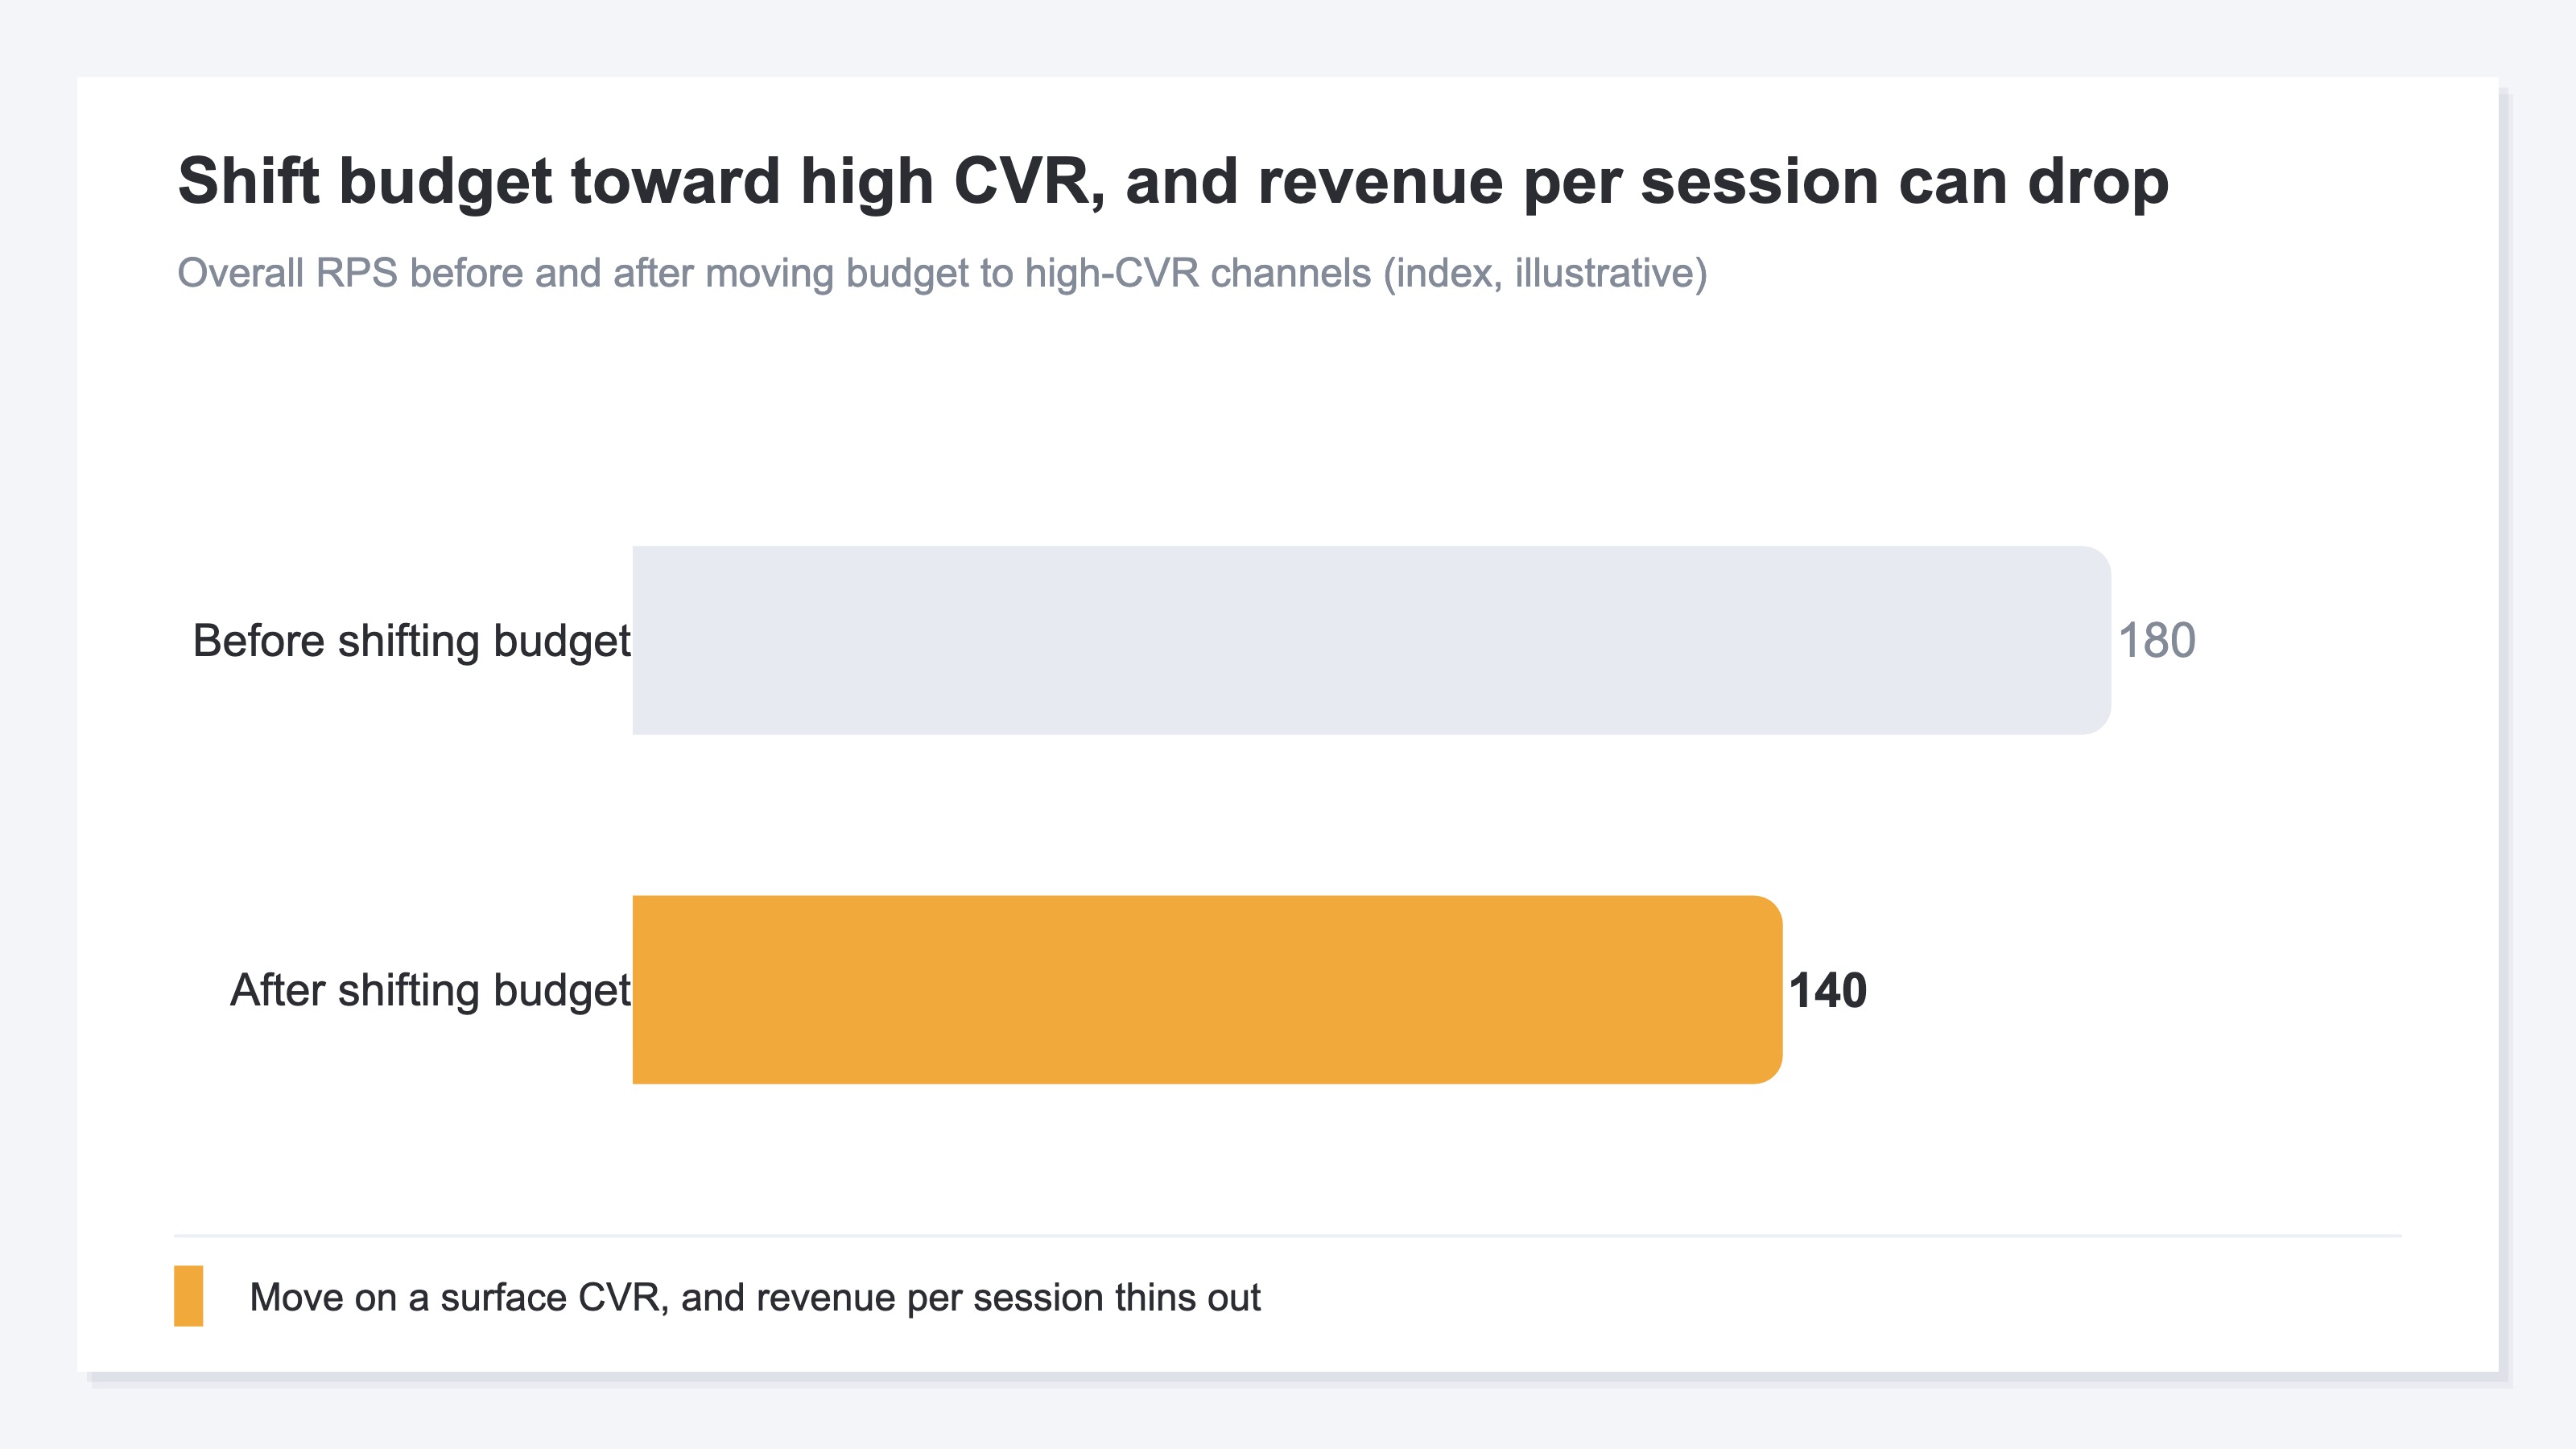
Say you shift budget toward sale-driven traffic because its CVR is high. The conversion rate is indeed high. But if the average order value is low, revenue per session doesn't grow — only the ad spend does. Move budget on a surface-level CVR, and you protect the visible conversion rate while quietly thinning out your revenue efficiency. That's the trap of judging on indirect metrics alone.
3. The move: hold indirect and direct metrics on two axes#
Bottom line: keep using GA4's indirect metrics, and add a "direct metric (RPS)" that reads revenue as a second axis.
The key here is not to write off GA4. It's an essential tool for site improvement, and there's no reason to drop it. The problem is trying to answer "which channel earned how much" with GA4 alone. So the move is simple: hold your metrics on two separate axes.
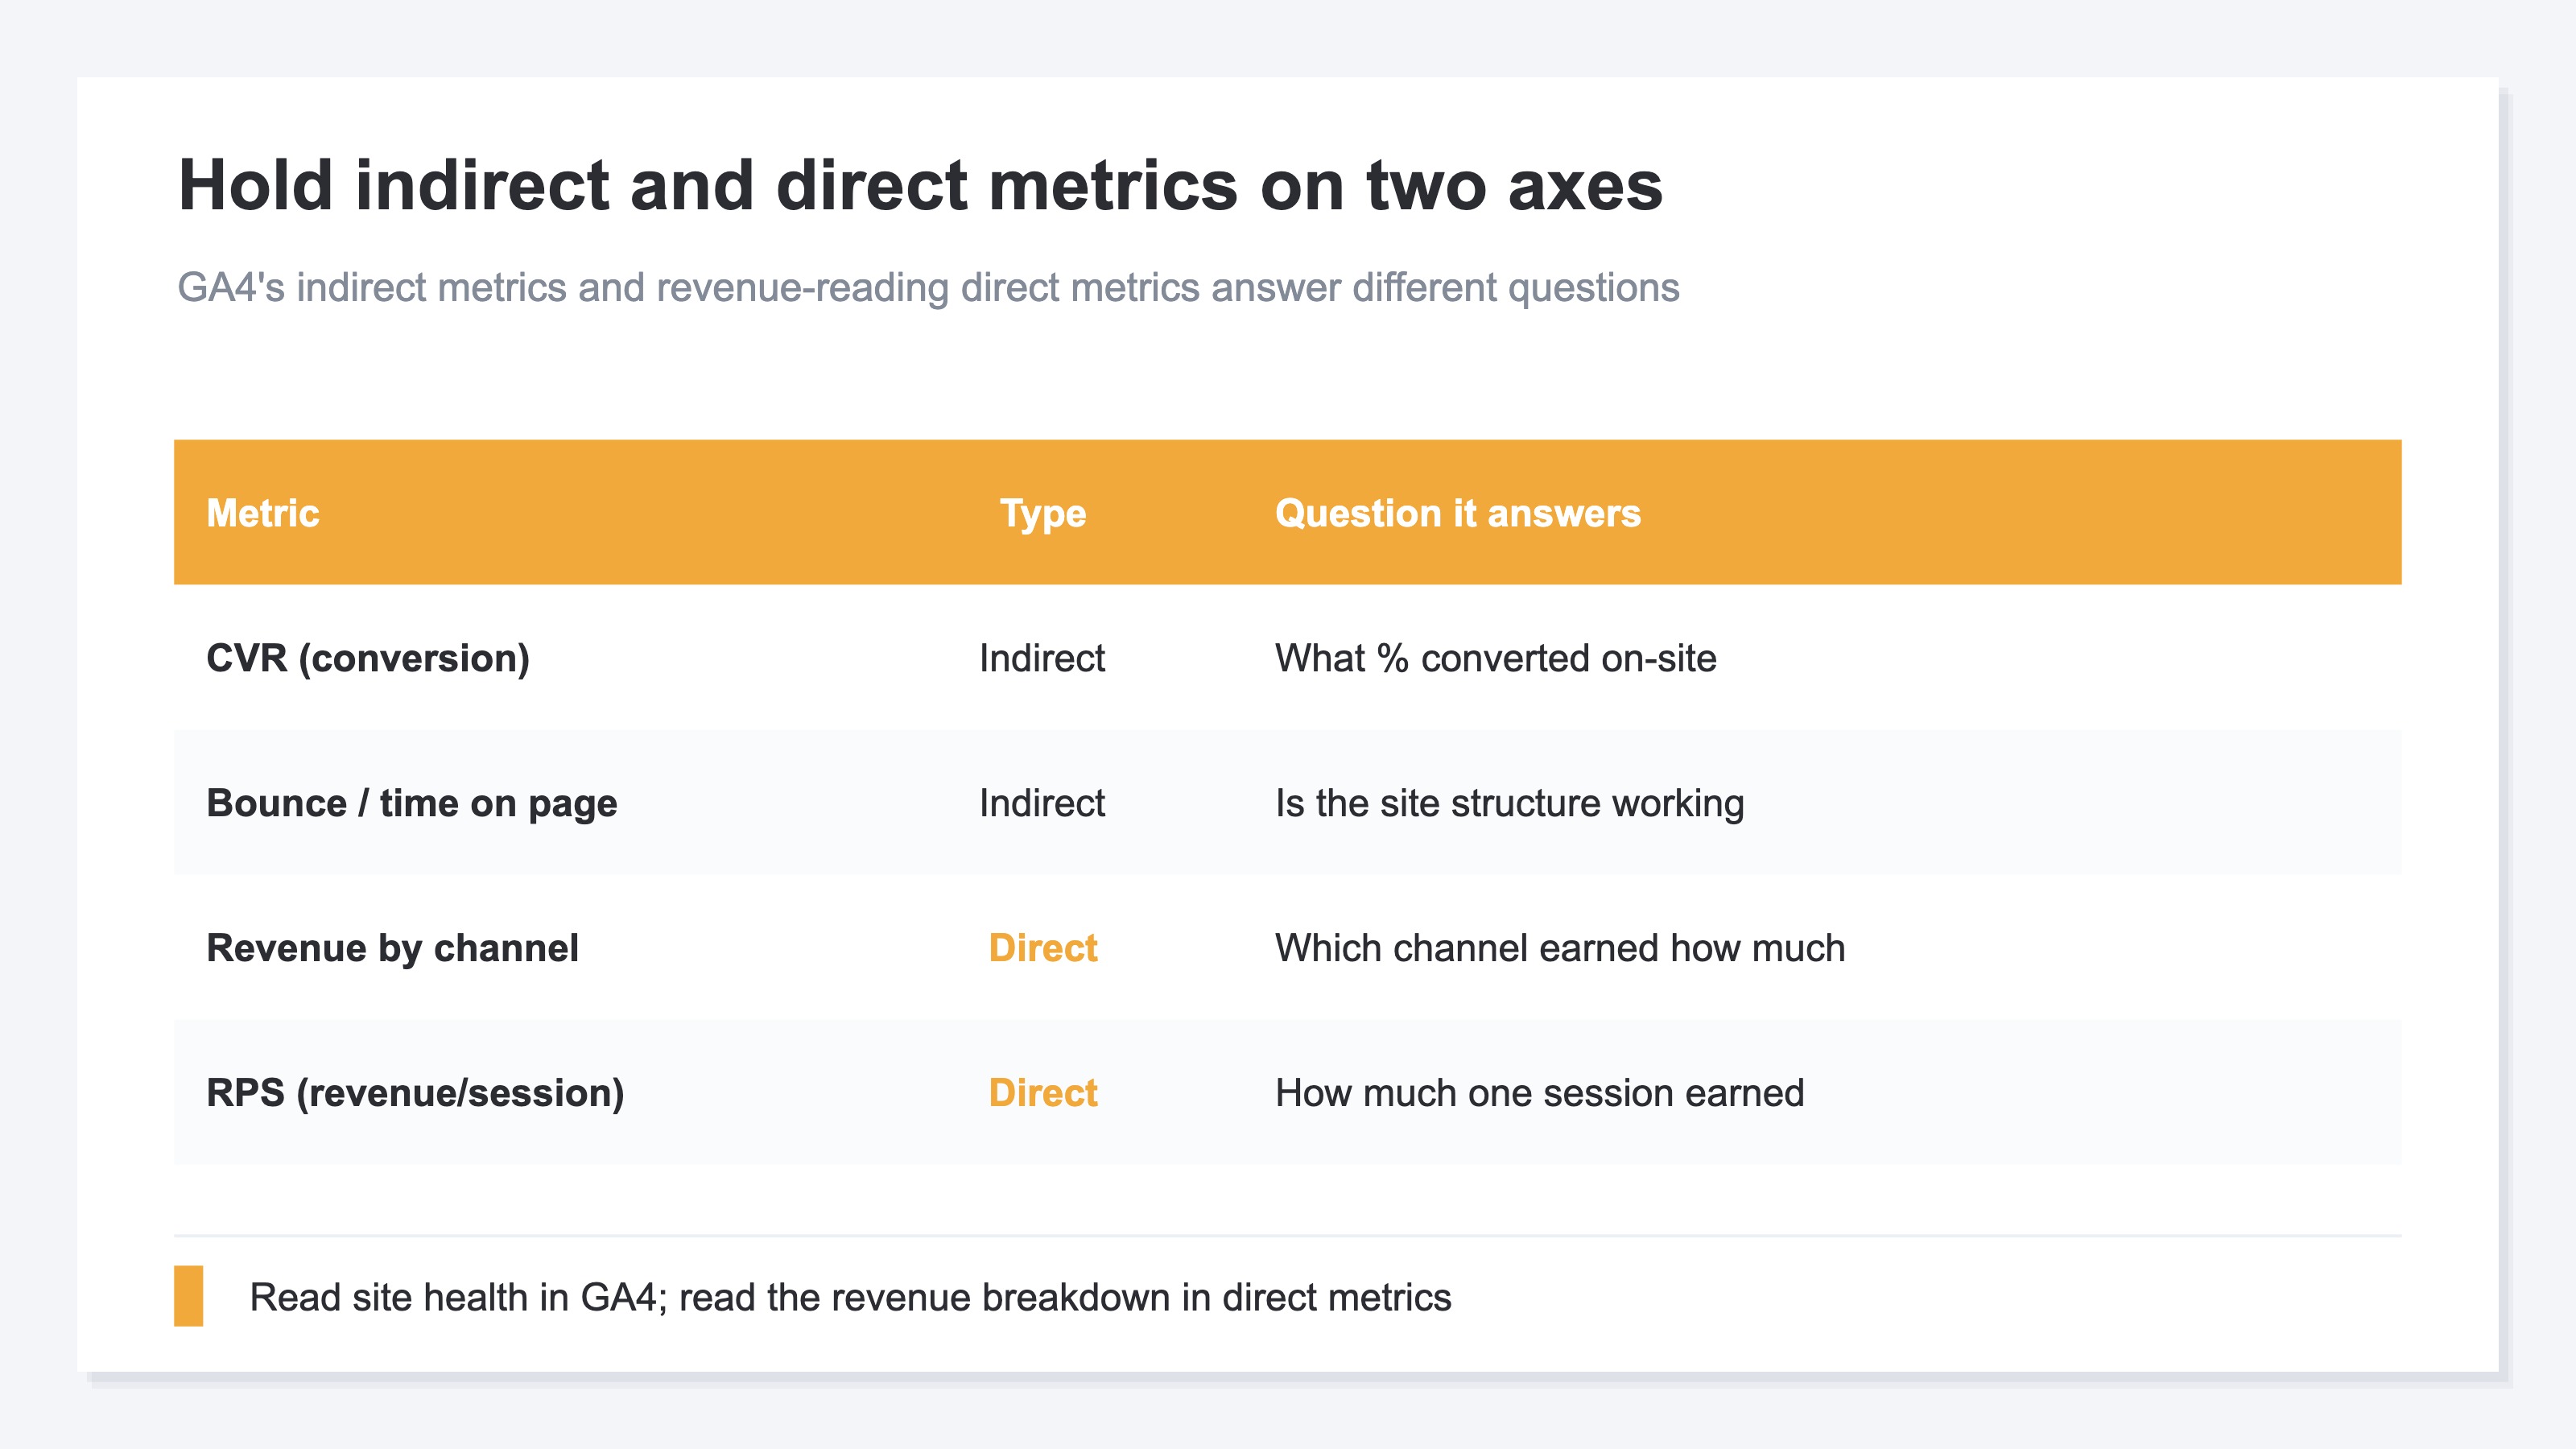
- Indirect metrics (GA4's strength): CVR, bounce rate, engagement time. They gauge whether the site structure works, and guide page fixes and form optimization
- Direct metrics (the second axis): revenue by channel, RPS (revenue per session), AOV. They gauge which channel earned how much, and guide ad-budget allocation
At the center of that second axis is RPS (revenue per session) — how much revenue one session produced. CVR and traffic volume don't tell you how much revenue a channel made. RPS lets you compare channels on equal footing by "how much one visit turned into," without being fooled by high or low traffic.
The idea itself is simple. The real work is not doing it once, but repeating it every time a channel or campaign changes — realigning revenue across channels by hand each time. GA4's ecommerce integration shows revenue figures, but getting "which channel earned how much" into a state you can see at a glance every day means rebuilding exploration reports again and again. The simpler the idea, the heavier it gets when repeated.
RevenueScope solution
CVR not showing revenue, and building a direct metric being heavy, share one root: GA4 is optimized for indirect metrics (site health) and isn't designed to put the revenue breakdown on one screen.
GA4 can show revenue by channel. But getting it into a state where you compare it daily on a common yardstick like RPS and AOV, on clean numbers with bots removed, means rebuilding exploration reports — structurally heavy work.
RevenueScope aligns revenue by channel onto common yardsticks — RPS (revenue per session), AOV, and CVR — and shows it on one screen. Because the numbers are clean with bots removed, a channel's real shape that indirect metrics can't reveal — like "high CVR but low revenue efficiency" — shows up on the spot.
On top of that, RevenueScope splits each channel's revenue by new versus returning. You can check whether a high CVR comes from new-customer acquisition or returning-customer re-engagement, so you avoid moving budget on a surface number alone.
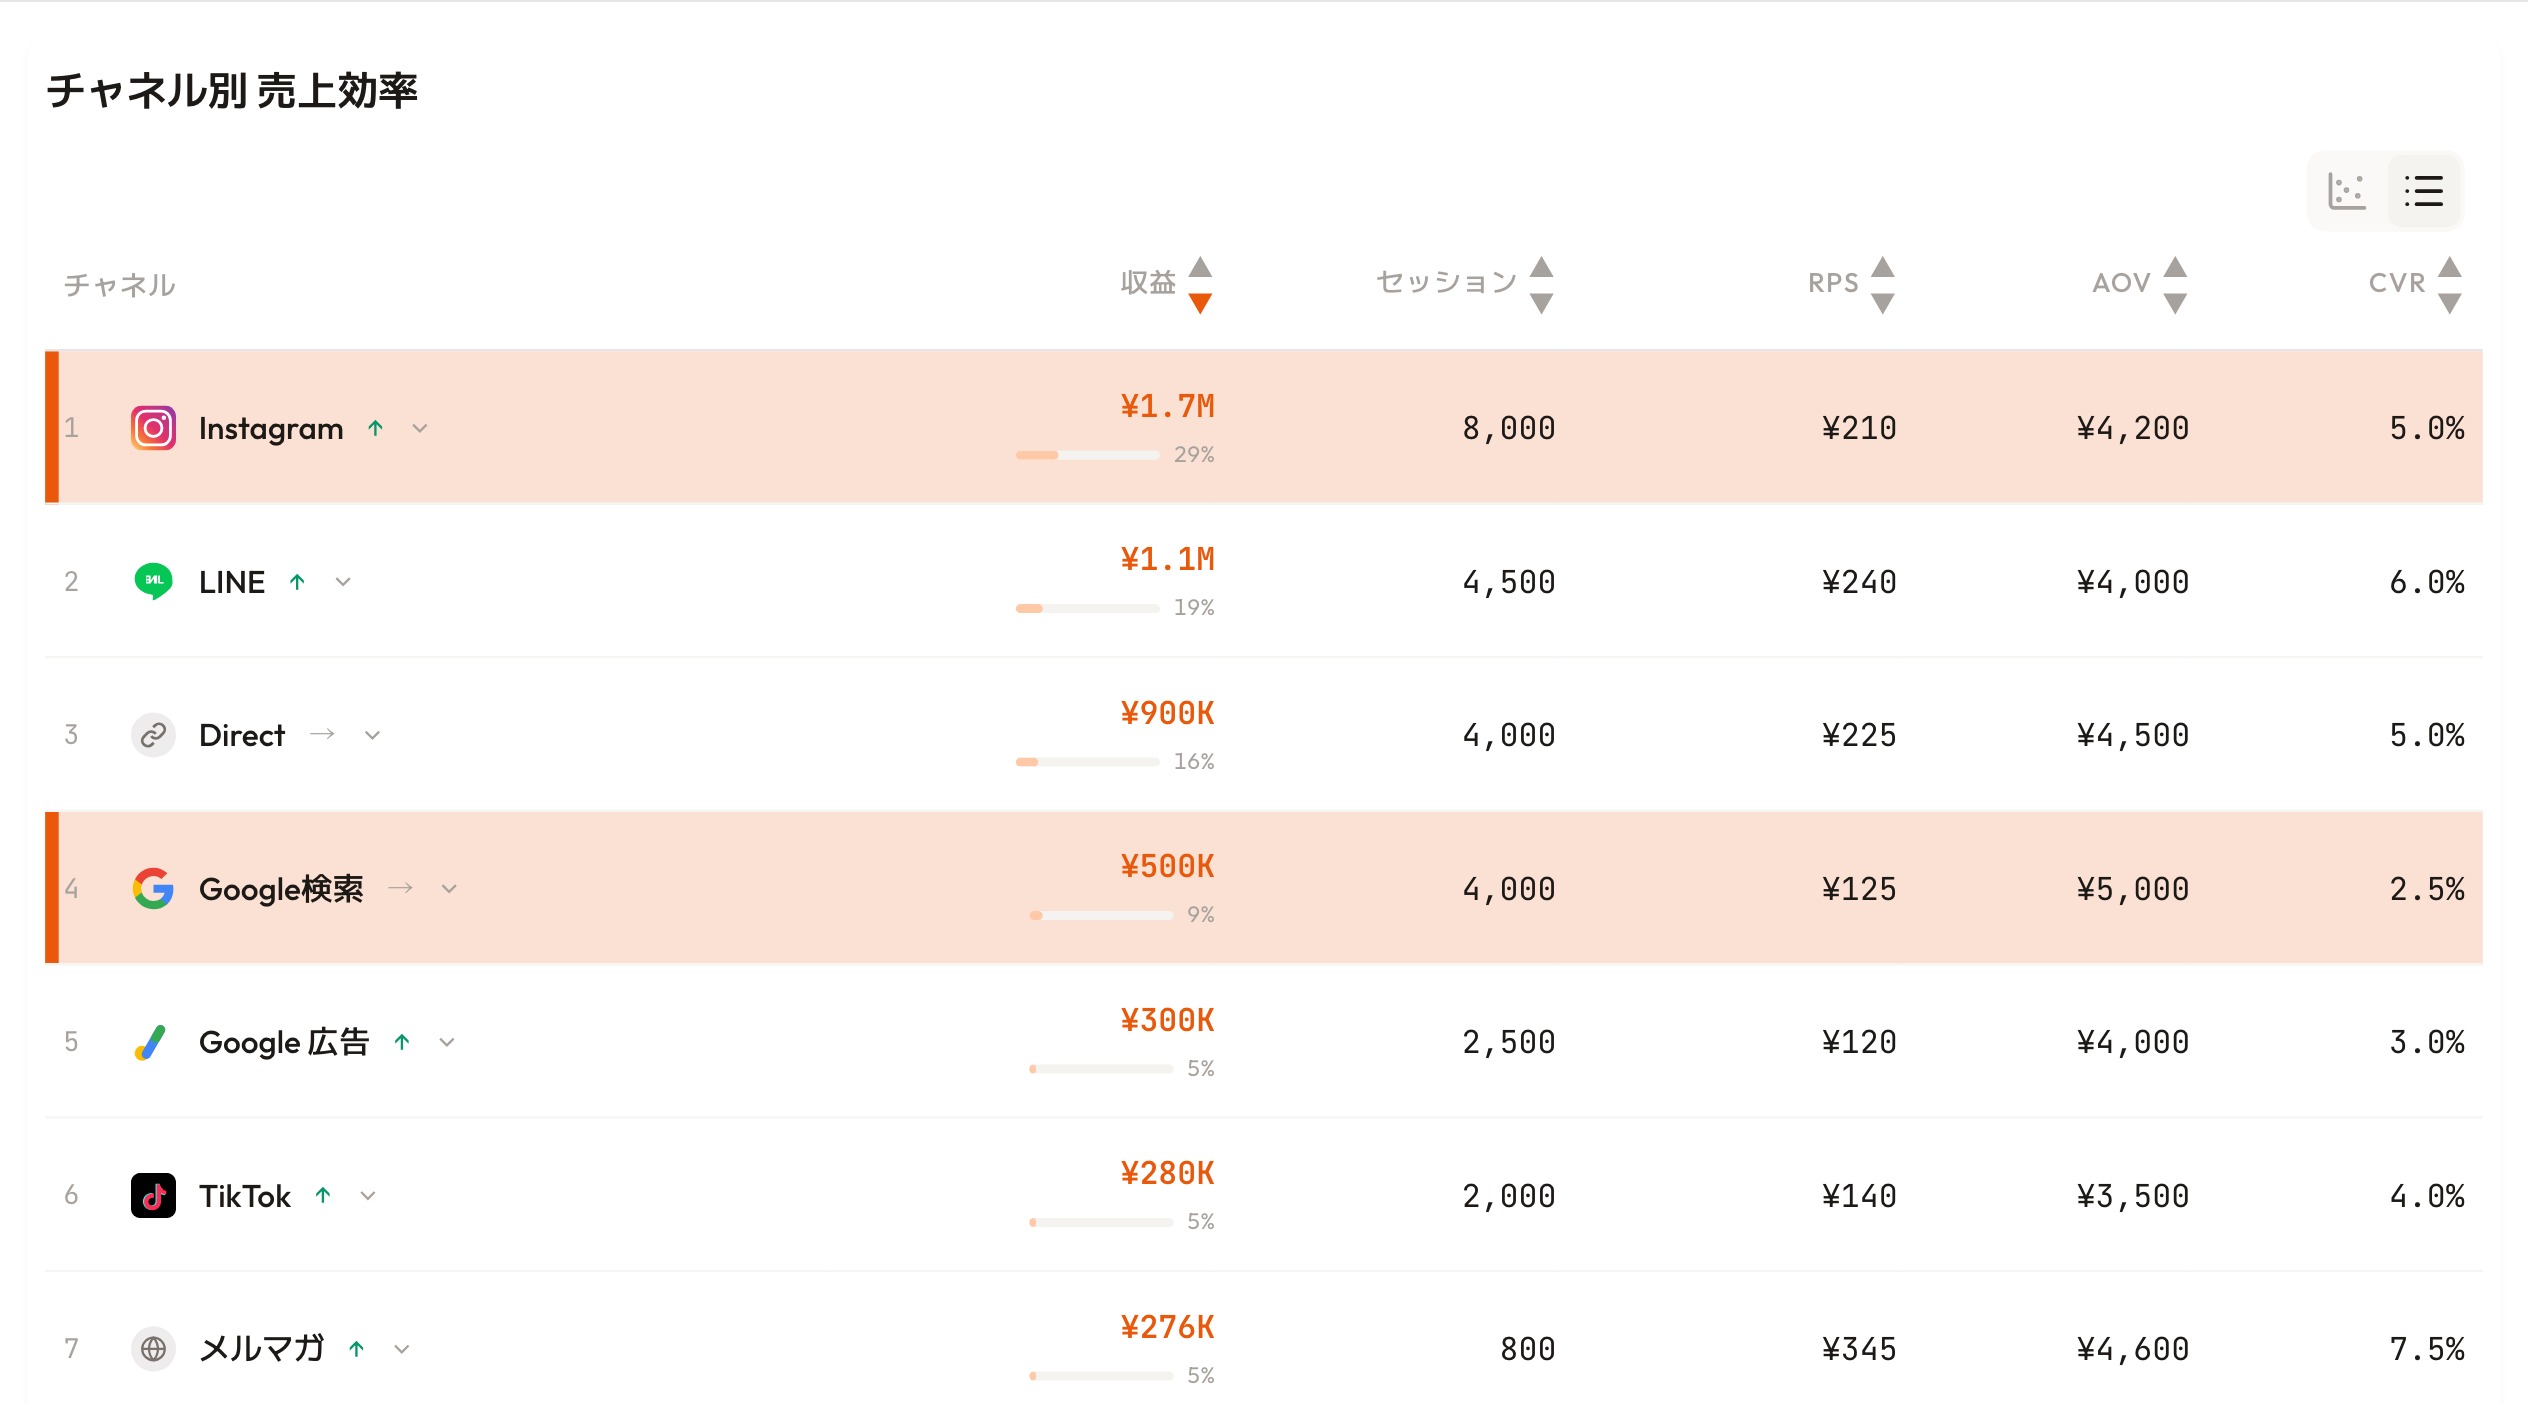
RevenueScope dashboard (demo data shown). Every channel lines up on common yardsticks; read the revenue breakdown on one screen.
The screen above lines up every channel on common yardsticks like RPS. Google search (RPS ¥125), which tends to close, and Instagram (RPS ¥210), which creates upstream demand, sit on the same footing. Keep using GA4's indirect metrics for site improvement, and put this direct-metric screen beside it. That's far more practical than building perfect measurement from scratch.
FAQ#
Frequently asked questions#
Q. Should I stop using GA4?
A. No. GA4 is essential for improving site structure. To find high-drop-off pages or CVR improvement points, mastering GA4 is the shortcut. The problem is trying to answer "which channel earned how much" with GA4 alone. Find indirect metrics in GA4, and read the revenue breakdown with direct metrics — that division of roles is the practical approach.
Q. Does that mean chasing CVR is pointless?
A. No. CVR is a good metric for whether the site is working. It's just insufficient as a metric for how much the business earned, because CVR is a ratio, not an amount. CVR (indirect) and revenue / RPS (direct) aren't either-or — the right answer is to hold both.
Q. What is RPS, and how does it differ from CVR?
A. RPS (revenue per session) is a direct metric for how much revenue one session produced. Where CVR is a ratio — "what percent converted" — RPS is an amount: "how much one visit turned into." Even with high traffic, a low RPS means low revenue efficiency, so you can compare channel quality in revenue terms that CVR alone can't show.
Conclusion#
GA4 not answering "which ad sold how much" isn't about using it wrong. GA4 is built to fix site structure, not to show revenue directly. Indirect metrics like CVR are excellent for gauging site health, but — as when CVR rises without revenue — moving budget on them alone thins out your revenue efficiency.
What matters isn't dropping GA4, but holding a second axis beside it that reads revenue directly. Compare revenue by channel on a common yardstick like RPS, on clean numbers with bots removed, and split new from returning. As a first step, take your main channels and review their revenue from the RPS angle rather than CVR. The "channel with high CVR but low revenue efficiency" tends to show up.
See which ads actually drive revenue, at a glance
Free up to 5,000 sessions/month, AI analyst included. No credit card required. Up and running in 5 minutes.
References#
- Google Analytics "Analytics Help: GA4 overview" 2024
- Google Analytics "About conversions (key events)" 2024
- Google Analytics "Set up ecommerce tracking" 2024