
"My executive team told me to put LTV in the monthly report, but four or so formulas came up and I can't pick one." It's a line you hear often on the ground in ecommerce.
But the only ones an SMB EC owner needs to nail down are Simple LTV and Gross Margin LTV—just two. The remaining three (Cohort / LTV/CAC ratio / DCF type) are refinement techniques for dedicated analysts. And there's one more important thing: LTV isn't done once you compute it. It only starts to mean something when you connect it to "where to put your acquisition effort next." This article organizes the calculation methods first, then walks step by step through what you should actually look at to raise LTV.
Contents
- What is LTV (Customer Lifetime Value)? | a product of three numbers
- Five LTV calculation methods | start with two
- The key to raising LTV is repeat | but the number won't say who brought the customer
- The wall beyond LTV | the source of high-value customers isn't in the standard reports
- How RevenueScope helps
- FAQ
- Summary
What this article covers#
- LTV is a product of three numbers: "average order value × purchase frequency × customer lifespan." For SMB EC, the two to remember are Simple LTV and Gross Margin LTV; the other three are for dedicated analysts.
- The key to raising LTV is "repeat"—the same customer buying again and again. But a single number like LTV won't tell you which channel that customer came from.
- "Which channel brings the high-value (repeat) customers" and "how revenue per session differs between new and returning visitors" structurally do not show up in GA4's standard reports. To connect LTV to your next acquisition decision, you have to look at the source of your high-value customers through channel-level revenue.
1. What is LTV (Customer Lifetime Value)? | a product of three numbers#
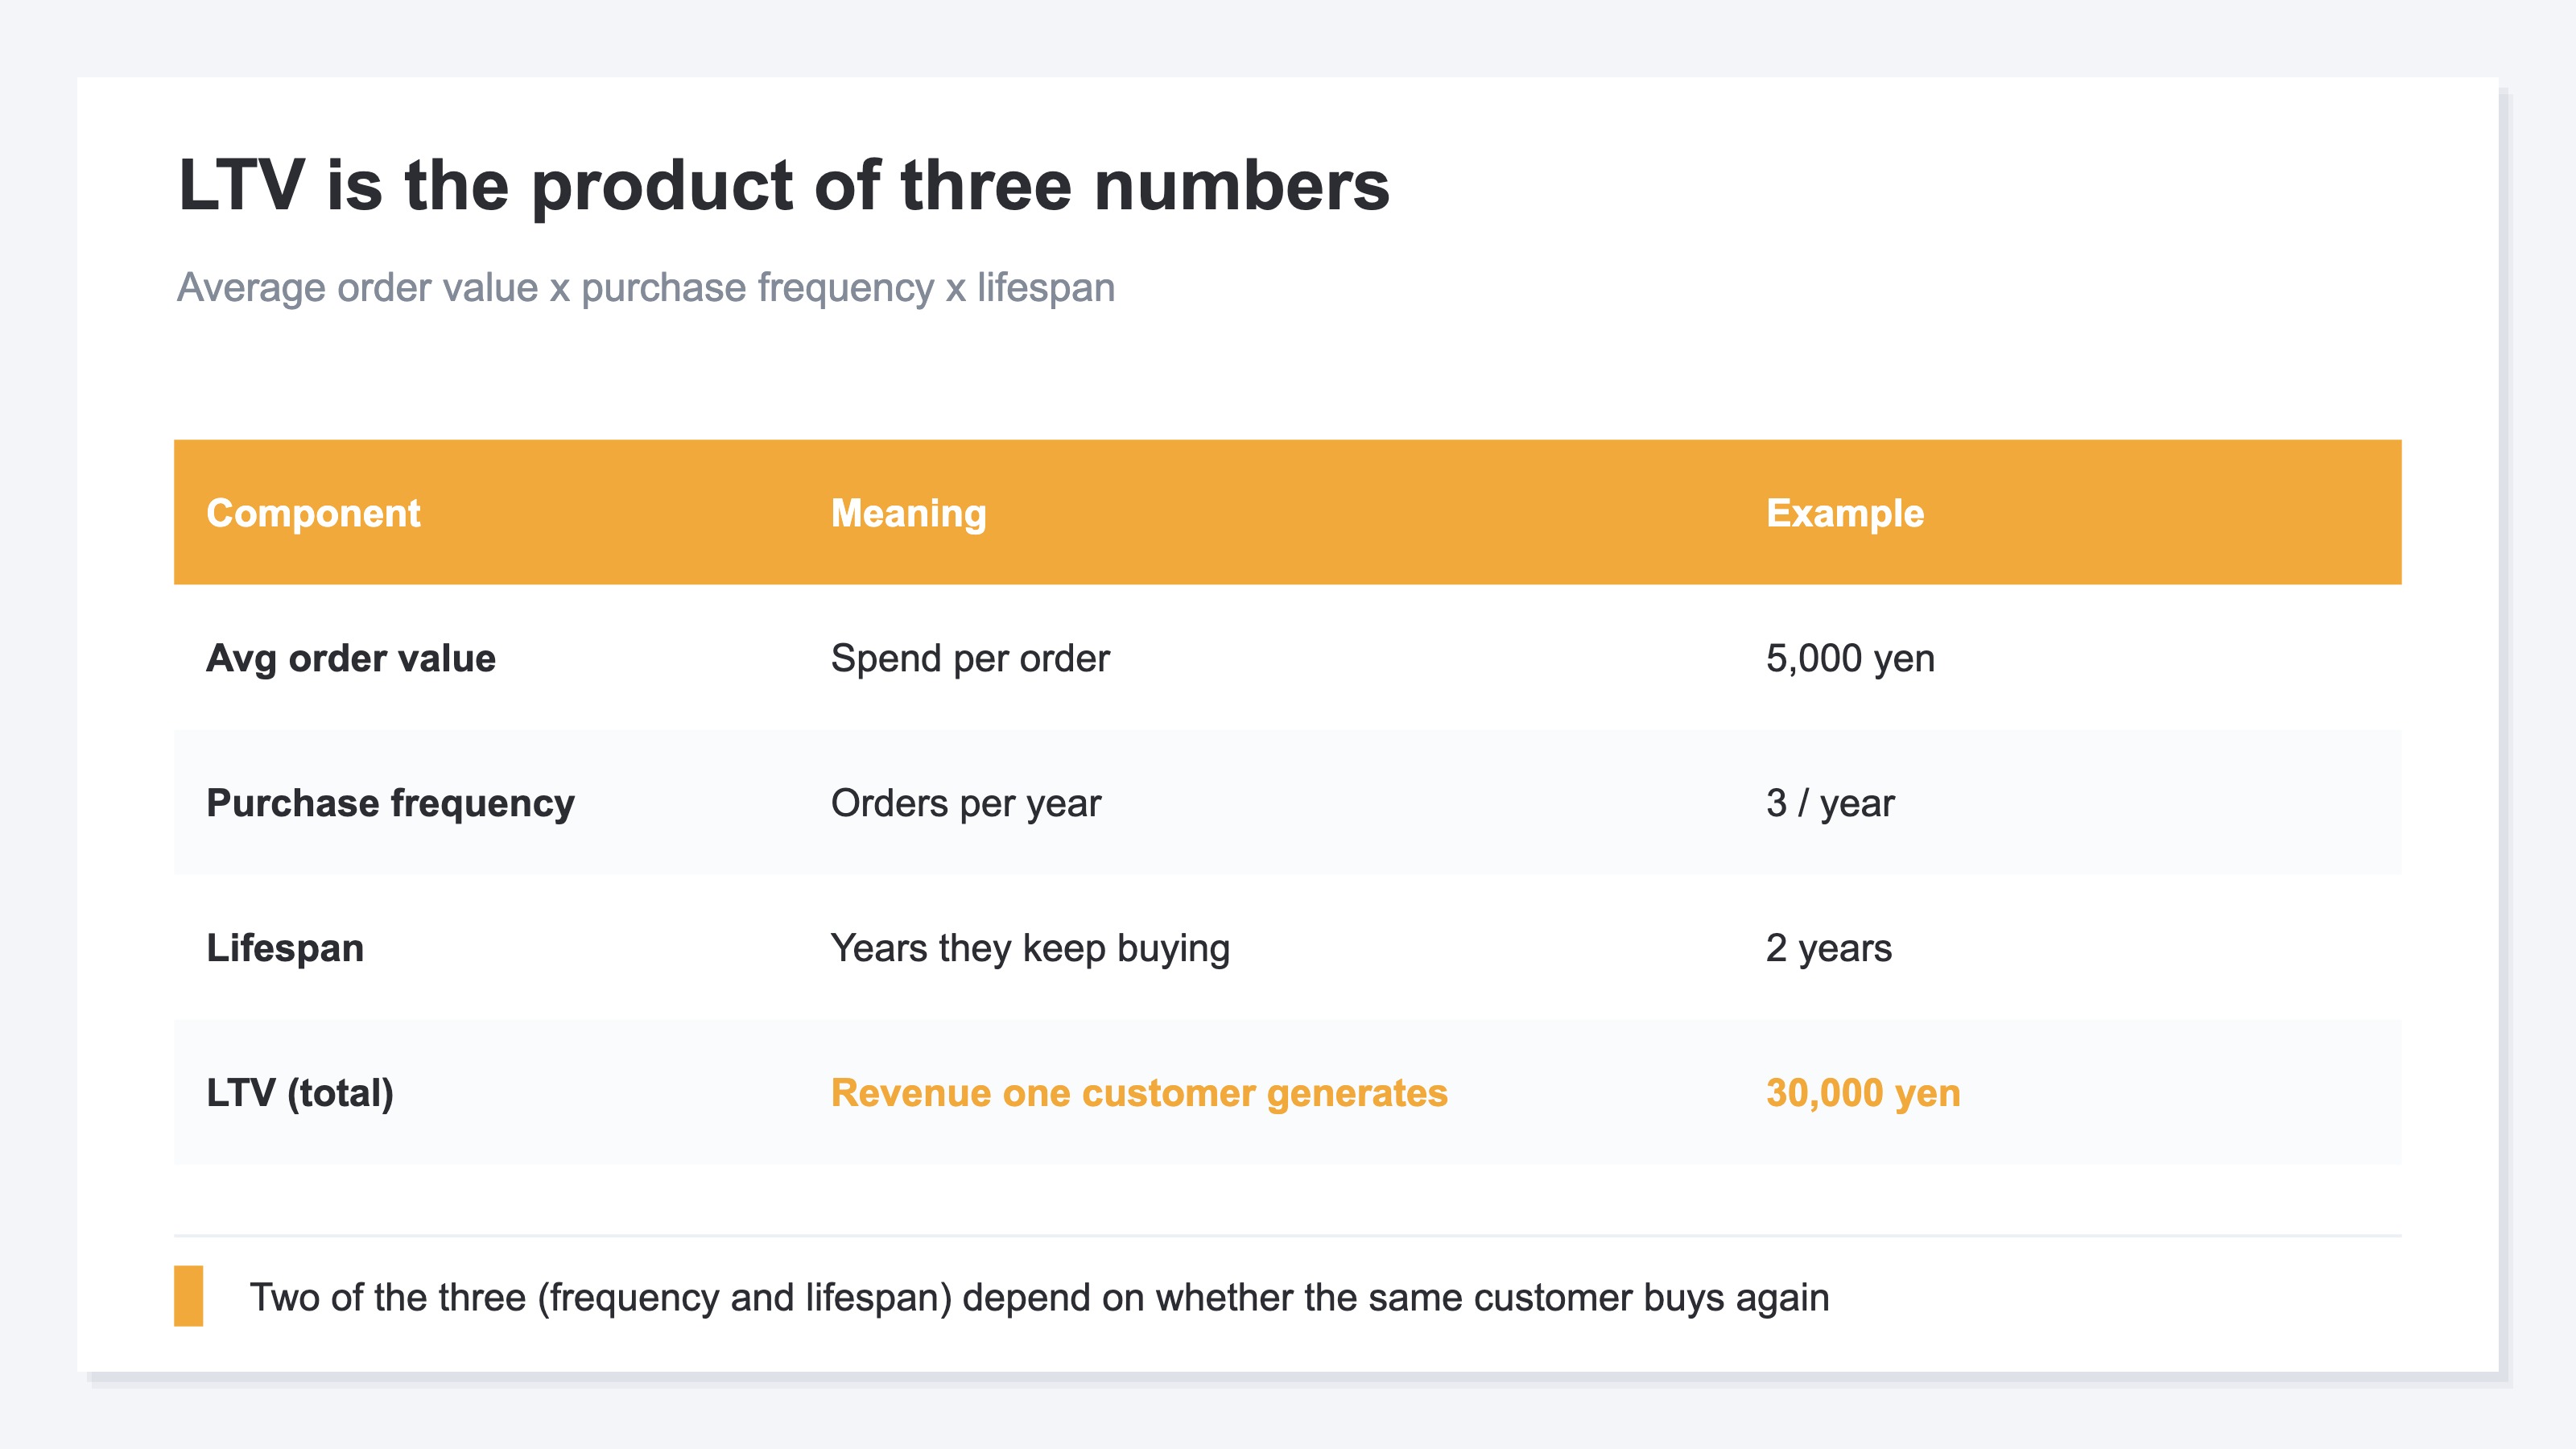
Conclusion: LTV is a product of three numbers—"average order value × purchase frequency × customer lifespan"—and the key is whether the same customer buys again and again.
LTV (Customer Lifetime Value) is "the revenue or profit a single customer generates over the course of their relationship with you." It looks intimidating, but inside it's just a product of three numbers.
| Component | Meaning | Example |
|---|---|---|
| Average order value (AOV) | How much per order | ¥5,000 |
| Purchase frequency | How many times per year | 3 times/year |
| Customer lifespan | How many years they keep buying | 2 years |
In this example, ¥5,000 × 3 times/year × 2 years = ¥30,000. That is this customer's lifetime value.
What's worth noticing is that two of the three (purchase frequency and customer lifespan) are decided by whether the same customer buys again and again. In other words, the key to raising LTV is less about gathering lots of new customers and more about "repeat"—a customer who bought once coming back a second and third time. If your customers are all one-and-done, LTV won't pile up no matter how many new ones you acquire.
Japan's BtoC EC physical-goods market reached JPY 15.2194 trillion in 2024, with an EC penetration rate of 9.78% [4]. As the market matures and customer acquisition cost (CAC) rises, the importance of LTV—"having one customer buy more, for longer"—rises in relative terms.
2. Five LTV calculation methods | start with two#
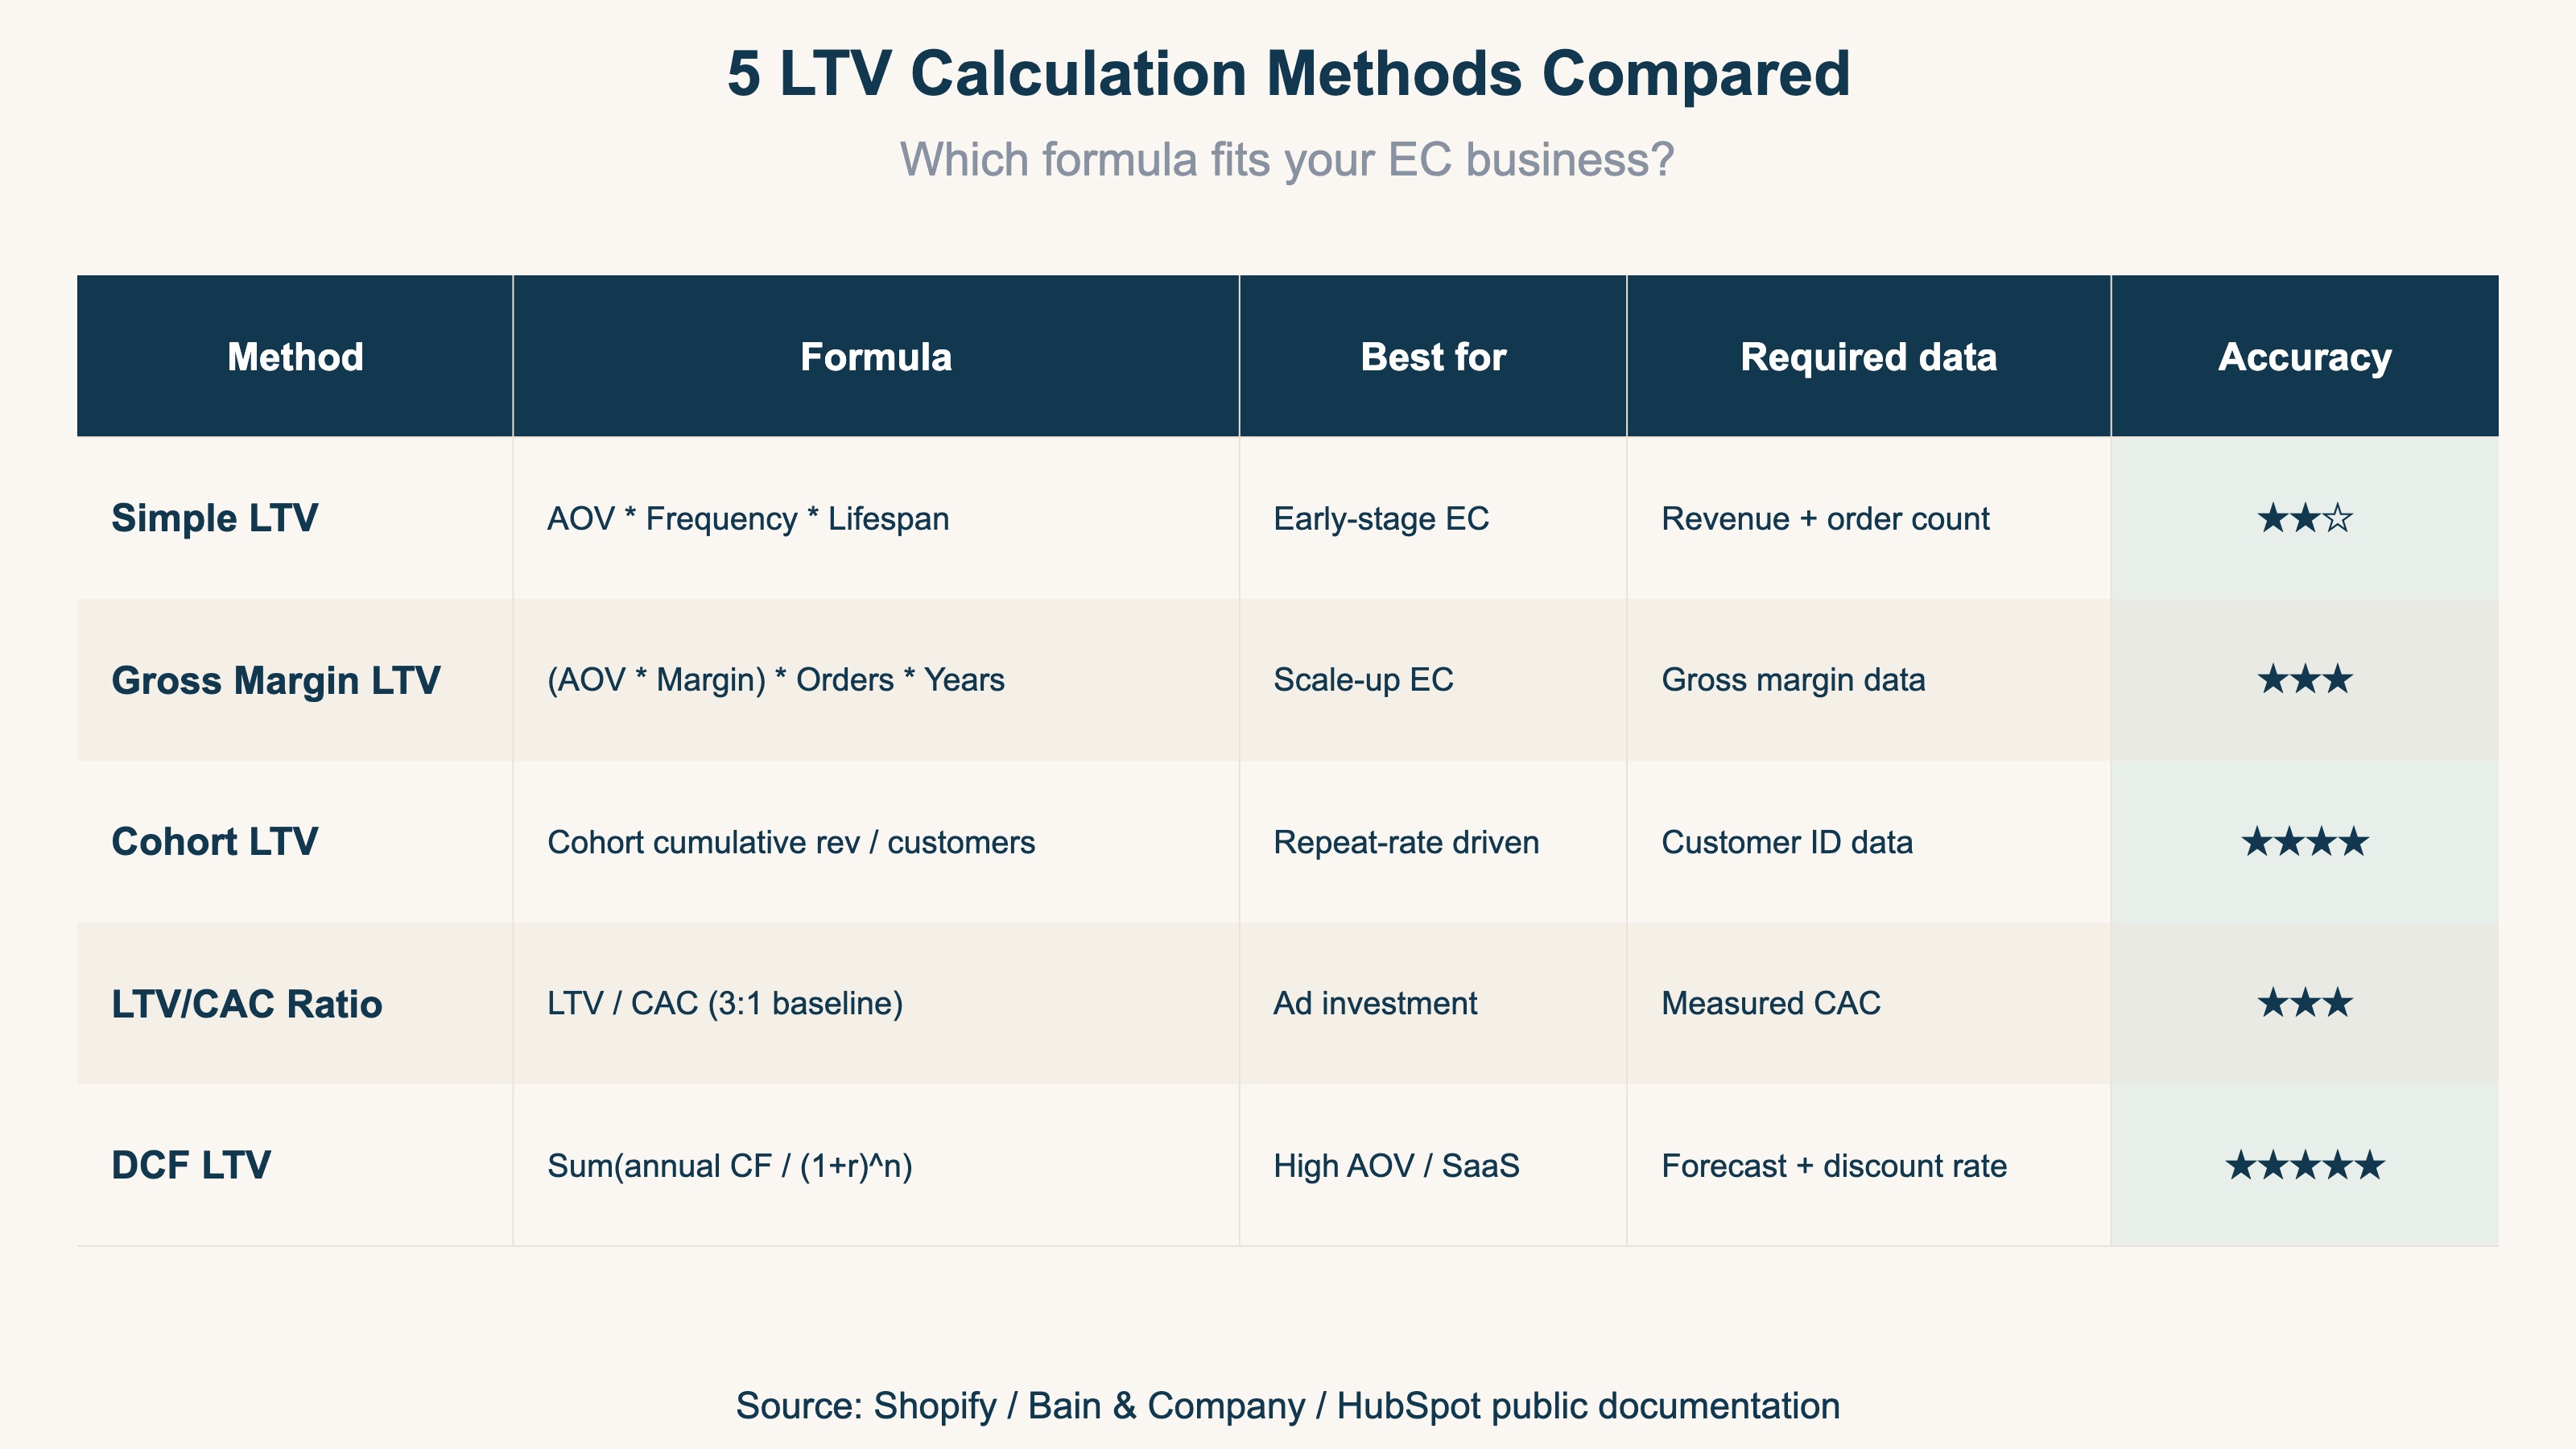
Conclusion: Use Simple LTV in the early stage, switch to Gross Margin LTV once ad spending begins, and leave the other three to dedicated analysts.
There are about five LTV formulas circulating out there, but for an SMB EC owner, two are enough to start.
2.1 Simple LTV | for early-stage EC#
LTV = Average Order Value × Purchase Frequency × Customer Lifespan
Shopify's official baseline formula [1]. With a ¥5,000 average order value, 3 purchases a year, and a 2-year lifespan, LTV is ¥30,000. For the early stage—where gross margin and customer IDs aren't organized yet—this formula is enough.
2.2 Gross Margin LTV | for scale-up EC#
LTV = (Average Order Value × Gross Margin) × Orders × Years
Simple LTV multiplied by gross margin. In the phase where you're investing in ads, if you don't judge on a gross-margin basis you fall into the "LTV looks fine but there's no profit" state. With a 30% gross margin, ¥5,000 average order value, 3 times a year, and 2 years, the gross-margin LTV is ¥9,000. That becomes the benchmark for keeping customer acquisition cost (CAC) below this value as your investment decision.
2.3 Cohort LTV (for analysts)#
LTV = Cohort cumulative revenue ÷ Cohort customers
For each group of customers split by the same condition (a cohort), divide cumulative revenue by the number of customers. It's highly accurate because it's based on observed values, and customer ID linkage is mandatory. Bain & Company has pointed out the impact that improving retention has on profit [2]. This is for dedicated analysts.
2.4 LTV/CAC ratio (ad investment decision)#
LTV/CAC is not a formula for computing LTV but a benchmark for investment decisions. The "LTV/CAC = 3:1" standard widely used in SaaS also applies to EC [3]. Even if the overall average is 3, if, say, ad-acquired sits at 0.8 and organic at 5.0, the right move is to stop ad-based new acquisition. Splitting and looking by channel is the prerequisite.
2.5 DCF-type LTV (for analysts)#
LTV = Σ(Annual Cash Flow / (1 + Discount Rate)^n)
A formula that discounts future cash flows to present value. Used for 3-to-5-year investment decisions in subscription EC or high-AOV products. Because the result swings widely depending on the discount rate (5-10%) assumption, it's for setups with a dedicated CFO or strategy team.
3. The key to raising LTV is repeat | but the number won't say who brought the customer#
Conclusion: The pillar of revenue is repeat customers, but a single number like LTV won't tell you which channel that customer came from.
Break LTV down and you find that almost all the upside lies in "repeat." In fact, for many EC stores, the pillar of annual revenue isn't one-and-done customers but repeat customers who buy two, three, or more times.
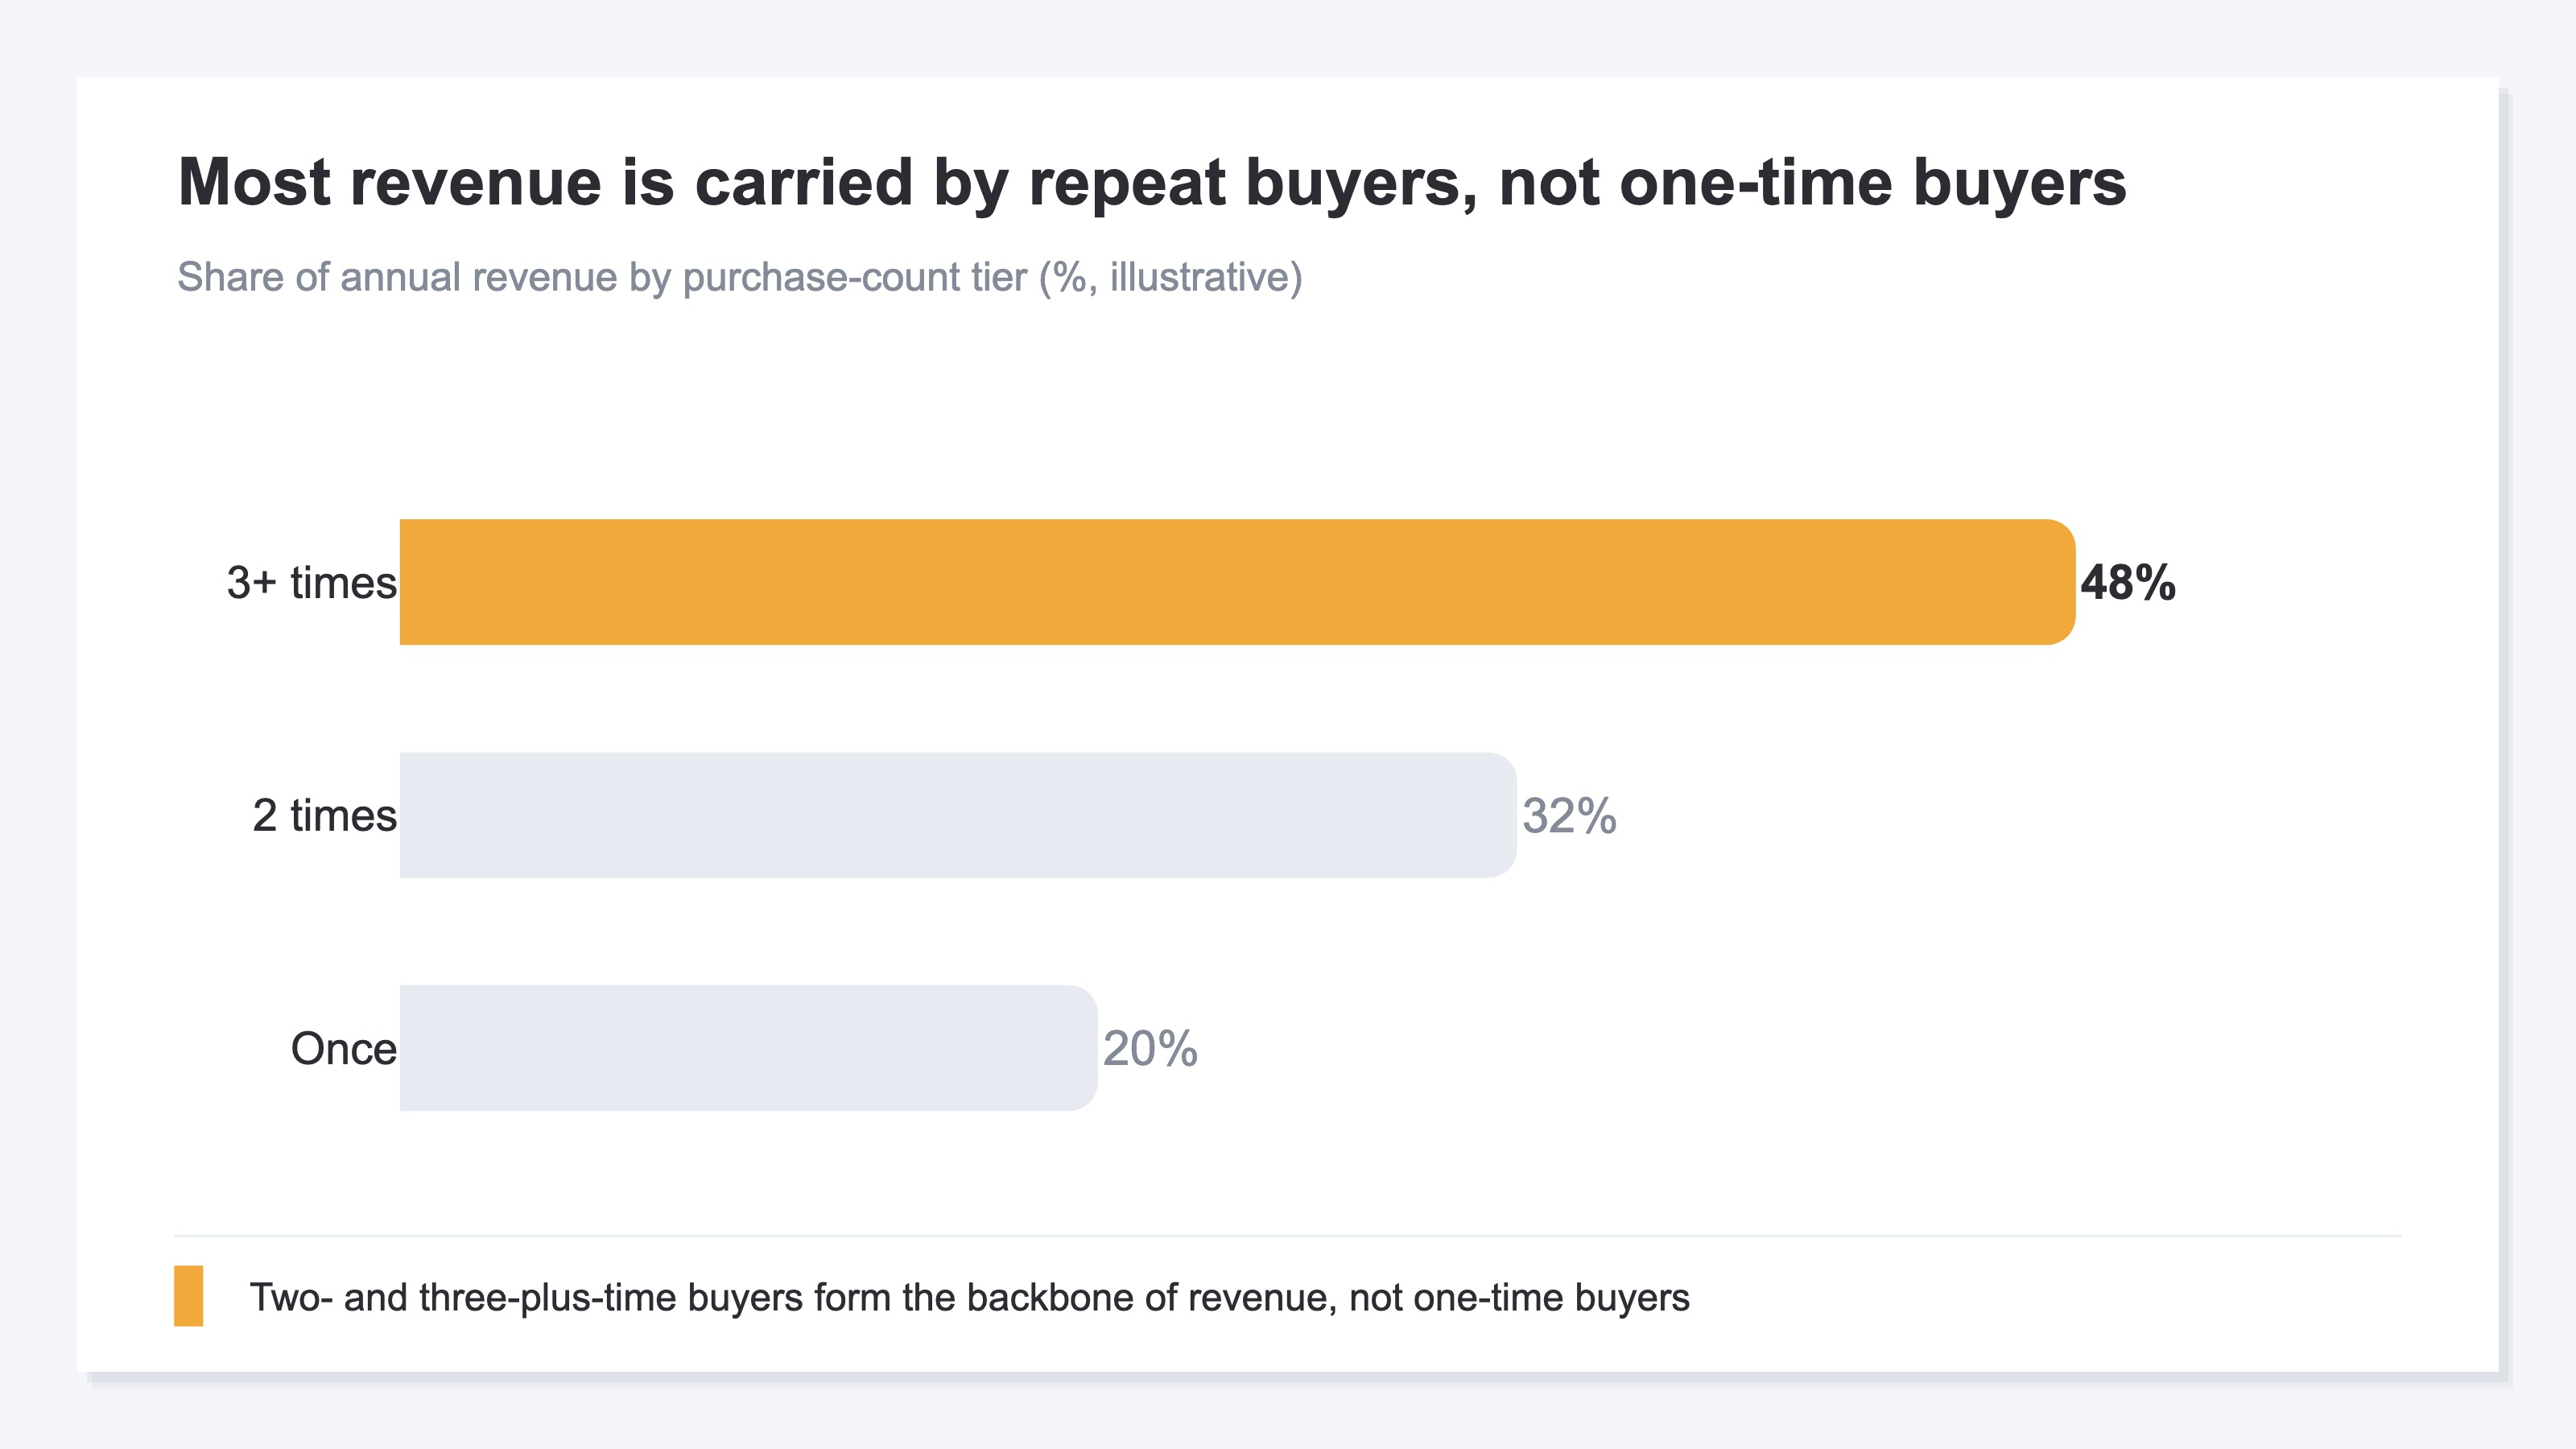
Up to here is something anyone reaches by studying LTV. The problem lies beyond. Even once you understand "repeat matters," the next thing you decide is "so, where do I put my acquisition effort next month?" And right there, the LTV number suddenly stops being useful.
That's because LTV tells you "how much one customer generates," but it doesn't tell you "which channel that high-value customer came in from in the first place." Do customers from email repeat well? Do customers from Meta ads vanish after one purchase? Output a single average LTV and these differences get smoothed flat and disappear. What an acquisition decision needs is not "what's the average LTV" but "where do the high-value customers come from."
4. The wall beyond LTV | the source of high-value customers isn't in the standard reports#
Conclusion: "Which channel brings the high-value customers" and "how revenue per session differs between new and returning visitors" structurally do not show up in GA4's standard reports.
"Fine, I'll just open my web analytics to see which channel the high-value repeat customers come from"—open GA4 with that in mind, and you hit a wall here.
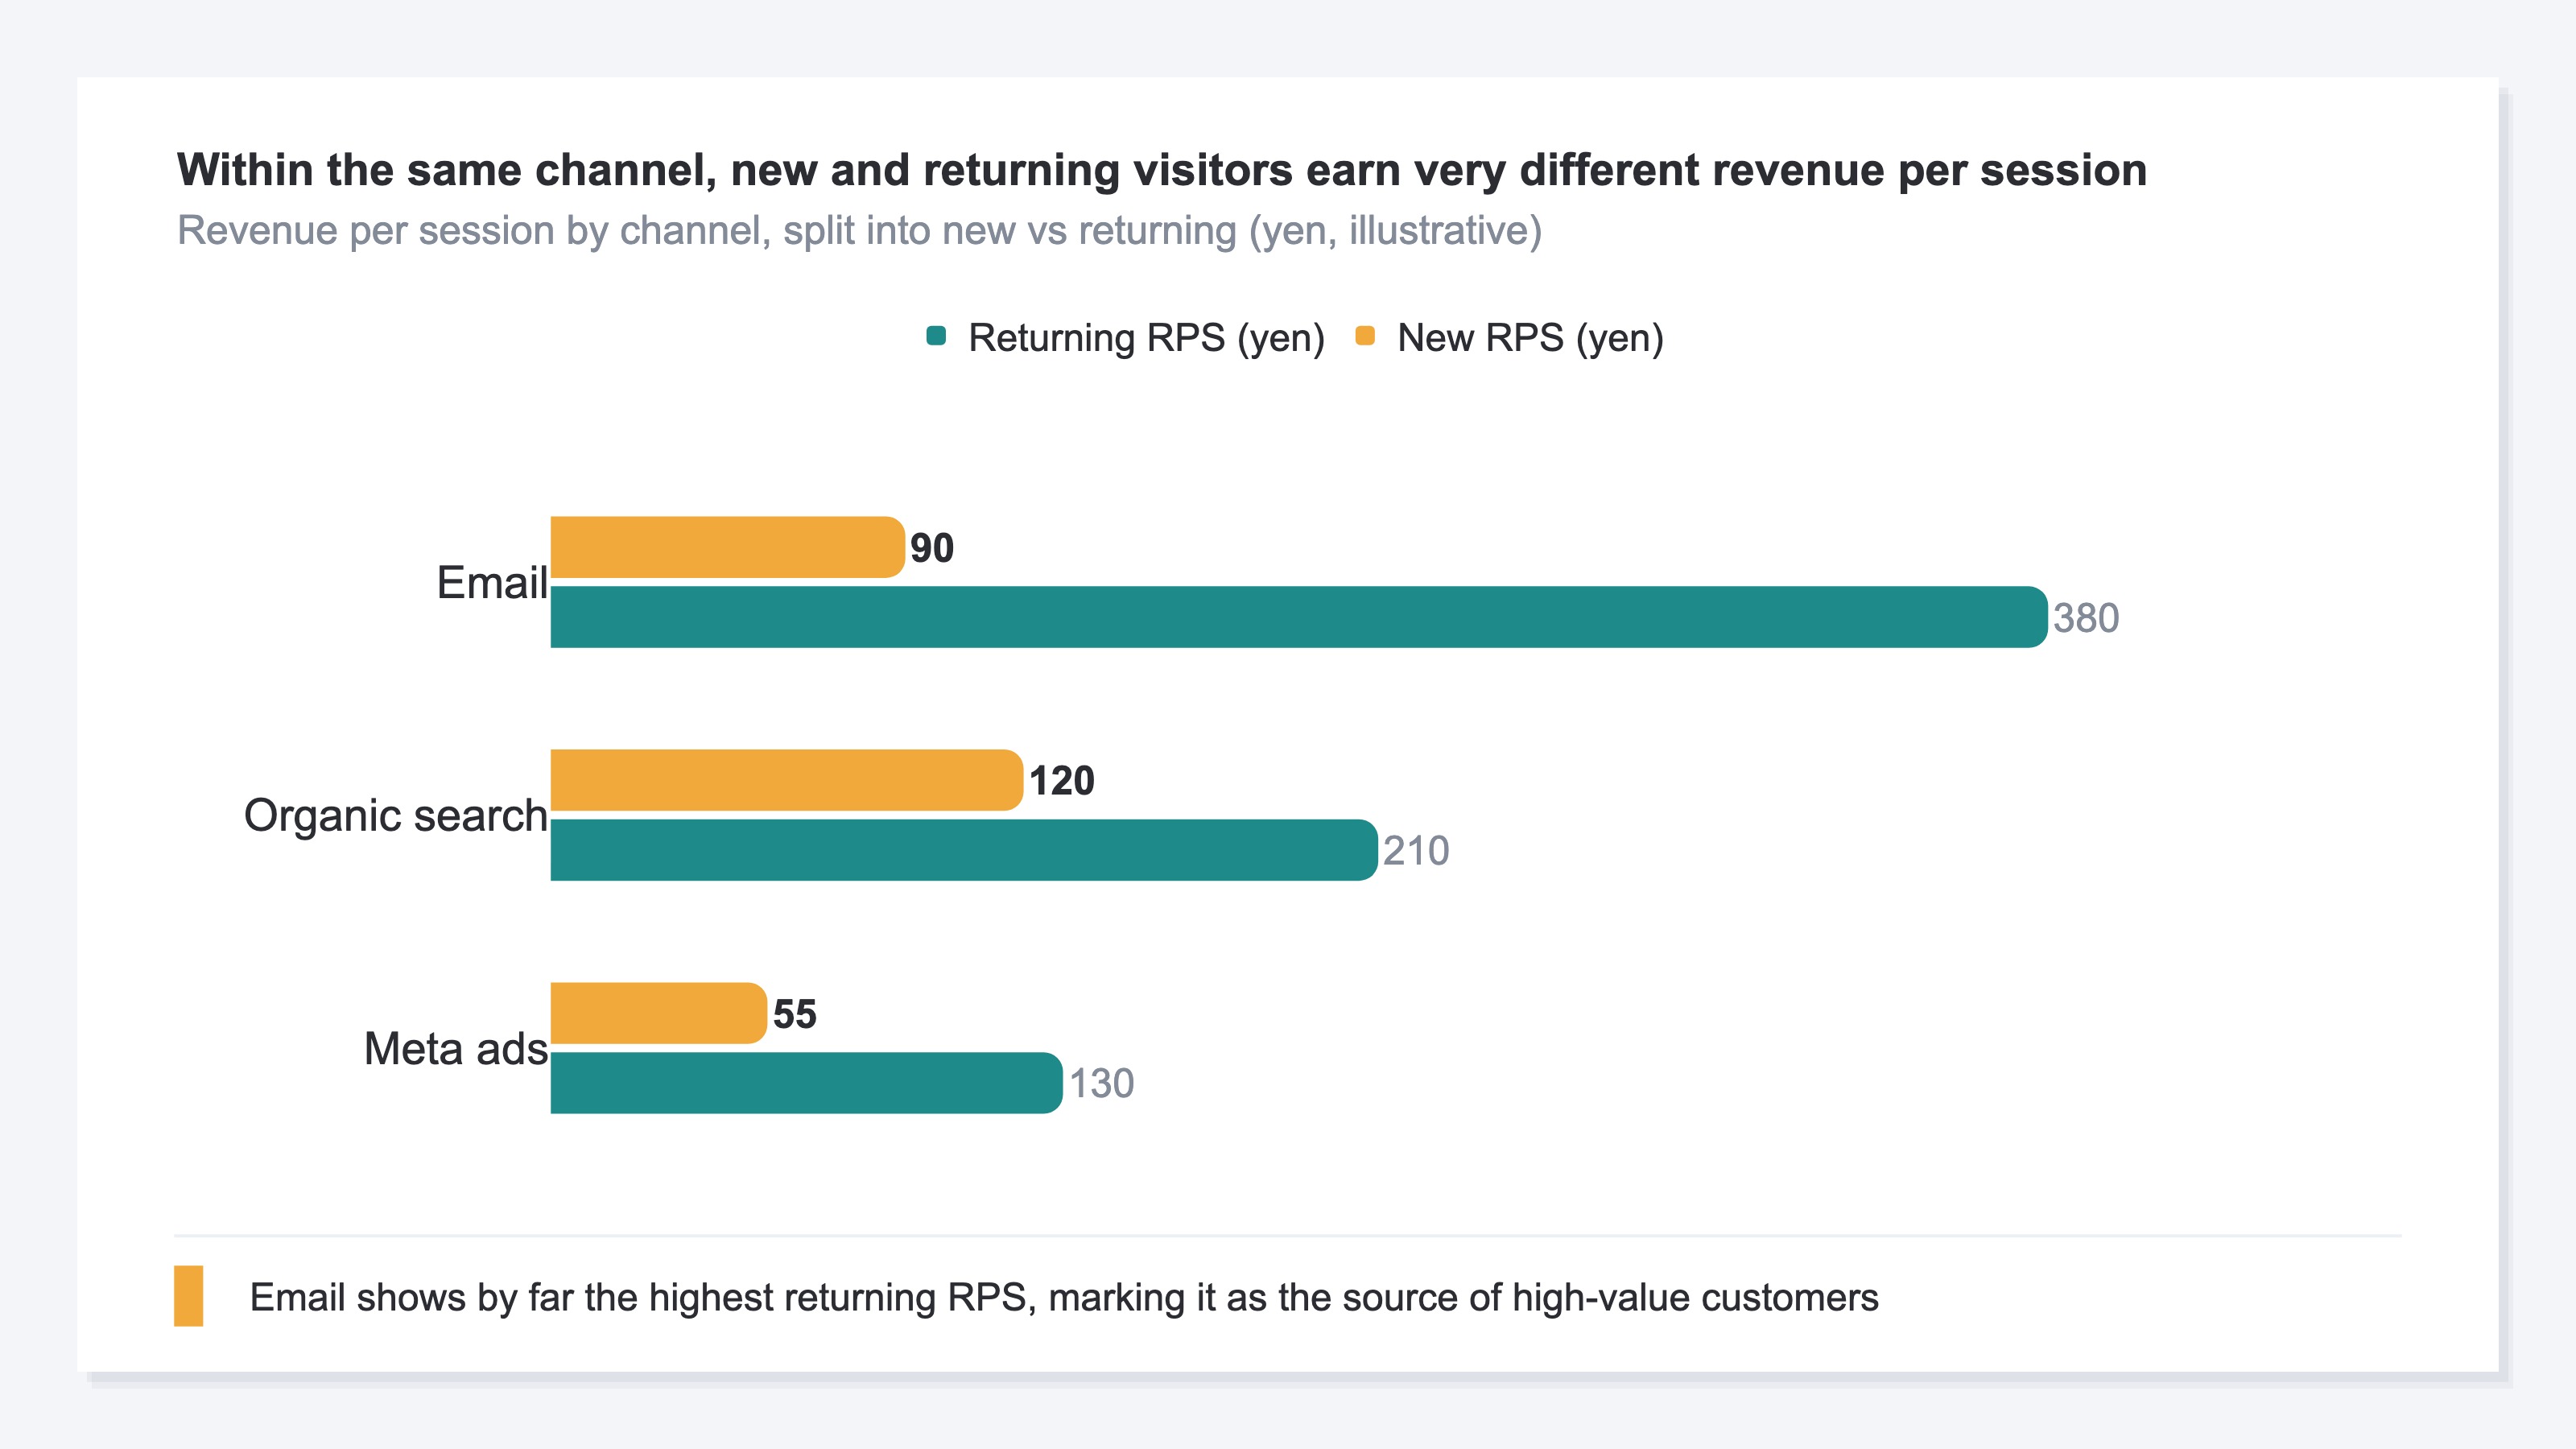
GA4's standard reports do show you sessions and conversions by channel. But they aren't built to show whether that customer is new or returning tied to revenue efficiency by channel. For example, "how much revenue does a returning visitor from email generate per session" or "how much per session for a new visitor from Meta ads"—this revenue per session (RPS, Revenue Per Session) split by channel and by new/returning doesn't come out in that form even if you open the standard reports.
This isn't a settings problem; it's a structural one. There's no report in the standard set that crosses three axes in a single table: the new/returning distinction, the channel, and revenue efficiency per session. So with the standard reports alone, you can't reach "the source of high-value customers"—the very number you most want to know in order to connect LTV to acquisition decisions.
In the end, if you try to do this yourself, you wind up gathering GA4 session and revenue data, repeat determination (customer ID linkage), and channel information from screen after screen every month, then rebuilding it all by hand into a single table. That effort stands in your way before you ever connect LTV to "the next acquisition decision."
RevenueScope — how it helps
Conclusion: RevenueScope lines up new and returning revenue per session by channel on a single screen, showing through revenue where the high-value customers come from. It does not compute LTV itself.
Even once you understand that the key to raising LTV is repeat, the last thing you hit is the same wall: "I want to know which channel the high-value repeat customers come from, but those numbers are scattered across multiple screens and I can't see them unless I re-compile them every month."
RevenueScope consolidates those scattered numbers onto a single screen. It takes the site's revenue and sessions, splits them by channel and into new versus returning, and lines them up as revenue per session (RPS) (figures are demo data).
| Channel | New CVR | Repeat CVR | New RPS | Repeat RPS |
|---|---|---|---|---|
| 1.2% | 4.8% | ¥90 | ¥380 | |
| Search (organic) | 1.8% | 3.2% | ¥120 | ¥210 |
| Ads (Meta) | 1.0% | 2.1% | ¥55 | ¥130 |
Seen on a single screen, what an average LTV hid surfaces at once. Email is weak on new customers, but once they become returning visitors, it earns ¥380 per session—standing out as the highest of all channels. In other words, email is "the source that brings high-value, well-repeating customers." Meta ads, on the other hand, have low RPS for both new and returning. The next move comes into view: "put effort into measures that grow email-sourced customers, and reconsider Meta's weight." It's a decision you could never reach by staring at a single average LTV.
Let's be clear about one thing. RevenueScope does not compute LTV itself. To produce LTV correctly, you need to connect data that lives outside the site—customer purchase history (CRM) and gross margin (accounting)—and that is outside RevenueScope's scope. What RevenueScope does is the step before that: showing, through the site's revenue, "which channel the high-value (well-repeating) customers come from, and at what revenue efficiency." The final LTV calculation, and the decision of how much to invest, are yours to make. Lighting up the source through revenue—that's where RevenueScope's role ends.
FAQ#
Frequently asked questions#
Q. If I compute LTV, can I decide where to acquire customers next month?
A. You can't decide on a single average LTV alone. LTV represents "how much one customer generates," but it won't tell you "which channel that high-value customer came from." For an acquisition decision, you need to split revenue per session (RPS) by channel and by new/returning, and identify the source of your high-value customers.
Q. Can I produce LTV even without customer IDs captured?
A. Simple LTV can be computed on an average-value basis. But accuracy is low, so use it as a reference point for quarterly judgment, not for decisions that require cohort analysis. To look by channel and by new/returning, customer ID linkage for repeat determination is the prerequisite.
Q. Can I see revenue efficiency by channel and by new/returning in GA4?
A. It doesn't come out in that form in GA4's standard reports. You can see sessions and conversions by channel, but there's no standard report that crosses the three axes of "new/returning," "channel," and "revenue per session" in a single table. To see it, you have to gather numbers from multiple screens and rebuild them by hand.
Summary#
- LTV is a product of three numbers: "average order value × purchase frequency × customer lifespan." For SMB EC, the two to remember are Simple LTV and Gross Margin LTV; the other three are for dedicated analysts.
- The key to raising LTV is repeat. The pillar of annual revenue isn't one-and-done customers but repeat customers buying two, three, or more times.
- But a single number like LTV won't tell you which channel that customer came from.
- "Which channel brings the high-value repeat customers" and "how revenue per session differs between new and returning visitors" structurally do not show up in GA4's standard reports.
- To connect LTV to your next acquisition decision, look at the source of high-value customers through revenue efficiency split by channel and by new/returning. First, just once, forget the average LTV and split revenue efficiency by channel into new and returning. The moment you see where the high-value customers come from, how you build next month's acquisition changes.
Related articles#
- What is ROAS: the basics and calculation of return on ad spend
- AOV (average order value) guide — the starting point of LTV
- What is RPS (revenue per session): how to calculate and use it — the metric for seeing the source of high-value customers
- Raising your EC repeat rate: the thinking and the moves
- Revenue dashboard design done right — how to show metrics across different units
References#
- [1] Shopify "Customer Lifetime Value (CLV): What It Is and How to Calculate" (2024)
- [2] Bain & Company "Prescription for Cutting Costs: Loyalty-Based Management" (2001)
- [3] HubSpot "Customer Lifetime Value (CLV) - How to Calculate & Improve It" (2024)
- [4] METI "FY2024 E-commerce Market Survey" (2025)
See which ads actually drive revenue, at a glance
Free up to 5,000 sessions/month, AI analyst included. No credit card required. Up and running in 5 minutes.
Start measuring for free