
"Conversion rate (CVR) is up, visits are up—so why is revenue growing less than I expected?" It's a familiar feeling for ecommerce operators. The thing most often overlooked is Average Order Value (AOV). AOV is a simple metric—"the average revenue per order"—but if you misread its measurement pitfalls and its interaction with CVR and RPS (revenue per session), your improvement efforts can swing in exactly the wrong direction.
This article lays out how to calculate AOV correctly and how to raise it, starting from the revenue decomposition. We present 10 ways to lift AOV alongside their effect ranges, then cover "why you shouldn't chase AOV alone" and a 3-step way to measure your own AOV. Up front: the idea of AOV itself is simple. The hard part is lining up the numbers by channel and by new vs returning every month, and continuing to spot the traffic that is "high in AOV but low in efficiency." We treat it all from a hands-on, operational angle.
Contents
This article in brief#
- AOV is just one of three factors in "Revenue = Visits x CVR x AOV." Chase it alone and it cancels out against movements in CVR or visits, so revenue doesn't grow
- There are 10 ways to improve AOV: cross-sell, upsell, bundles, free-shipping thresholds, memberships, volume discounts, repricing, personalization, cart-abandonment recovery, and post-purchase complementary offers. The ideas are easy, but judging their effect with manual work alone every time doesn't last
- Chase AOV alone and you hit the "raise the free-shipping threshold, AOV up but CVR down" trap. Only when you look at AOV x CVR = RPS (revenue per session) does the "high AOV but low efficiency" traffic become visible
- You can measure your own AOV in 3 steps, but the real work starts there. The heavy part is lining up the numbers by channel and by new vs returning every month and continuing to spot the "high AOV trap"
1. What AOV is and where it sits in the revenue decomposition#
In short, AOV is one of three factors in "Revenue = Visits x CVR x AOV," and optimizing it alone makes it cancel out against CVR and visits.
AOV (Average Order Value) means "the average revenue per order." Strictly, "revenue per customer" and "revenue per order (AOV)" are defined differently, but in practice they're treated as nearly synonymous.
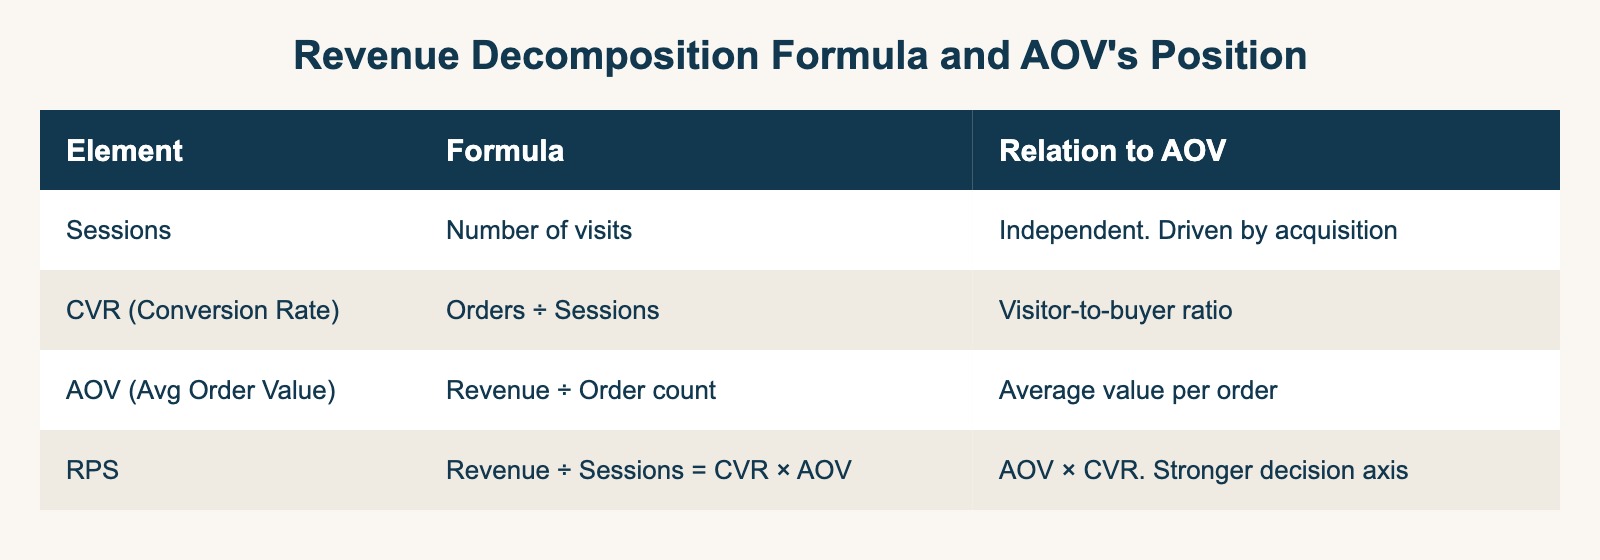
Revenue = Visits (sessions) x Conversion rate (CVR) x Average order value (AOV)
If you don't separate the three factors, you can't notice the cancellation of "we drove more traffic with ads, but AOV dropped." With US 2024 November-December online sales reaching $241.4 B (up 8.7% YoY)[6], the importance of separating the three factors keeps growing year over year.
2. Calculating AOV correctly and four pitfalls#
In short, the formula itself is simple, but the implementation splits across four definitions—discounts, tax, shipping, and returns—and if you don't unify on one internally, the discussion never lines up.
The AOV formula is simple[1][2].
AOV = Total revenue in a period / Number of orders in the same period
With monthly revenue of $100,000 and 2,000 orders, AOV is $50. Shopify officially defines AOV as "net revenue after discounts / number of orders"[1]. That definition is where the pitfalls begin.
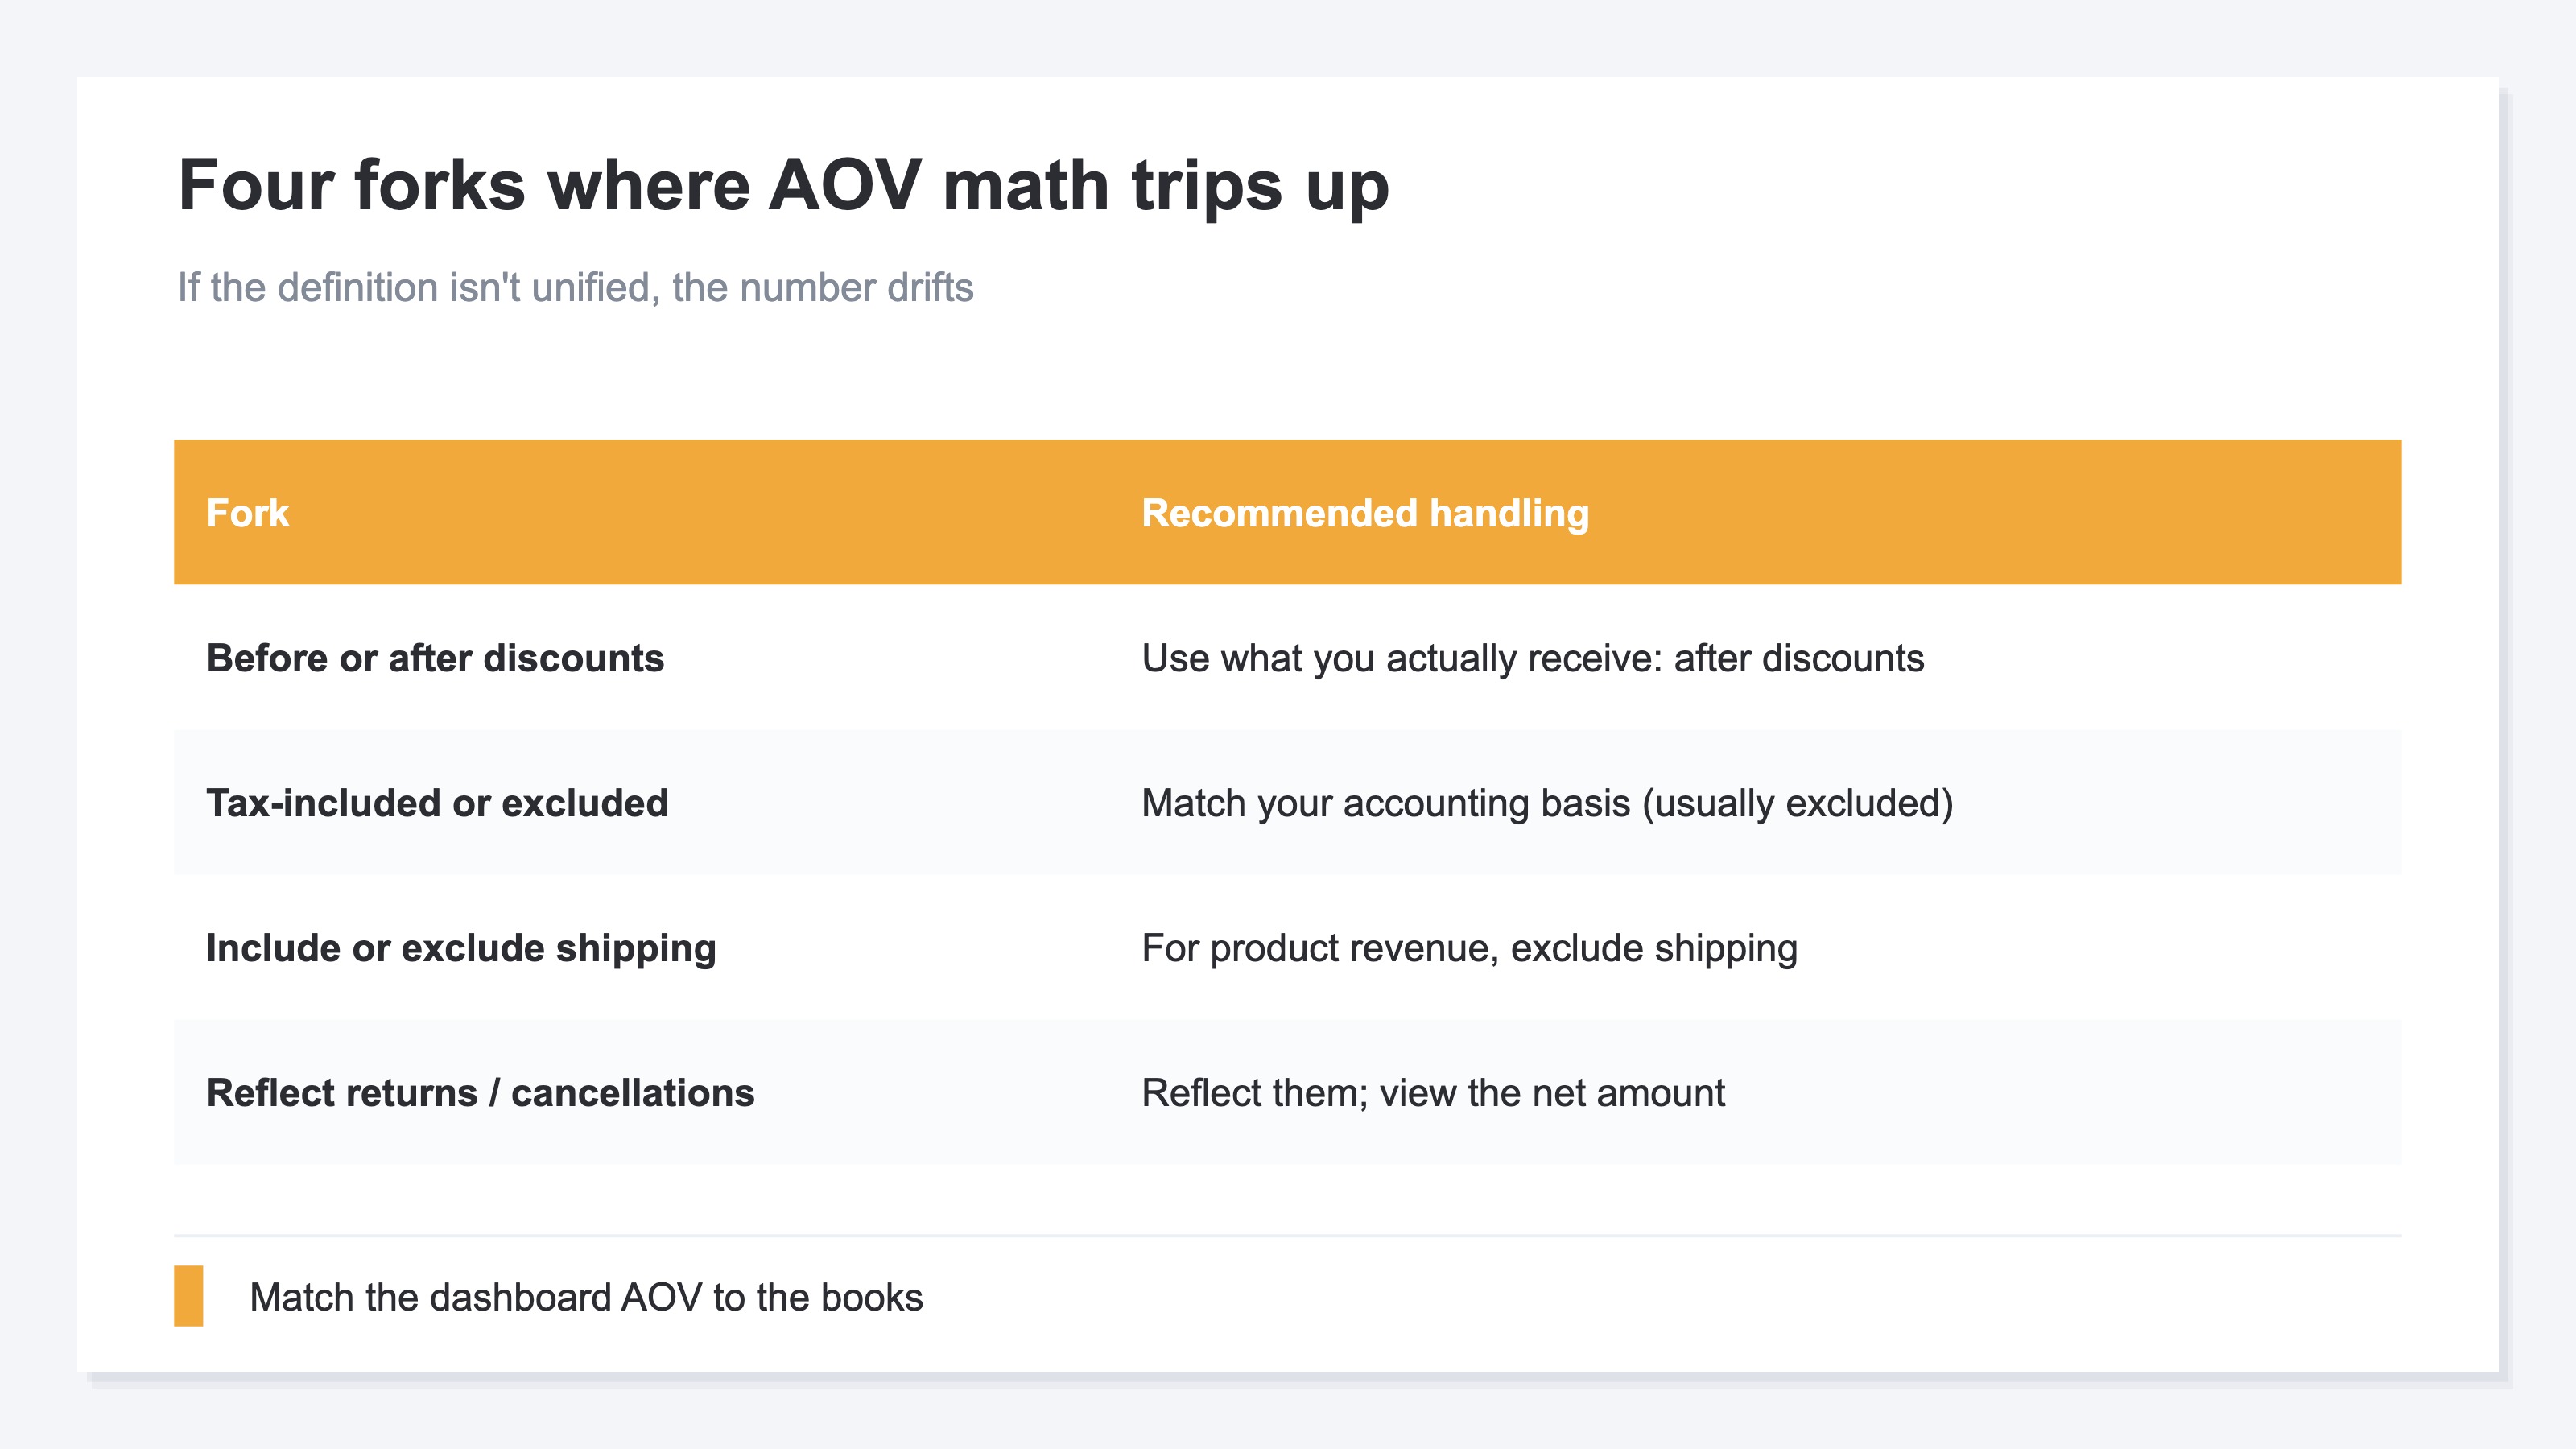
| Pitfall | What happens | Recommended treatment |
|---|---|---|
| (1) Before vs after discounts | AOV is overstated under heavy couponing | Define AOV on net revenue (after discounts) |
| (2) Tax-inclusive vs tax-exclusive | Tax-inclusive and tax-exclusive AOV get mixed internally and the discussion drifts | Unify company-wide on one (tax-exclusive recommended) |
| (3) Shipping included vs excluded | The measured effect of free-shipping-threshold tactics wobbles | Define AOV on product revenue only (treat shipping as a separate metric) |
| (4) Reflecting returns / cancellations | For high-return products it diverges from reality | Recalculate on confirmed revenue after returns / cancellations |
Pitfall (4) deserves special care: for products with return rates above 10%, the dashboard AOV and the monthly-close AOV diverge by 20-30%. The safe approach is to keep both an "at order time" and a "confirmed" AOV. The global average AOV is about $145 per Shopify's published data[1], and you need an operating rhythm that updates a benchmark close to your own industry every year.
3. 10 ways to raise AOV#
In short, the 10 ways split into three types—in-visit uplift, designed incentives, and ongoing-relationship—and realistically you should start with three: free-shipping threshold, cross-sell, and bundles.
Distilled down, the ways to improve AOV organize into 10 categories. We consolidated Shopify's 7 official patterns[1] plus WooCommerce's additions[2] and listed them with effect ranges.
The 10 ways split into three types:
- In-visit uplift (#1 cross-sell / #2 upsell / #3 bundles / #10 post-purchase complementary offers): adding to that order; expected effect AOV +10-40%[4]
- Designed incentives (#4 free-shipping threshold / #6 volume discounts / #7 repricing): moving the price structure; watch for side effects on CVR[3]
- Ongoing-relationship (#5 memberships / #8 personalization / #9 cart-abandonment recovery): LTV +20-40%[5] or revenue +1-2% / profit +1-3%[5]; the effect shows in long-term revenue, not AOV alone
How to read the effect ranges and the first three#
The effect ranges are "around the median." Cross-sell +10-30% can, depending on design, be +0-5% or over +30%. McKinsey frames it as "targeted promotions lift revenue +1-2% / profit +1-3%, with recommendation accuracy creating a +5-25% spread between companies"[5].
Deploy all 10 at once and the tactics interfere, so you can't tell which one worked. Start with three: free-shipping threshold (#4) / cross-sell (#1) / bundles (#3) (low implementation cost, easy to measure).
Choosing the tactics isn't the hard part. The hard part is, after deploying, confirming with numbers every time whether "AOV really went up without lowering CVR." The next section moves on to that pitfall.
4. Why you shouldn't chase AOV alone and its interaction with CVR and RPS#
In short, because cancellations like "AOV up / CVR down" happen with the free-shipping threshold, looking at AOV x CVR = RPS (revenue per session) is the safe basis for judgment.
AOV improvement, seen in isolation, can cancel out against CVR. Raise the free-shipping threshold from $50 to $100 and AOV may rise, but if more customers drop off at the "$20 more for free shipping" point, CVR falls. It's "AOV up x CVR down," and revenue per session (RPS) actually drops.
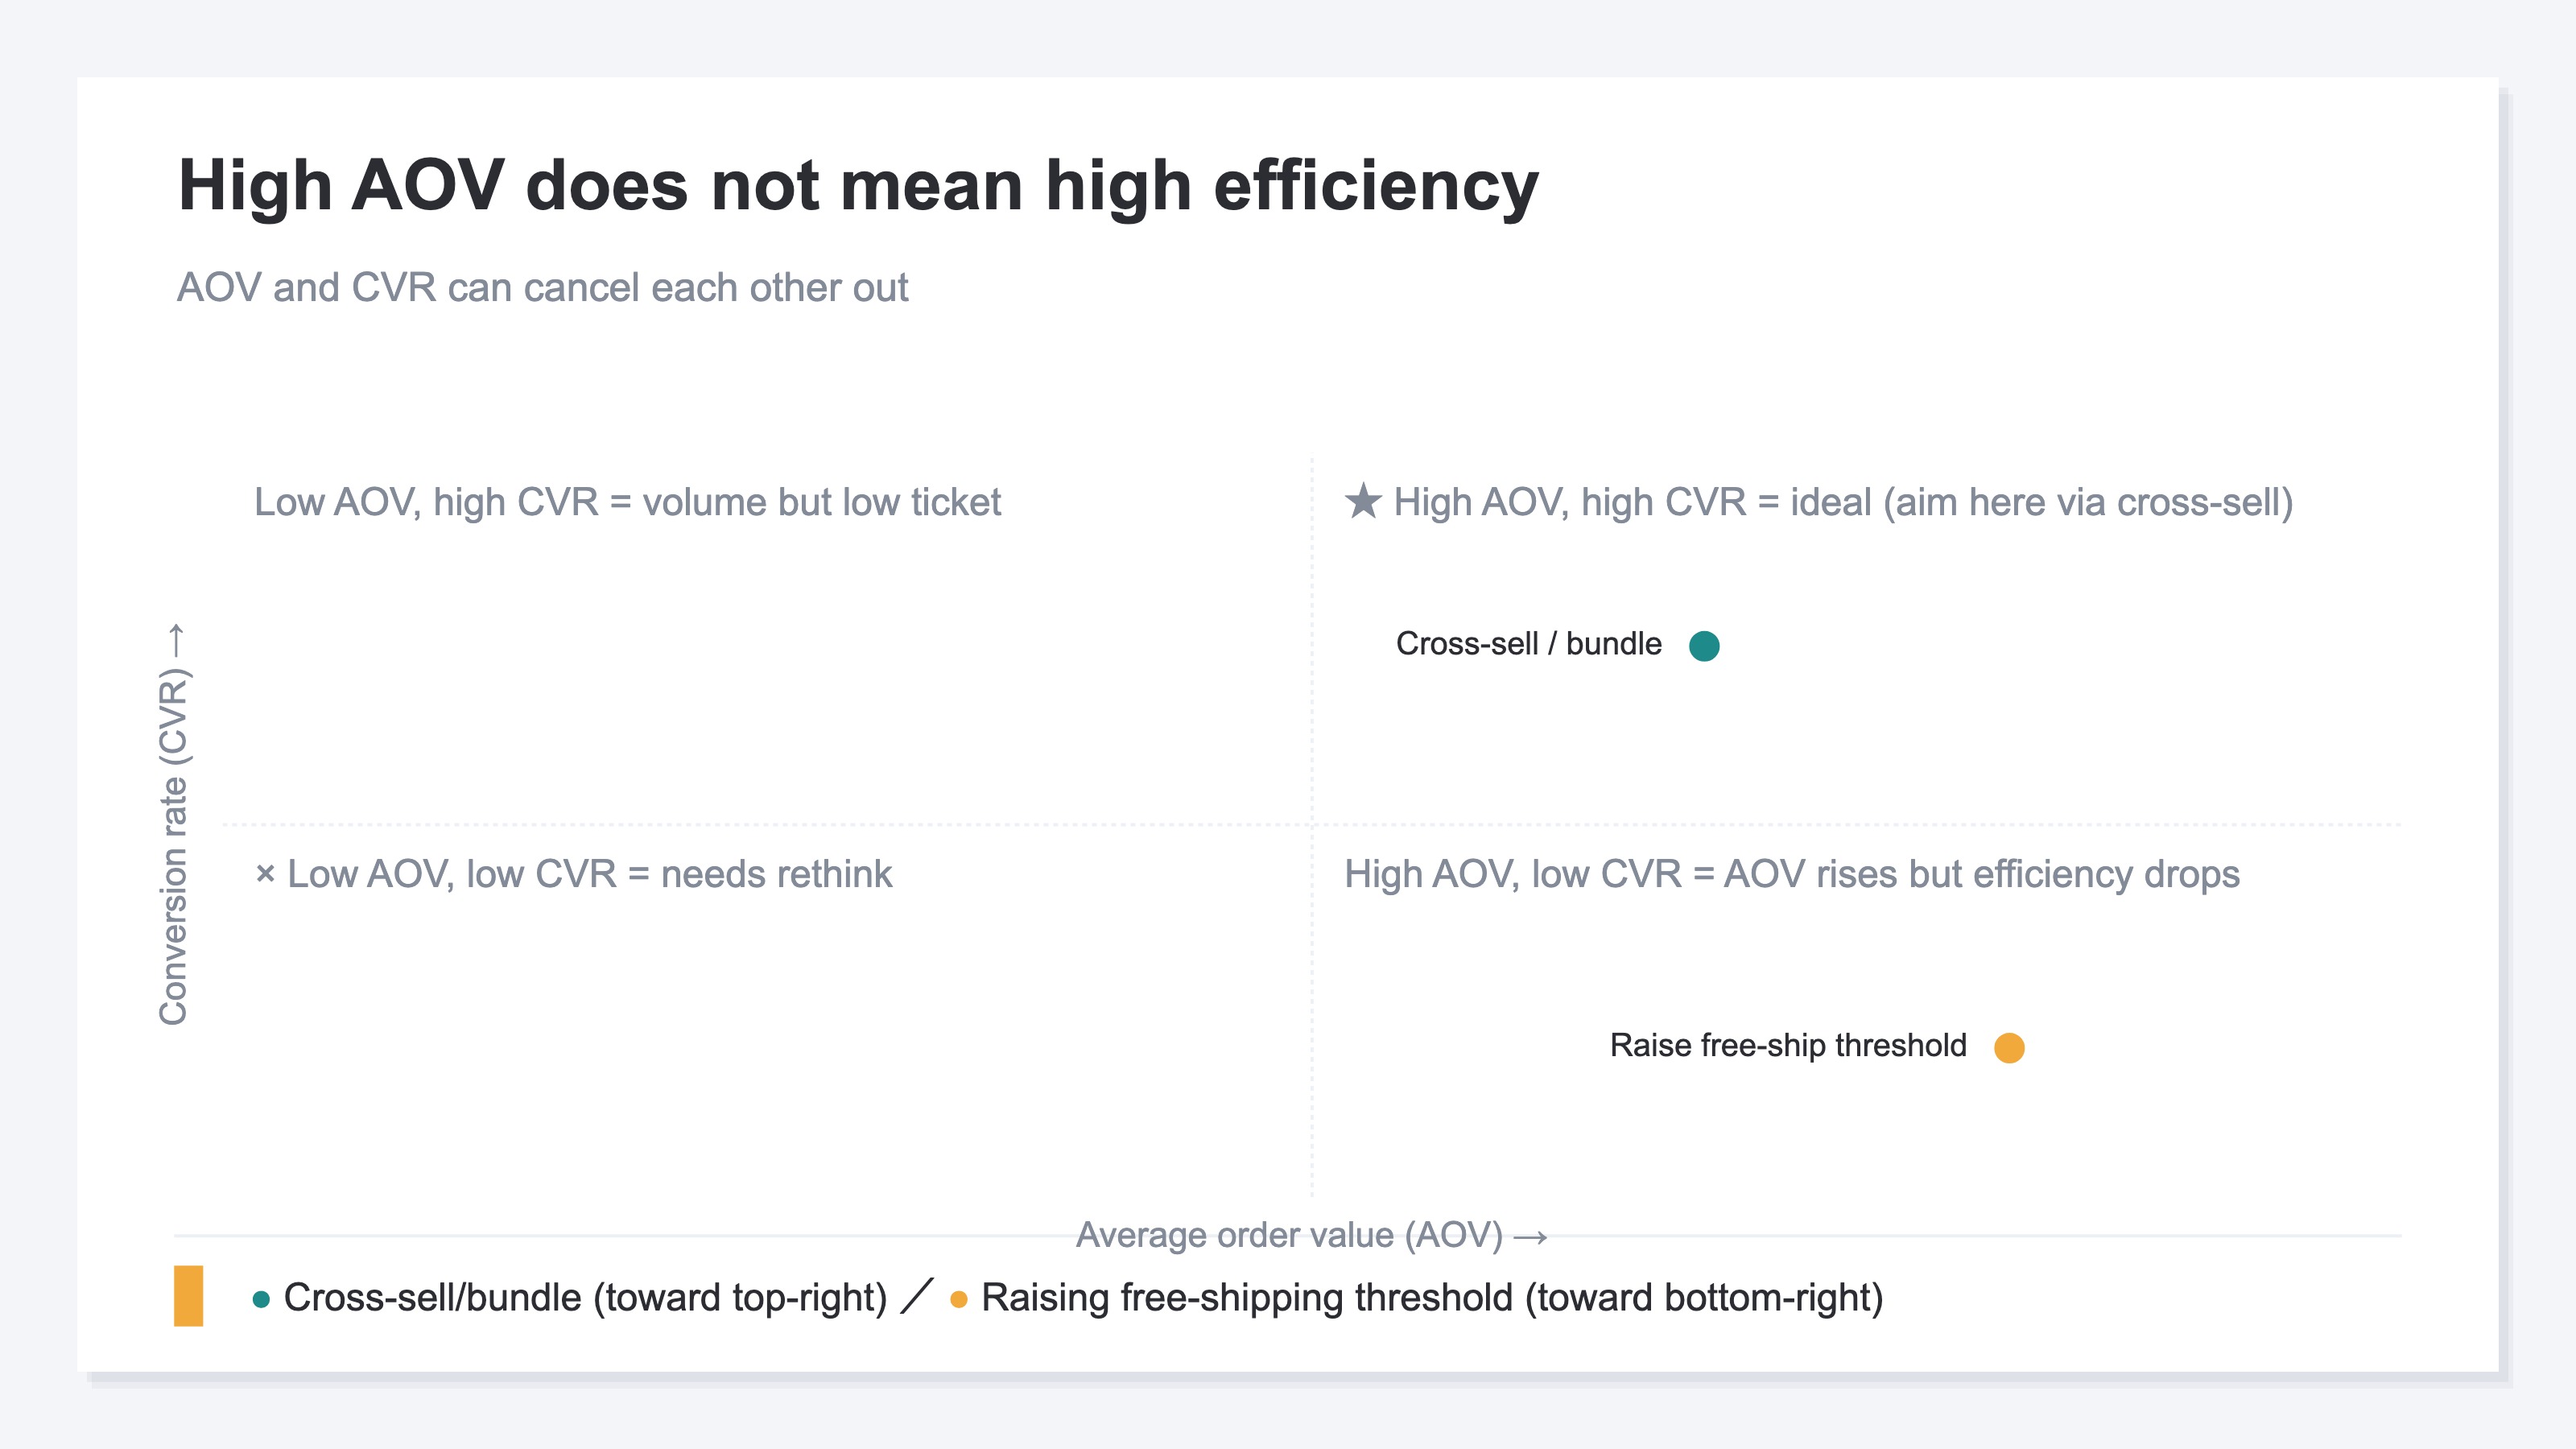
What you want is the top-right (high AOV x high CVR). A tactic that swings to the top-left (high AOV x low CVR) is a net negative for the business even if it looks like an improvement on AOV alone. Raising the free-shipping threshold tends to swing top-left, while cross-sell / bundles move toward the top-right. For a fuller playbook of tactics that push toward that top-right corner — raising CVR and AOV together rather than trading one for the other — see how to raise CVR and AOV together. The strong basis for judgment is RPS (Revenue Per Session), expressed as the product of AOV x CVR:
RPS = Revenue / Visits = CVR x AOV
If AOV rose but RPS fell, that tactic failed. When you look at ad-budget allocation through ROAS, decomposing "revenue" gives AOV x CVR x visits. Look at AOV alone and you can't see the true cause of an ROAS shift (whether it's CVR or AOV). That's exactly why you need to line up AOV, CVR, and RPS side by side. The problem is that lining them up by channel and by new vs returning every month quickly becomes unsustainable by hand.
5. Priorities by business phase#
In short, in the acquisition phase start with passive tactics like cross-sell and complementary offers, and save the free-shipping threshold for the growth phase once visits are stable.
The order in which you deploy the 10 tactics changes with business phase and product type.
- Acquisition phase: minimizing friction on the landing page comes first. Setting the free-shipping threshold too high raises the bar for first purchases and lowers CVR, so start with the passive tactics—cross-sell / complementary product offers
- Growth phase: once visits are stable, deploy free-shipping threshold / bundles / upsell; A/B test each tactic and decide adoption on an RPS basis
- Maturity phase: optimize per-customer with memberships / personalization; rushing into individual optimization with a weak data foundation drops CVR through recommendation noise
Priorities also shift slightly by product type. High-price, low-frequency products (furniture, appliances) benefit more from cross-sell / bundles that thicken a single order, while low-price, high-frequency products (consumables, food) benefit more from memberships or subscriptions that build an ongoing relationship. For highly seasonal products, moving the free-shipping threshold during peak season tends to have a large impact on CVR, so always decide adoption on RPS. In every case, the foundation for judgment is "lining up AOV and RPS by channel and by customer segment." What changes by product is the priority of tactics—the metrics you look at don't change.
6. 3 steps to measure your own AOV#
In short, you can measure it in 3 steps—GA4 setup + unifying the four-pitfall definitions + a weighted average by device and channel. But this isn't "do it once and you're done"; it's an operation that only starts paying off once you keep lining it up every month.
The AOV formula is simple, but getting to the point of "producing your own numbers and judging the effect of a tactic" is a different matter. The shortest path for SMB ecommerce is 3 steps.
Step 1: Set up GA4 ecommerce events correctly#
Get to a state where the purchase event fires on every order in GA4. Three checks:
- In GTM, is the
purchasetrigger firing on the "purchase complete page"? - Are the parameters
transaction_id/value/currency/items[]being captured? - In the exploration "Default channel group x purchase," does the 28-day revenue match your order-management system within +/-10%?
Step 2: Unify the four-pitfall definitions internally on one#
Unify the four pitfalls from section 2 (discounts / tax / shipping / returns) internally on one. Shopify's recommendation is after-discount + tax-exclusive + shipping-excluded + returns-reflected. Confirm that your order-management system side and your GA4 side use the same definition.
Step 3: Decompose by device and channel and compute overall AOV with a weighted average#
In GA4 exploration, break down device x channel x AOV over 28 days and produce the overall AOV weighted by order count. With RPS = CVR x AOV, you can also line up the true effect of a tactic.
Once built, these 3 steps let you produce your own AOV. But note: what you get here is "one snapshot." To judge a tactic's effect, you need to re-line-up the numbers every month by channel and by new vs returning. With manual GA4 exploration, definitions drift across months, or the new-vs-returning split gets skipped because it's tedious—and it tends not to last. And these 3 steps only get you to AOV alone; they won't automatically warn you about the "high AOV but low RPS" trap. The part where you keep spotting that every month is the heaviest part.
RevenueScope — the solution
As we've seen, the idea of AOV itself is simple. The hard part is that GA4's defaults have no screen that lines up AOV / CVR / RPS by channel and by new vs returning. Rebuilding that comparison every month in exploration, and continuing to spot the "high AOV but low efficiency" traffic—this is where manual work doesn't last and was the heaviest part.
RevenueScope brings that side-by-side view into one screen from the start. It lists revenue, RPS (revenue per session), AOV (average order value), and CVR (conversion rate) by channel in the same arrangement, and further splits it into new and returning customers—so you can check whether the assumption "high AOV = high efficiency" holds just by reading down the table. Below is an example of what comes back when you ask RevenueScope (figures shown are demo data).
By channel (figures shown are demo data)
| Channel | Revenue | AOV | CVR | RPS (revenue per session) |
|---|---|---|---|---|
| Google Search | ¥625,000 | ¥5,000 | 2.5% | ¥125 |
| Email newsletter | ¥517,500 | ¥4,600 | 7.5% | ¥345 |
| Instagram Ads | ¥288,000 | ¥4,800 | 3.0% | ¥144 |
| Direct | ¥210,000 | ¥4,200 | 5.0% | ¥210 |
In this table, for example, Google Search has the highest AOV of all channels at ¥5,000. Yet its RPS is a low ¥125, so its per-visit earnings are weak. Because its CVR is a low 2.5%, it's the textbook "high AOV but low efficiency" case. Email newsletter, by contrast, has a mid-range AOV of ¥4,600 but an RPS of ¥345, the highest of all channels. Its conversion rate is a high 7.5%, so even with a moderate AOV it earns the most per visit.
If you look only at AOV here and conclude "Google Search is a great channel because it has high AOV," you risk deprioritizing investment in the genuinely efficient email newsletter. Only when you line up RPS too does the "AOV x CVR = RPS" relationship land as a number you can feel.
Furthermore, RevenueScope can produce this view split into new and returning customers (figures shown are demo data).
Google Search, by new vs returning (figures shown are demo data)
| Segment | AOV | CVR | RPS |
|---|---|---|---|
| New | ¥5,400 | 1.8% | ¥97 |
| Returning | ¥4,300 | 4.2% | ¥181 |
Google Search, which looked like "AOV ¥5,000 / RPS ¥125" overall, splits to reveal that new customers have a high AOV but a low CVR of 1.8% and an RPS of ¥97. Returning customers have a lower AOV but a CVR of 4.2% and an RPS of ¥181. You see a structure hidden in the overall average: "high-AOV new visitors are coming, but the efficiency isn't there." Note that these figures from RevenueScope are values after excluding automated-program (bot) traffic, and it also carves out and shows the portion mixed into unknown source (Unattributed).
Let me be clear about one thing. What RevenueScope produces is the revenue / RPS / AOV / CVR by channel and by new vs returning, plus the bot-excluded, unknown-source carve-out. It does not measure LTV, gross margin, or inventory. What RevenueScope hands you is the material for deciding "where to act"—whether to move the free-shipping threshold or to add with cross-sell while keeping CVR intact. Choosing that one move is up to you.
FAQ#
In short, the premise is to decompose AOV by device and by channel, and ideally down to new vs returning, and to switch the priority axis between AOV and LTV depending on business phase.
Q. Should I split AOV by device and by channel?#
A. Split it both ways. Mobile AOV is commonly 20-40% lower than desktop, so chasing overall AOV alone makes AOV look like it's moving when really it's the mobile mix shifting. Branded direct traffic tends to have high AOV, while ad traffic tends to have low AOV (GA4 setup: GA4 ecommerce 30-minute checklist).
Q. Is it okay to look at AOV under last-click attribution?#
A. Be careful. The high-AOV branded direct traffic is often the result of upstream stimulus from Organic Search or social ads, so watch for attribution bias (the last-click trap).
Q. Should I prioritize AOV or LTV?#
A. Use them by business phase. In the acquisition-to-growth phase, AOV and RPS; once you enter maturity, LTV becomes the main axis, and AOV gets repositioned as one component of LTV (details: LTV calculation guide).
Q. Can GA4 exploration alone run the monthly judgment?#
A. It can, but it's hard to sustain. Manually rebuilding the work of lining up AOV / CVR / RPS by channel, device, and new vs returning every month tends to cause definition drift or skipped splits. The AOV formula alone is simple, but the operation of continuing to spot the "high AOV but low RPS" trap every month is the heaviest part.
Conclusion#
- AOV is one of three factors in Revenue = Visits x CVR x AOV. Don't chase it alone
- The formula is basically simple, but the implementation branches across four pitfalls—discounts / tax / shipping / returns
- There are 10 improvement tactics. Realistically, start with free-shipping threshold / cross-sell / bundles
- Looking through AOV x CVR = RPS (revenue per session) makes the "high AOV but low efficiency" traffic visible
- You can measure your own AOV in 3 steps—GA4 + unifying the four pitfalls on one + a device x channel weighted average. But the real work is continuing to line it up every month by channel and by new vs returning to spot the trap
- The idea is simple; the heavy part is continuity. That's exactly why, with a foundation that produces AOV / CVR / RPS by channel and by segment on one screen, judgment starts to flow
See which ads actually drive revenue, at a glance
Free up to 5,000 sessions/month, AI analyst included. No credit card required. Up and running in 5 minutes.
References#
- [1] Shopify "Average Order Value (AOV): Formula, Benchmarks and 7 Ways to Increase It" (2025)
- [2] WooCommerce "Increase average order value: actionable tips for ecommerce" (2024)
- [3] Baymard Institute "E-Commerce Cart & Checkout Usability Research" (2024)
- [4] BigCommerce "Ecommerce Growth with Upselling and Cross Selling Tactics" (2024)
- [5] McKinsey & Company "Unlocking the next frontier of personalized marketing" (2025)
- [6] Adobe "Holiday Shopping Season Drove a Record $241.4 Billion Online and Rising 8.7% YoY" (2025)
- [7] Ministry of Economy, Trade and Industry (Japan) "FY2024 Survey on Electronic Commerce Market" (2025)


