
"Google Ads vs. Meta Ads — which is more efficient on the same budget?" Ecommerce operators ask this almost every week. Most compare by sessions, but that leads to the wrong answer. The only metric that compares revenue efficiency across ad channels is RPS (Revenue Per Session).
This article covers the ecommerce and marketing RPS — the formula, GA4 implementation, the relationship to AOV (Average Order Value) and CVR (Conversion Rate), and the operational pitfalls — from a practitioner's view.
Table of Contents
TL;DR#
-
RPS = Revenue ÷ Sessions
The single metric that integrates AOV and CVR into one ad-investment decision axis
-
Looking at AOV alone or CVR alone misjudges initiatives
When raising the free-shipping threshold creates "AOV ↑ / CVR ↓," AOV alone reads as a win, but RPS goes down
-
Channel-level RPS judges ad ROI
Google Ads RPS $1.20 vs. Meta Ads RPS $0.80 means Google is 1.5× more efficient on the same budget
1. Definition and formula#
RPS represents the average revenue per visit (session).
RPS = Revenue ÷ Sessions
10,000 sessions with $12,000 in revenue → RPS = $1.20. "On average, each site visit earns $1.20."
Relationship with AOV and CVR#
RPS decomposes as the product of AOV and CVR:
RPS = AOV × CVR
For example, AOV $60 × CVR 2.0% = $1.20. This decomposition means there are only two ways to move RPS — raise AOV or raise CVR. If sessions grow but neither AOV nor CVR changes, RPS stays exactly the same — session-only growth is RPS-neutral. For how this formula translates into real budget decisions, see three case studies of RPS-driven channel optimization.
Naming variations#
RPS goes by several names — Revenue Per Visit (RPV), Average Revenue Per Session (ARPS), Revenue Per User (RPU). The GA4 reference defines "Average purchase revenue per user" — close but per user, not per session[1]. The substance is the same — revenue divided by visits. This article uses the most operationally tractable unit (session) and calls it RPS.
"RPS" in other fields#
The abbreviation "RPS" also carries different meanings outside ecommerce and marketing. For readers who landed here from search, the most common ones are:
| Field | Full name | Meaning |
|---|---|---|
| Renewable energy | Renewable Portfolio Standard | A policy requiring utilities to source a set share of power from renewables |
| IT infrastructure | Requests Per Second | The number of requests a server handles per second |
| Mechanics / physics | rps (rotations per second) | The number of rotations a spinning body makes per second |
This article deals with the ecommerce and marketing RPS (Revenue Per Session). Whenever RPS appears below, it means exactly that.
2. The trap of single-metric thinking — three misconceptions#
The reason RPS is needed is that maximizing any single metric sacrifices another.
Misconception 1: "Increase sessions and revenue will follow"#
Doubling ad spend doubles sessions, but if RPS halves, revenue is flat. Adding a new ad channel often brings traffic of different quality, dropping CVR and RPS. Revenue = Sessions × RPS — sessions alone tell you nothing about revenue impact.
Misconception 2: "CVR is the top KPI"#
CVR matters, but alone it misleads. Pushing bundles to lift CVR can drag AOV down. CVR ↑ × AOV ↓ ends up dropping RPS. Baymard Institute's checkout usability research[2] documents many ways to lift CVR — but failing to keep CVR balanced with AOV and margin leads to whole-business misoptimization. For when to judge by CVR and when by RPS, see RPS vs. CVR.
Misconception 3: "Just raise AOV"#
Raising the free-shipping threshold from $50 to $100 might lift AOV, but customers who were "$20 short of free shipping" will drop off, lowering CVR. AOV ↑ × CVR ↓, and RPS goes down. For how AOV and RPS divide the job, see RPS vs. AOV.
The three-metric interaction — RPS as the integrated axis#
| Metric | How to move it | Likely side effect | Integrated axis |
|---|---|---|---|
| Sessions | Paid ads / SEO | RPS drops if traffic quality differs | RPS |
| CVR | UX / discounts | AOV drops with discounting | RPS |
| AOV | Thresholds / bundles | CVR drops past thresholds | RPS |
Revenue moves only when all three metrics align. RPS folds these interactions into one number.
3. How to compute RPS — GA4 / Shopify / in-house DB#
In GA4#
GA4's standard reports don't expose "Revenue Per Session." "Average purchase revenue per user" exists, but it's per user, not per session[1]. For session-level RPS, you need a custom calculation in Explorations:
RPS = Total revenue (purchase) ÷ Sessions (all sessions, not just purchasing)
GA4 standard reports make it hard to surface "purchasing sessions" and "all sessions" simultaneously, so a custom Exploration query is typically required.
In Shopify#
Shopify Analytics shows "Total sales," "Conversion rate," and "AOV" by default — but no native RPS. You compute it yourself: "Total sales ÷ Total sessions."
In an in-house DB (most flexible)#
Join sales data with session logs in a data warehouse (Postgres / BigQuery / Snowflake) — one SQL query produces channel-level RPS:
SELECT
  channel,
  SUM(revenue) / COUNT(DISTINCT session_id) AS rps
FROM
  sessions s
LEFT JOIN
  orders o ON s.session_id = o.session_id
GROUP BY
  channel
The real value of RPS comes from channel comparison — this granularity is the key to data-driven ad budget allocation. But RPS computed this way is still raw: bot traffic, duplicate sessions, and inconsistent attribution all ride along. To use it for ad decisions, that pre-processing has to be handled separately (see §5 and the solution below).
4. Three real examples — RPS changes the verdict#
Example 1: Raising the free-shipping threshold (the AOV-only trap)#
A D2C brand raised the threshold from $50 to $80:
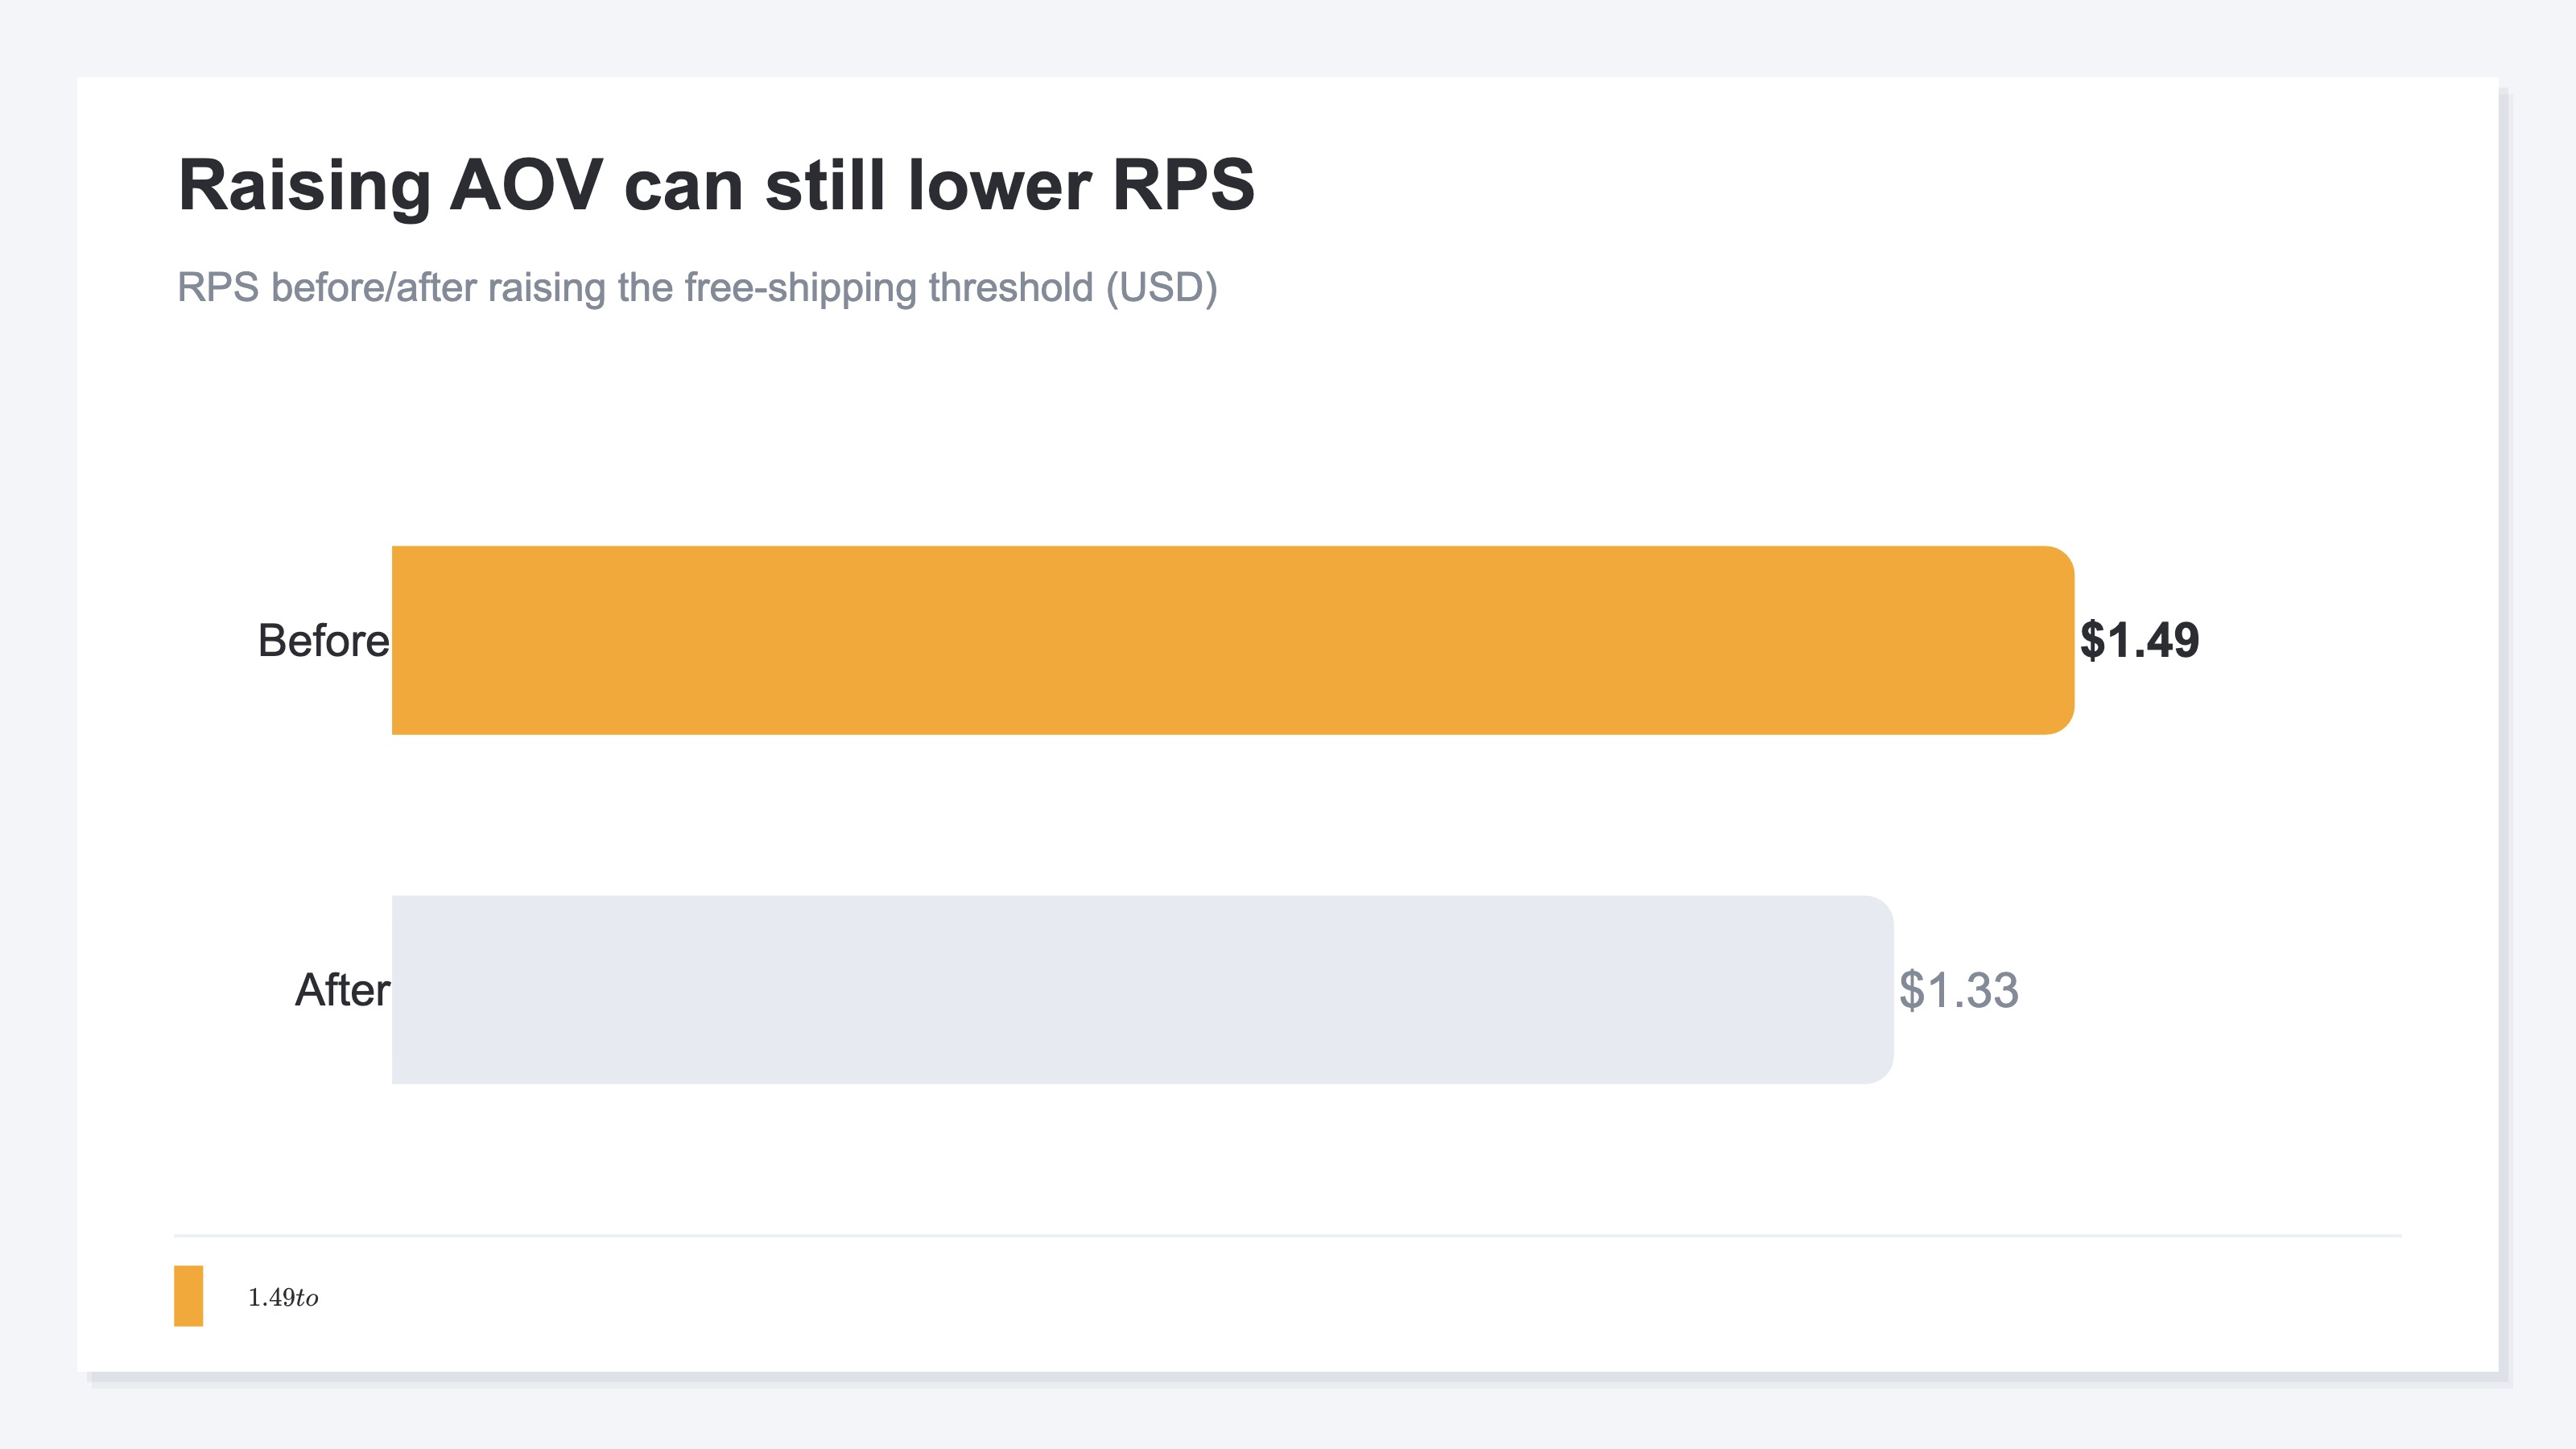
| Metric | Before | After | Change |
|---|---|---|---|
| AOV | $62 | $74 | +19% |
| CVR | 2.4% | 1.8% | -25% |
| RPS | $1.49 | $1.33 | -11% |
AOV alone says "+19%, big win." RPS shows -11% — the initiative loses revenue overall.
Example 2: Channel-level comparison (ad budget allocation)#
Same $10,000 budget across three channels:
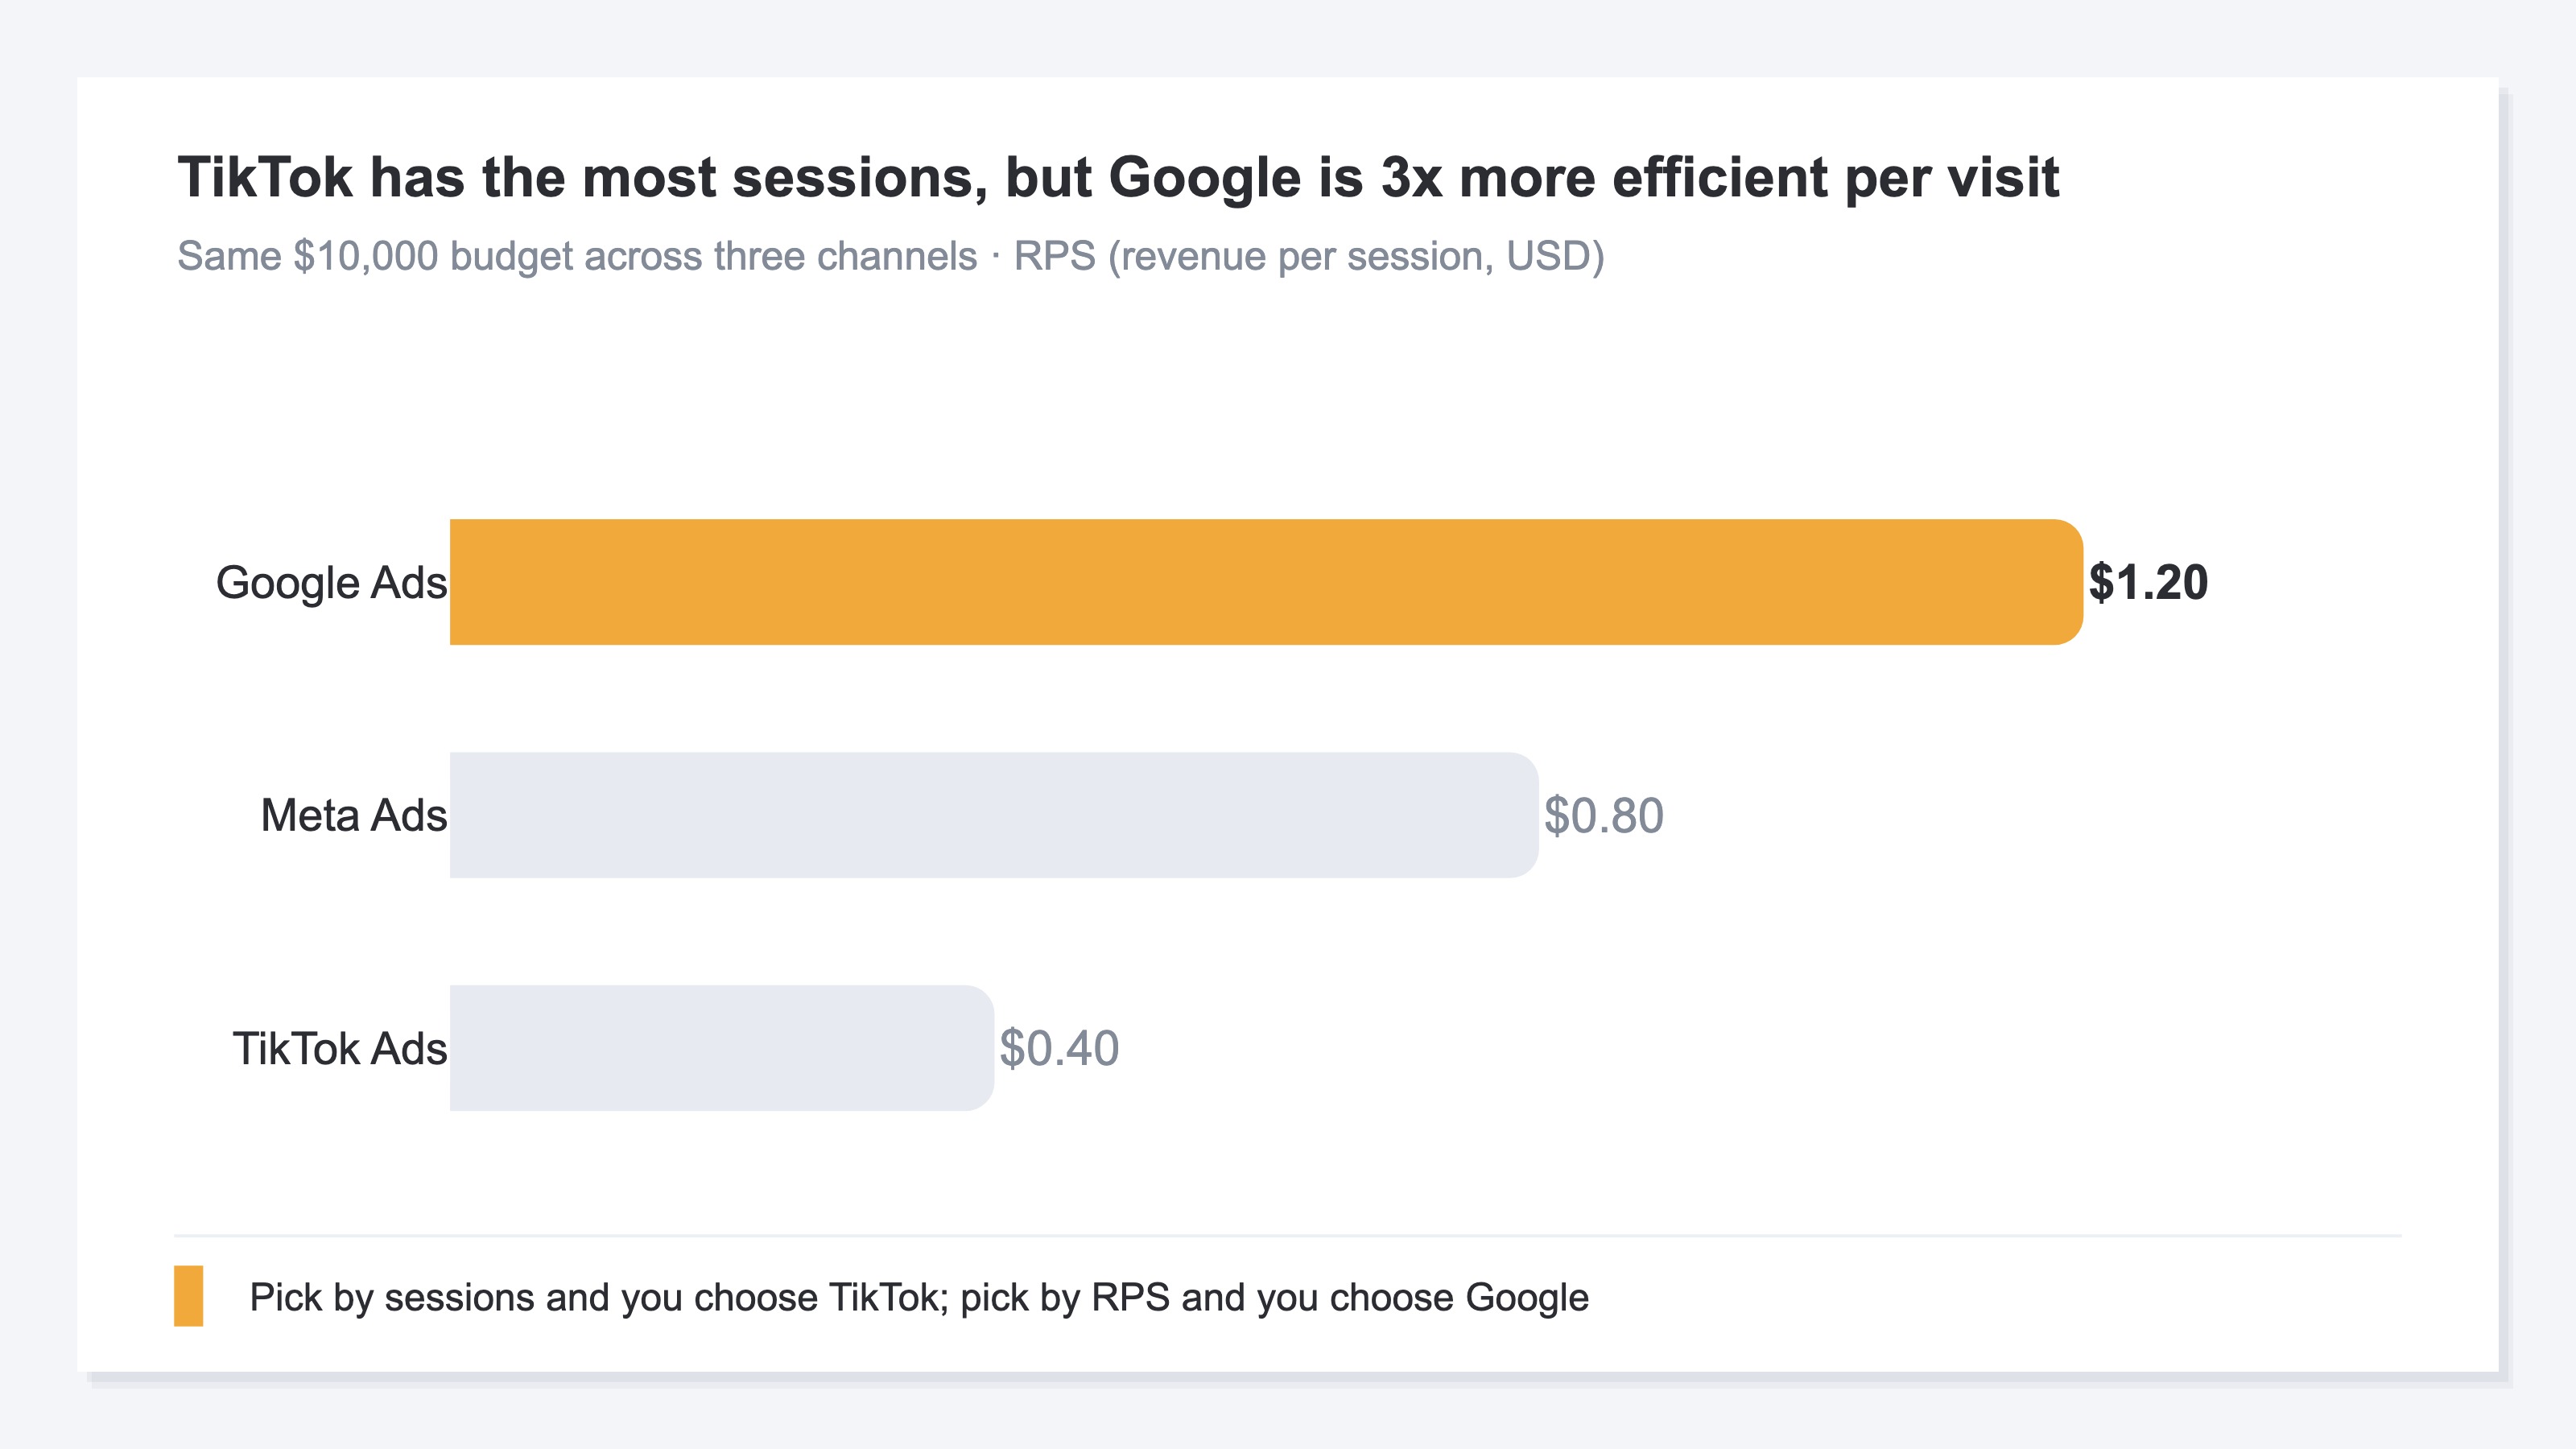
| Channel | Sessions | Revenue | RPS | Efficiency |
|---|---|---|---|---|
| Google Ads | 8,000 | $9,600 | $1.20 | Baseline |
| Meta Ads | 12,000 | $9,600 | $0.80 | -33% |
| TikTok Ads | 20,000 | $8,000 | $0.40 | -67% |
By sessions, TikTok wins handily. By RPS, Google Ads is 3× more efficient. Ad budget allocation should be judged by RPS.
Example 3: Bundle discount (AOV and CVR aligned)#
A retailer launched a 3-item, 20%-off bundle:
| Metric | Before | After | Change |
|---|---|---|---|
| AOV | $48 | $52 | +8% |
| CVR | 2.0% | 2.6% | +30% |
| RPS | $0.96 | $1.35 | +41% |
Both AOV and CVR move up, and RPS jumps. When AOV and CVR align, RPS climbs dramatically.
5. Operational notes — three things to watch#
Note 1: Session-definition drift#
GA4, Shopify, and your in-house DB define "session" slightly differently[1]. GA4 defaults to 30-minute inactivity timeout. Shopify treats same-day cookie continuity as one session. In-house DBs are designer-defined. Confirm session definitions before comparing RPS across tools.
Note 2: Multi-touch effects#
Last-click attribution inflates RPS for Brand Search and Direct traffic. When ads drive awareness and the customer returns later via Direct, ad contribution accrues to Direct's RPS. When using channel-level RPS for ad judgment, align attribution models (first-touch / last-touch / linear, etc.).
Note 3: Refund and cancellation timing#
Shopify and GA4 typically compute RPS on order-time revenue, often not reflecting later refunds and cancellations. In high-return industries (apparel, etc.), the gap between effective RPS (post-refund) and surface RPS (at order) widens. Ad ROI judgments need effective RPS.
RevenueScope solution
Bottom line: lining up each channel's real revenue — with bots excluded — alongside RPS, AOV, and CVR on one screen is something GA4 and ad-platform dashboards structurally don't do. This is RevenueScope's territory.
RPS shows its real value when you line channels up and compare them. But GA4 and each ad platform's dashboard don't align RPS on one consistent basis across channels — each uses its own basis, with bot traffic still mixed in, and session counts or absolute revenue take the spotlight.
RevenueScope uses its own tracking to remove bots and duplicates, and shows each channel's real revenue alongside RPS, AOV, and CVR on one screen. Rooted in your own sales, it lines up which channels sell efficiently on one consistent basis.
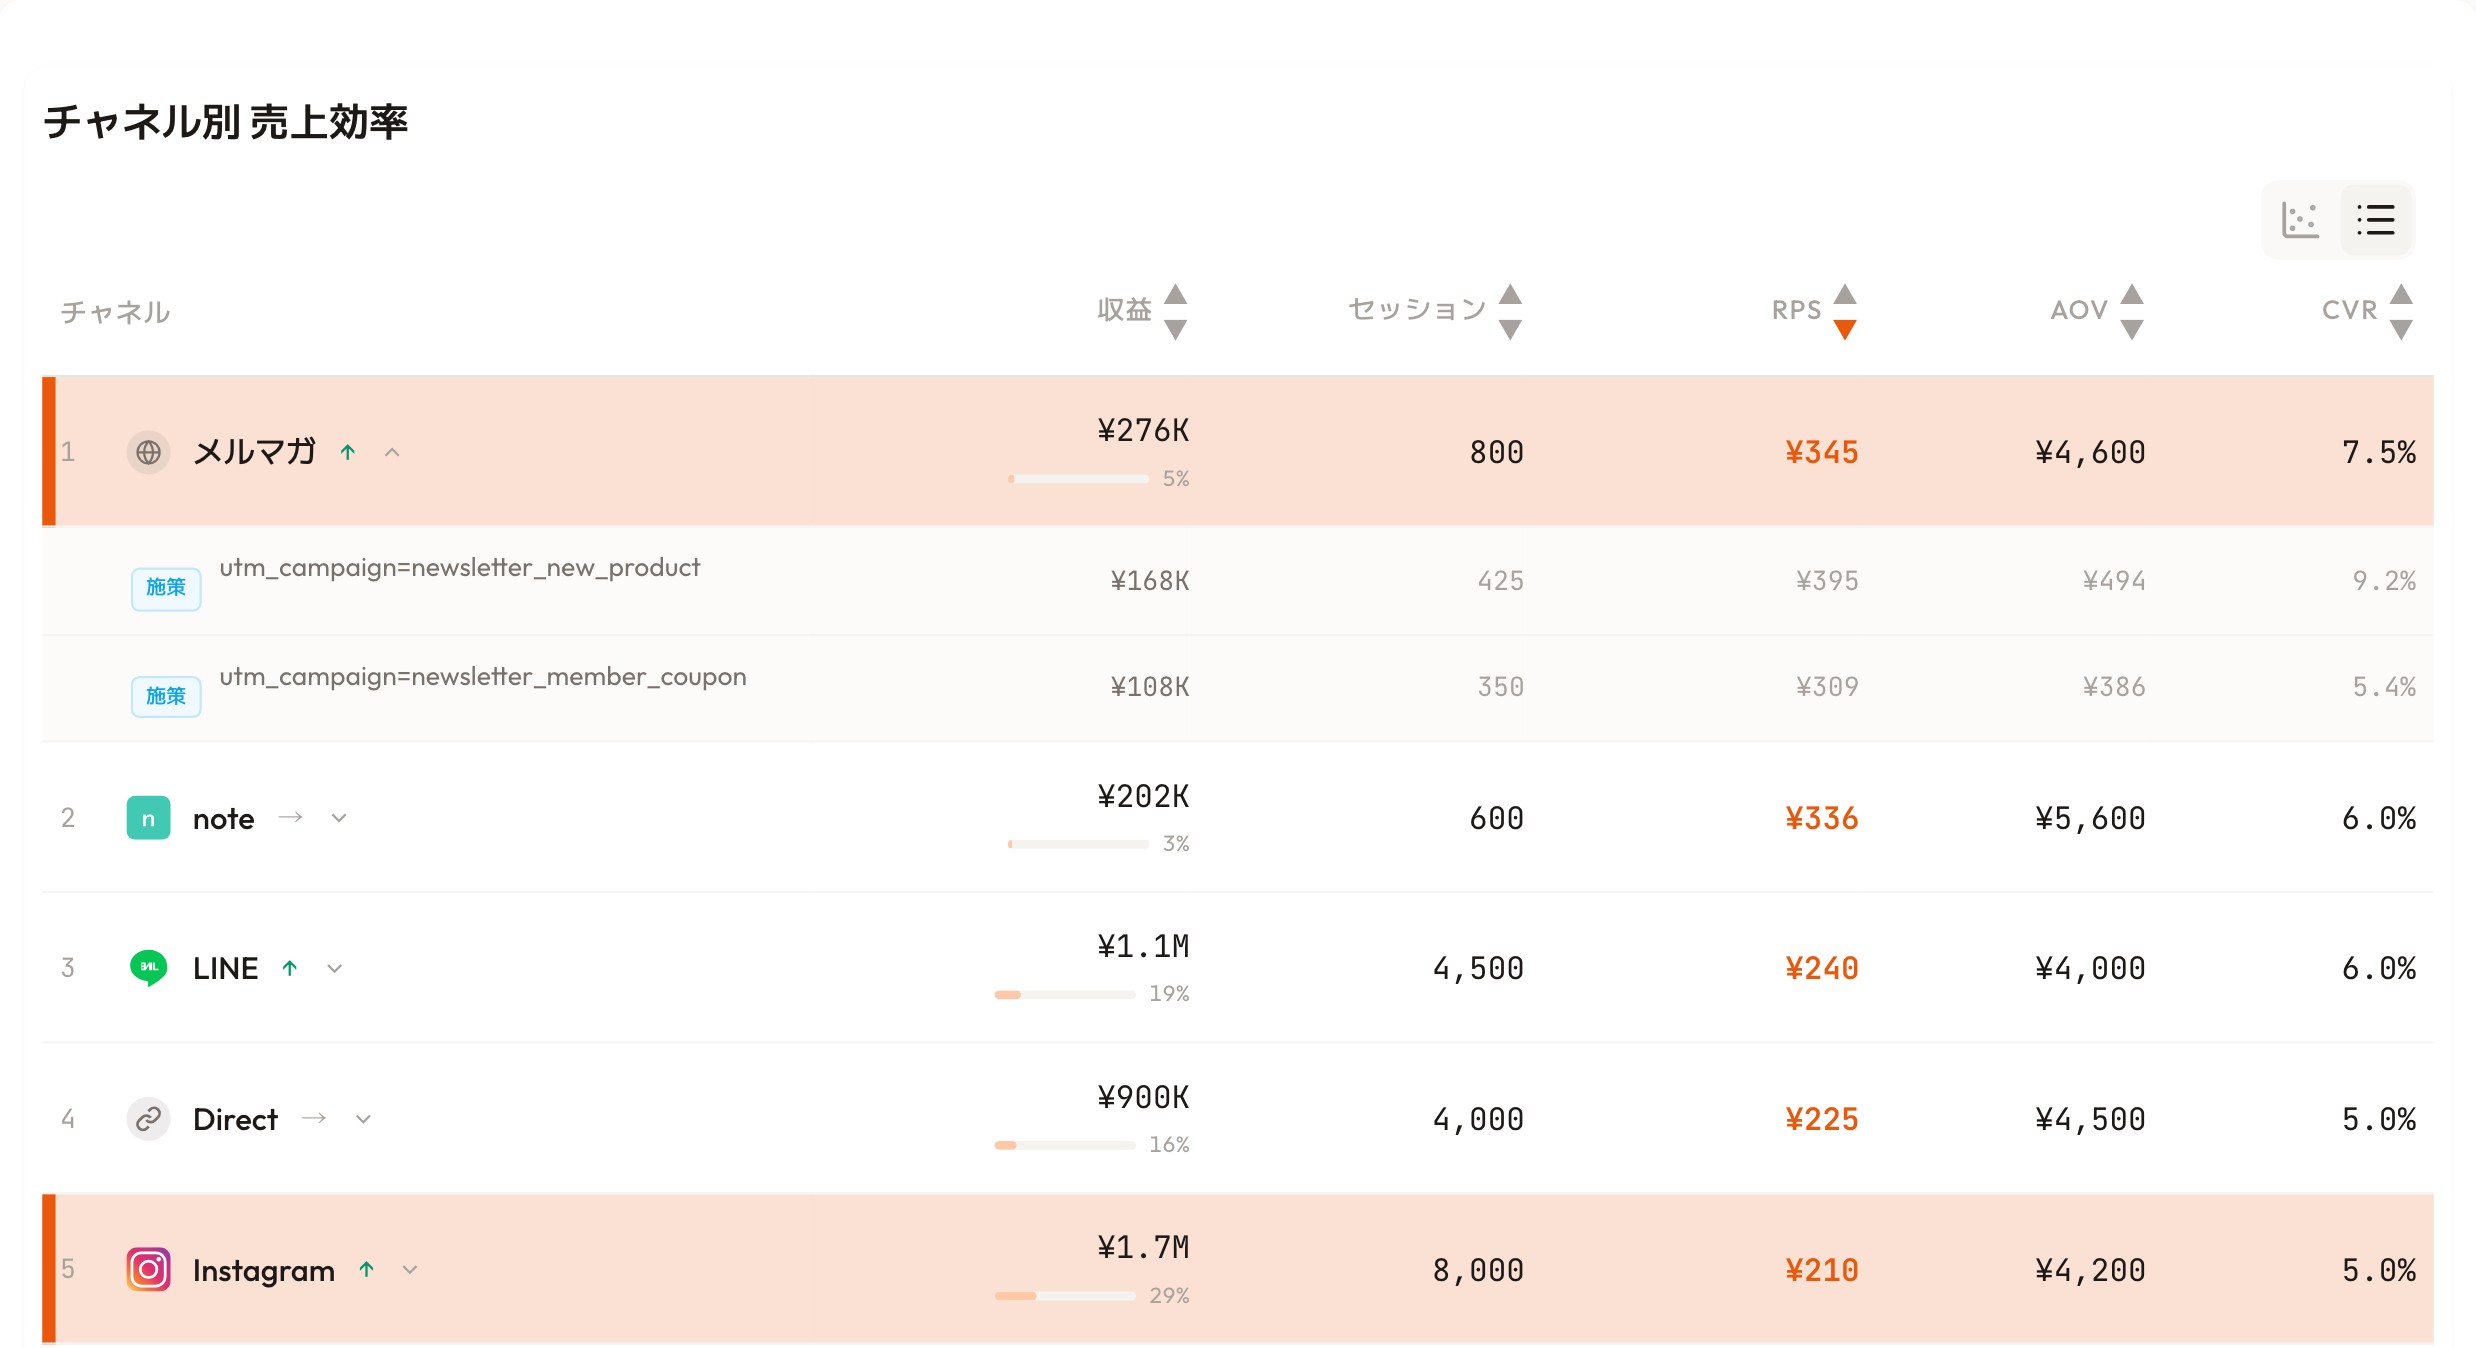
RevenueScope's dashboard (demo data shown). It puts each channel's RPS, AOV, and CVR side by side, so you judge by efficiency, not revenue size.
Take the screen above. The biggest revenue belongs to Instagram (¥1.7M). But by RPS, Instagram sits last at ¥210 — while the newsletter, with far smaller revenue (¥276K), tops the list at ¥345. If you only watched session counts or revenue size, you'd crown Instagram the ace; line them up by RPS and the channel that sells most efficiently is clearly the newsletter.
Open the newsletter row and you see the difference even within one channel: the new-product campaign converts at 9.2%, the member-coupon one at 5.4%. You can decide which campaign to back, by RPS and conversion rate. RPS you compute by hand still carries bot traffic and duplicates, and each channel sits on a different basis — RS lines RPS up after making the comparison sound. The difference isn't "saving effort"; it's handing you a comparable state in the first place. That is the next step toward moving ad budget correctly while avoiding the session-count trap.
FAQ#
Q1. Can GA4 really not produce RPS?#
Not from standard reports. You can build it in Explorations as a custom calculation: "Total revenue ÷ Sessions"[1]. The non-standard nature means more operational overhead.
Q2. RPS vs. ARPU (revenue per user) — which is right?#
Depends on use case. RPS (per session) is strong for ad-channel efficiency. ARPU (per user) is strong for LTV and repeat evaluation. For ad investment decisions in ecommerce, RPS is standard.
Q3. How does RPS target vary by industry?#
RPS varies so much by industry and order value that a single "industry average" is not a reliable reference. As one data point, the demo data shown in this article ranged from ¥345 (newsletter) to ¥210 (Instagram) — a demo example only. For per-industry reference points and how to read them, see RPS benchmarks by industry. Your own historical RPS trend is the most reliable benchmark.
Q4. Does attribution model affect RPS?#
Yes. Last-click vs. first-click vs. linear redistribute revenue across channels, which changes channel-level RPS. Use one consistent model when comparing (Last-Click Attribution Trap).
Wrap-up#
Revenue = Sessions × RPS
A simple equation, but it contains all of "budget allocation" and "initiative impact."
- Initiatives that grow sessions (SEO, ads) → move sessions
- Initiatives that lift unit price (bundles, thresholds) → move RPS through AOV
- Initiatives that improve conversion (UX, LP optimization) → move RPS through CVR
According to METI's e-commerce market survey[3], Japan's BtoC e-commerce market reached ¥26.1 trillion in 2024. Even at this scale, only a small fraction of operators run integrated metrics like RPS as a primary KPI. Operators who adopt RPS early have meaningful room to differentiate.
See which ads actually drive revenue, at a glance
Free up to 5,000 sessions/month, AI analyst included. No credit card required. Up and running in 5 minutes.
References#
[1] Google "Analytics dimensions and metrics — Average purchase revenue per user" 2025
[2] Baymard Institute "E-Commerce Cart & Checkout Usability Research" 2024
[3] Ministry of Economy, Trade and Industry (METI) "FY2024 E-Commerce Market Survey" August 2025


