
"Our ROAS is 3.0, so the ads are profitable"—and on that basis you set next month's budget with the same split. It's a common call, but there's a trap here. That "3.0" is an average that lumps all your ads together.
Averages and totals are convenient, but they cover up what's inside. If one channel earns well, a channel quietly bleeding money behind it gets smoothed over and disappears from view. The whole looks profitable, yet part of the budget is silently melting away—this is the "average ROAS trap." The same thing happens with average order value. This article walks, step by step, through why deciding budgets on averages leads you astray, and how to split by channel to see "where to pull budget from and where to move it."
Contents
What this article covers#
- Average ROAS and average order value let strong channels cover for weak ones. Even when the whole looks profitable, the breakdown can hide a bleeding channel that's melting your budget.
- The same "average ROAS 3.0" calls for opposite moves depending on whether every channel sits at 3.0, or one channel runs at 10.0 while the rest run at a loss. Looking only at the average, you can't tell the difference.
- Budget allocation is decided not by "is the whole profitable" but by "which channel to pull from and which to move toward." For that, you have to look at ROAS and revenue efficiency (RPS, revenue per session) channel by channel.
1. The average ROAS trap | why judging by the whole leads you astray#
ROAS shows "how many times the ad spend came back as revenue," calculated as revenue ÷ ad spend. A ROAS of 3.0 means ¥10,000 of ad spend brought ¥30,000 of revenue.
The trouble starts when you view this number "lumped together for the whole." If you run ads across several channels (Meta, Google, email…), the real ROAS differs by channel. Add them all up and average them, and you get a single "blended ROAS." Convenient—but at that moment, the good and bad of each channel vanish from view.
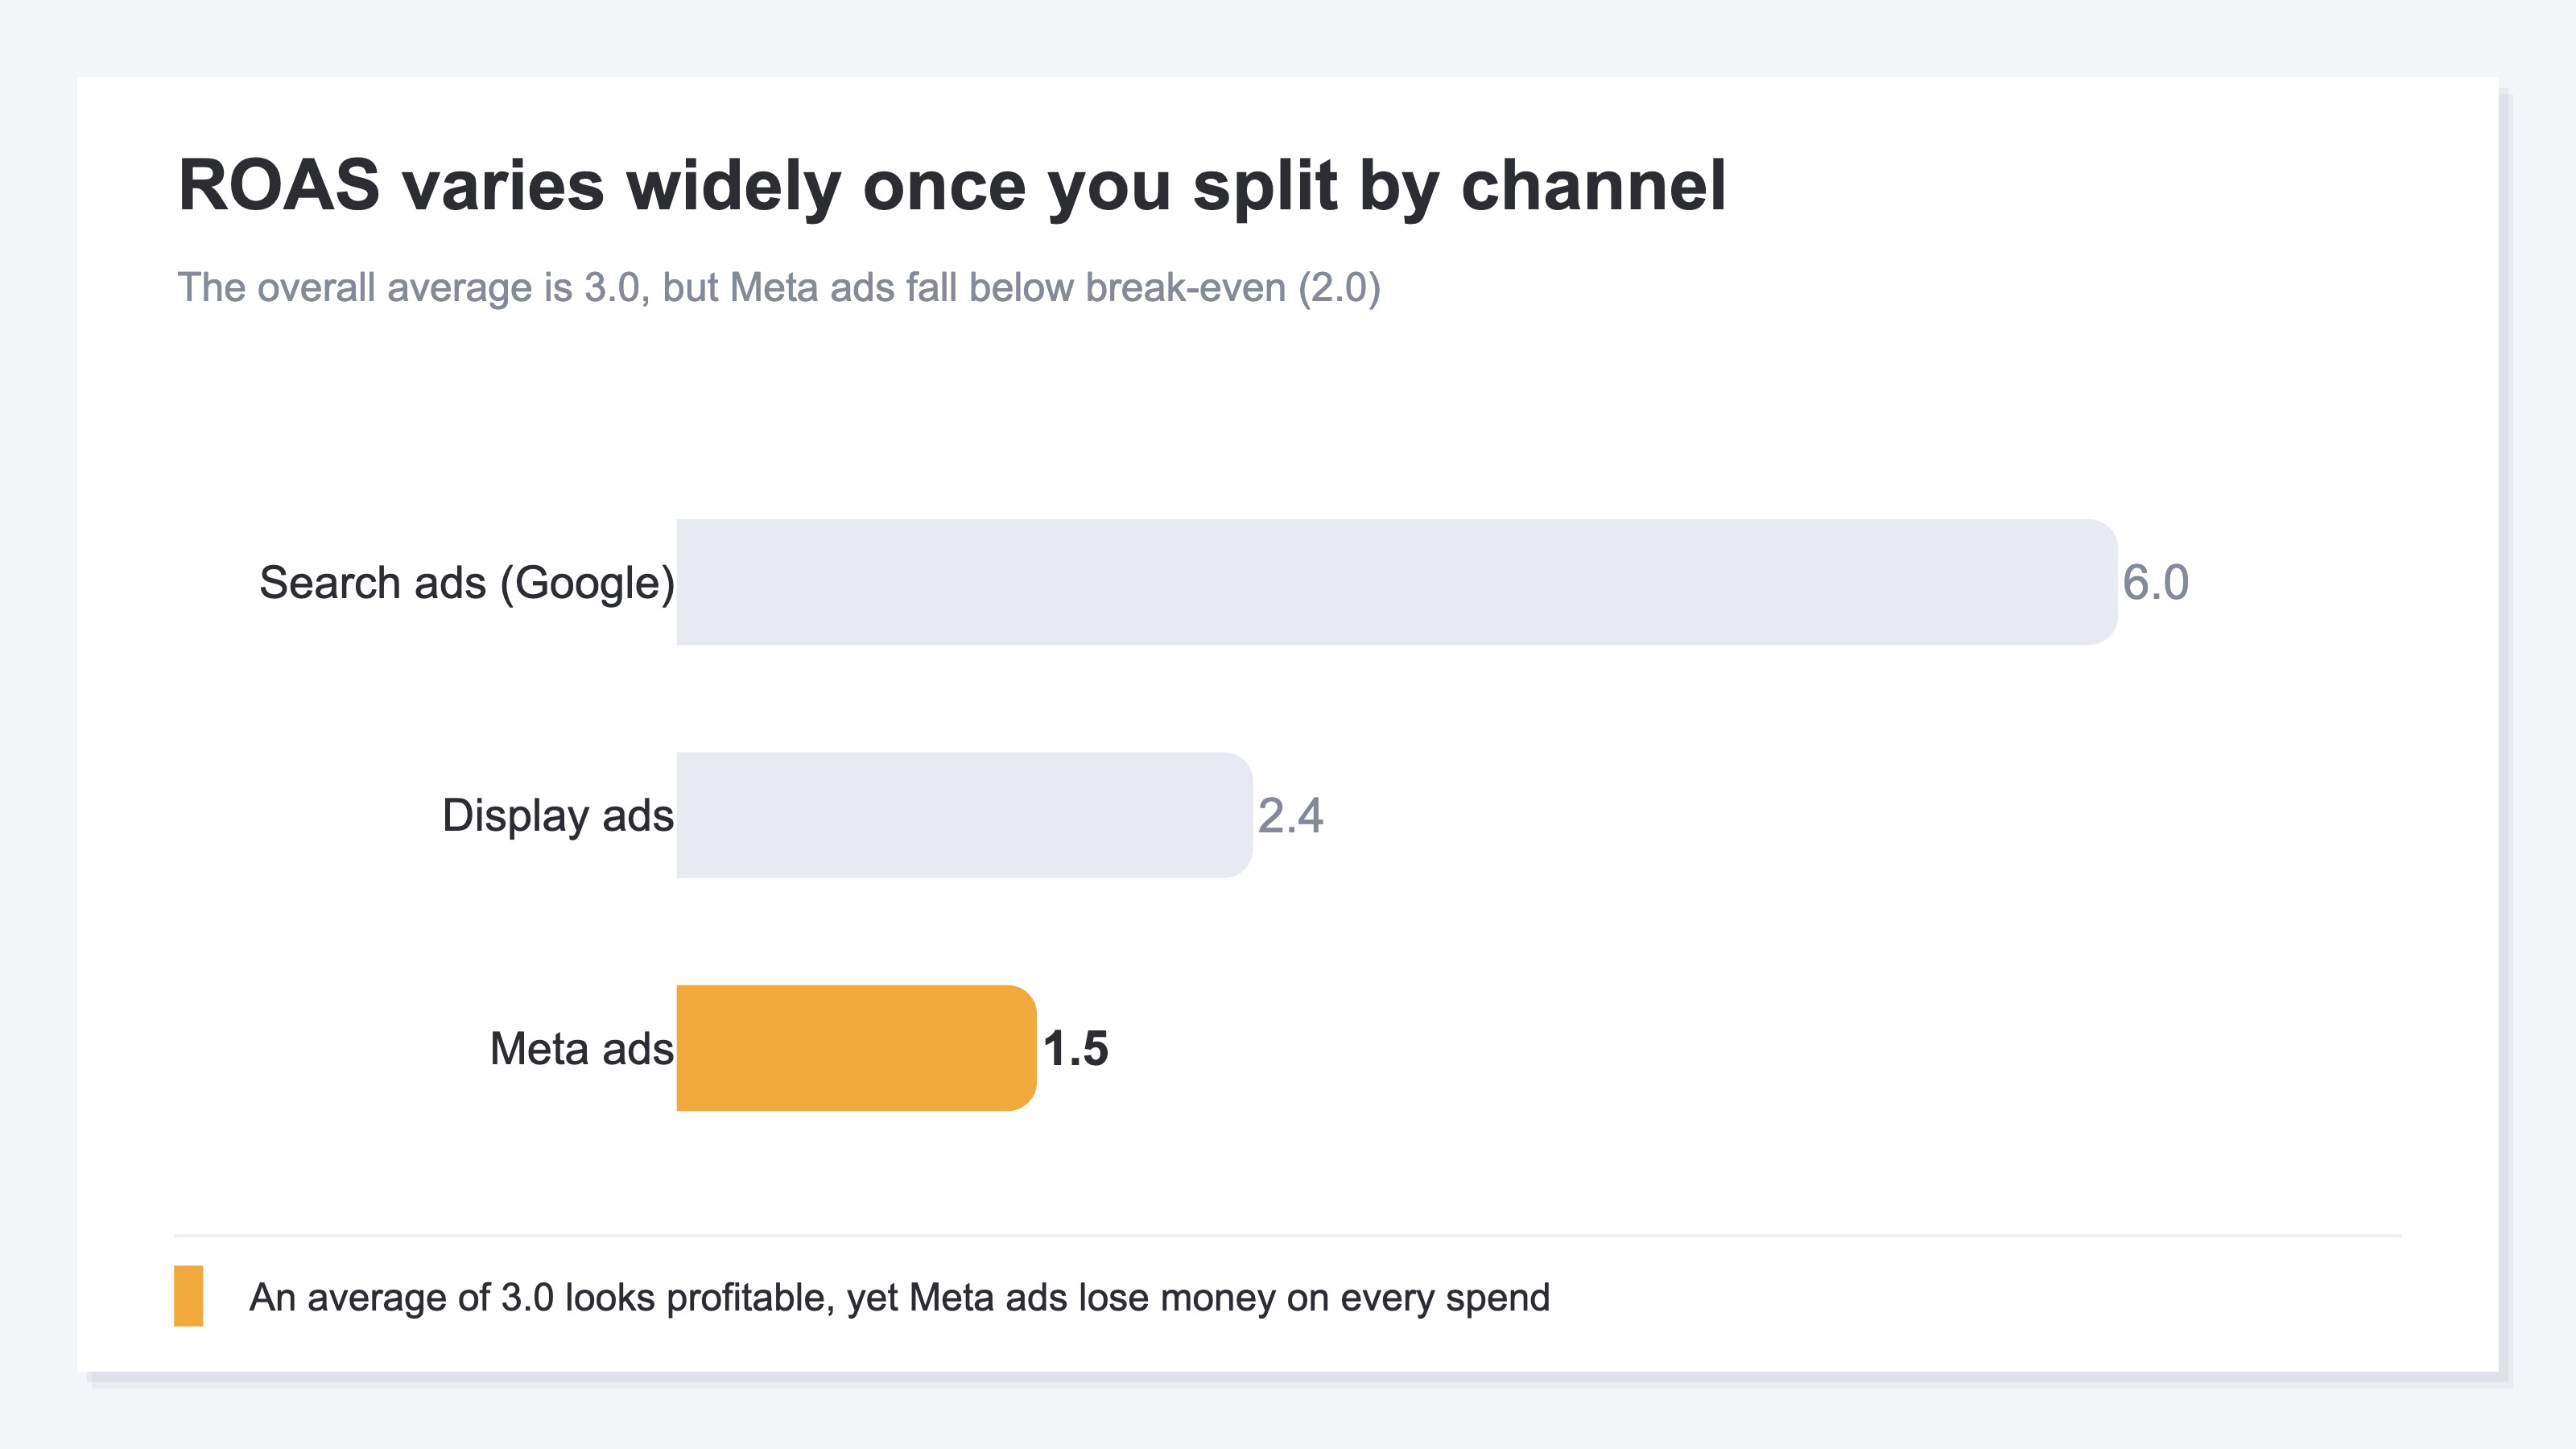
Say your blended ROAS is 3.0. At a glance it looks healthy. But open the breakdown and you'll often find search ads earning big at ROAS 6.0, while Meta ads sit at just ROAS 1.5. If your store's break-even point (the minimum ROAS needed to turn a profit) is 2.0, then the more you spend on Meta, the more you lose. Yet because the blended average reads 3.0, it's judged "profitable, no problem," and budget keeps flowing to the bleeding channel too.
The single number that is the average smooths over and erases "where you earn and where you melt money." The whole looking profitable and every channel being profitable are two entirely different things.
2. Same average, opposite insides | what the average hides#
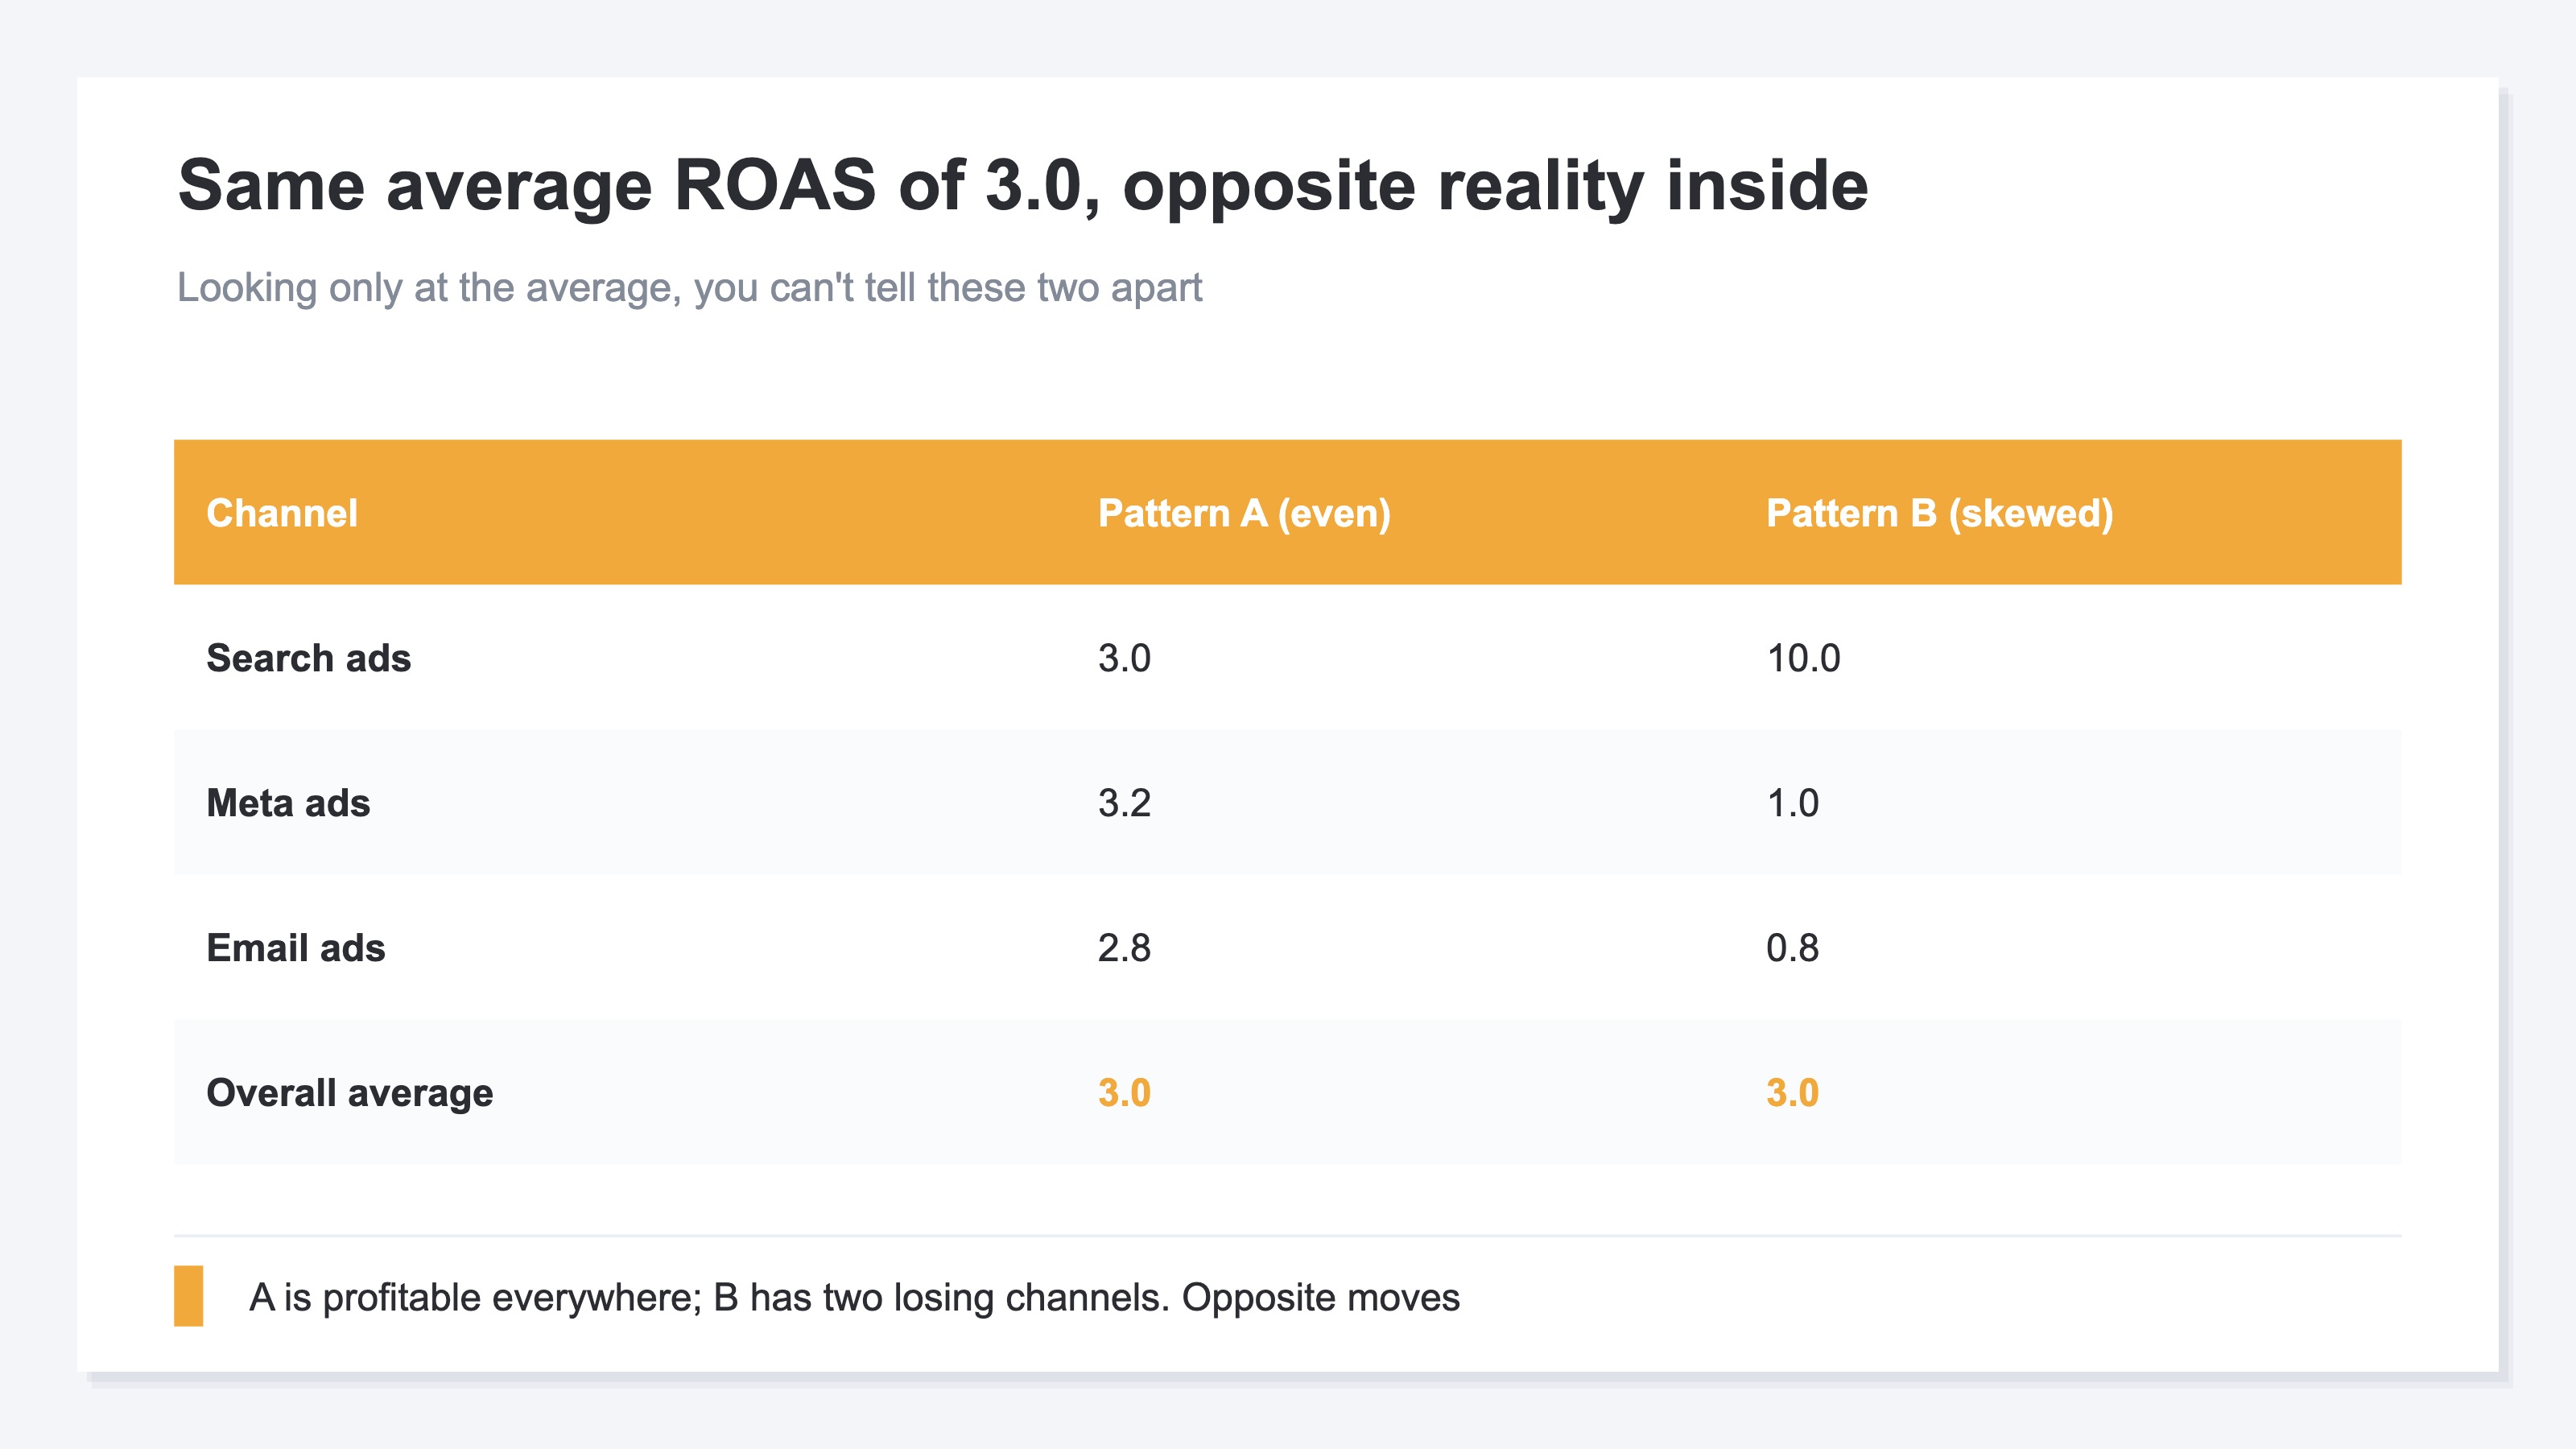
The scary thing about averages is that "the same average value can have completely different insides." Behind the same average ROAS of 3.0, opposite situations can hide.
One is the case where every channel lines up around 3.0. This is stable, and every channel is profitable. The other is the case where one channel stands out at ROAS 10.0 while the rest run at a loss. Smooth both out and the average is 3.0 either way. In other words, looking only at the average, you can't tell these two apart.
These two call for entirely different moves. In the first, you can raise budget a little across the board. But in the second, what you should do is "pull budget up from the bleeding channels and move it toward the ROAS 10.0 channel." Looking at the same "average 3.0," whether to increase or to rebuild the split becomes opposite calls. Trust the average and raise everything uniformly, and in the second case you'd grow the budget of the bleeding channels too—and profit would actually shrink.
The same trap happens with average order value (AOV, the average purchase amount per order). Even if the overall average order value is the same ¥8,000 as last month, behind it "new customers' order value has dropped, and existing customers' high order value is covering for it" can be the case. The average holds flat, yet the quality of new customers is slipping. This too is a textbook case of a single number, the average, smoothing over and hiding what's inside.
3. From average to breakdown | budget is decided by "where to pull from"#
As we've seen, averages and totals are almost useless for budget allocation decisions. That's because the heart of budget allocation is not "is the whole profitable" but "which channel to pull from and which to move toward." For that, there's no way around breaking the average down and looking channel by channel.
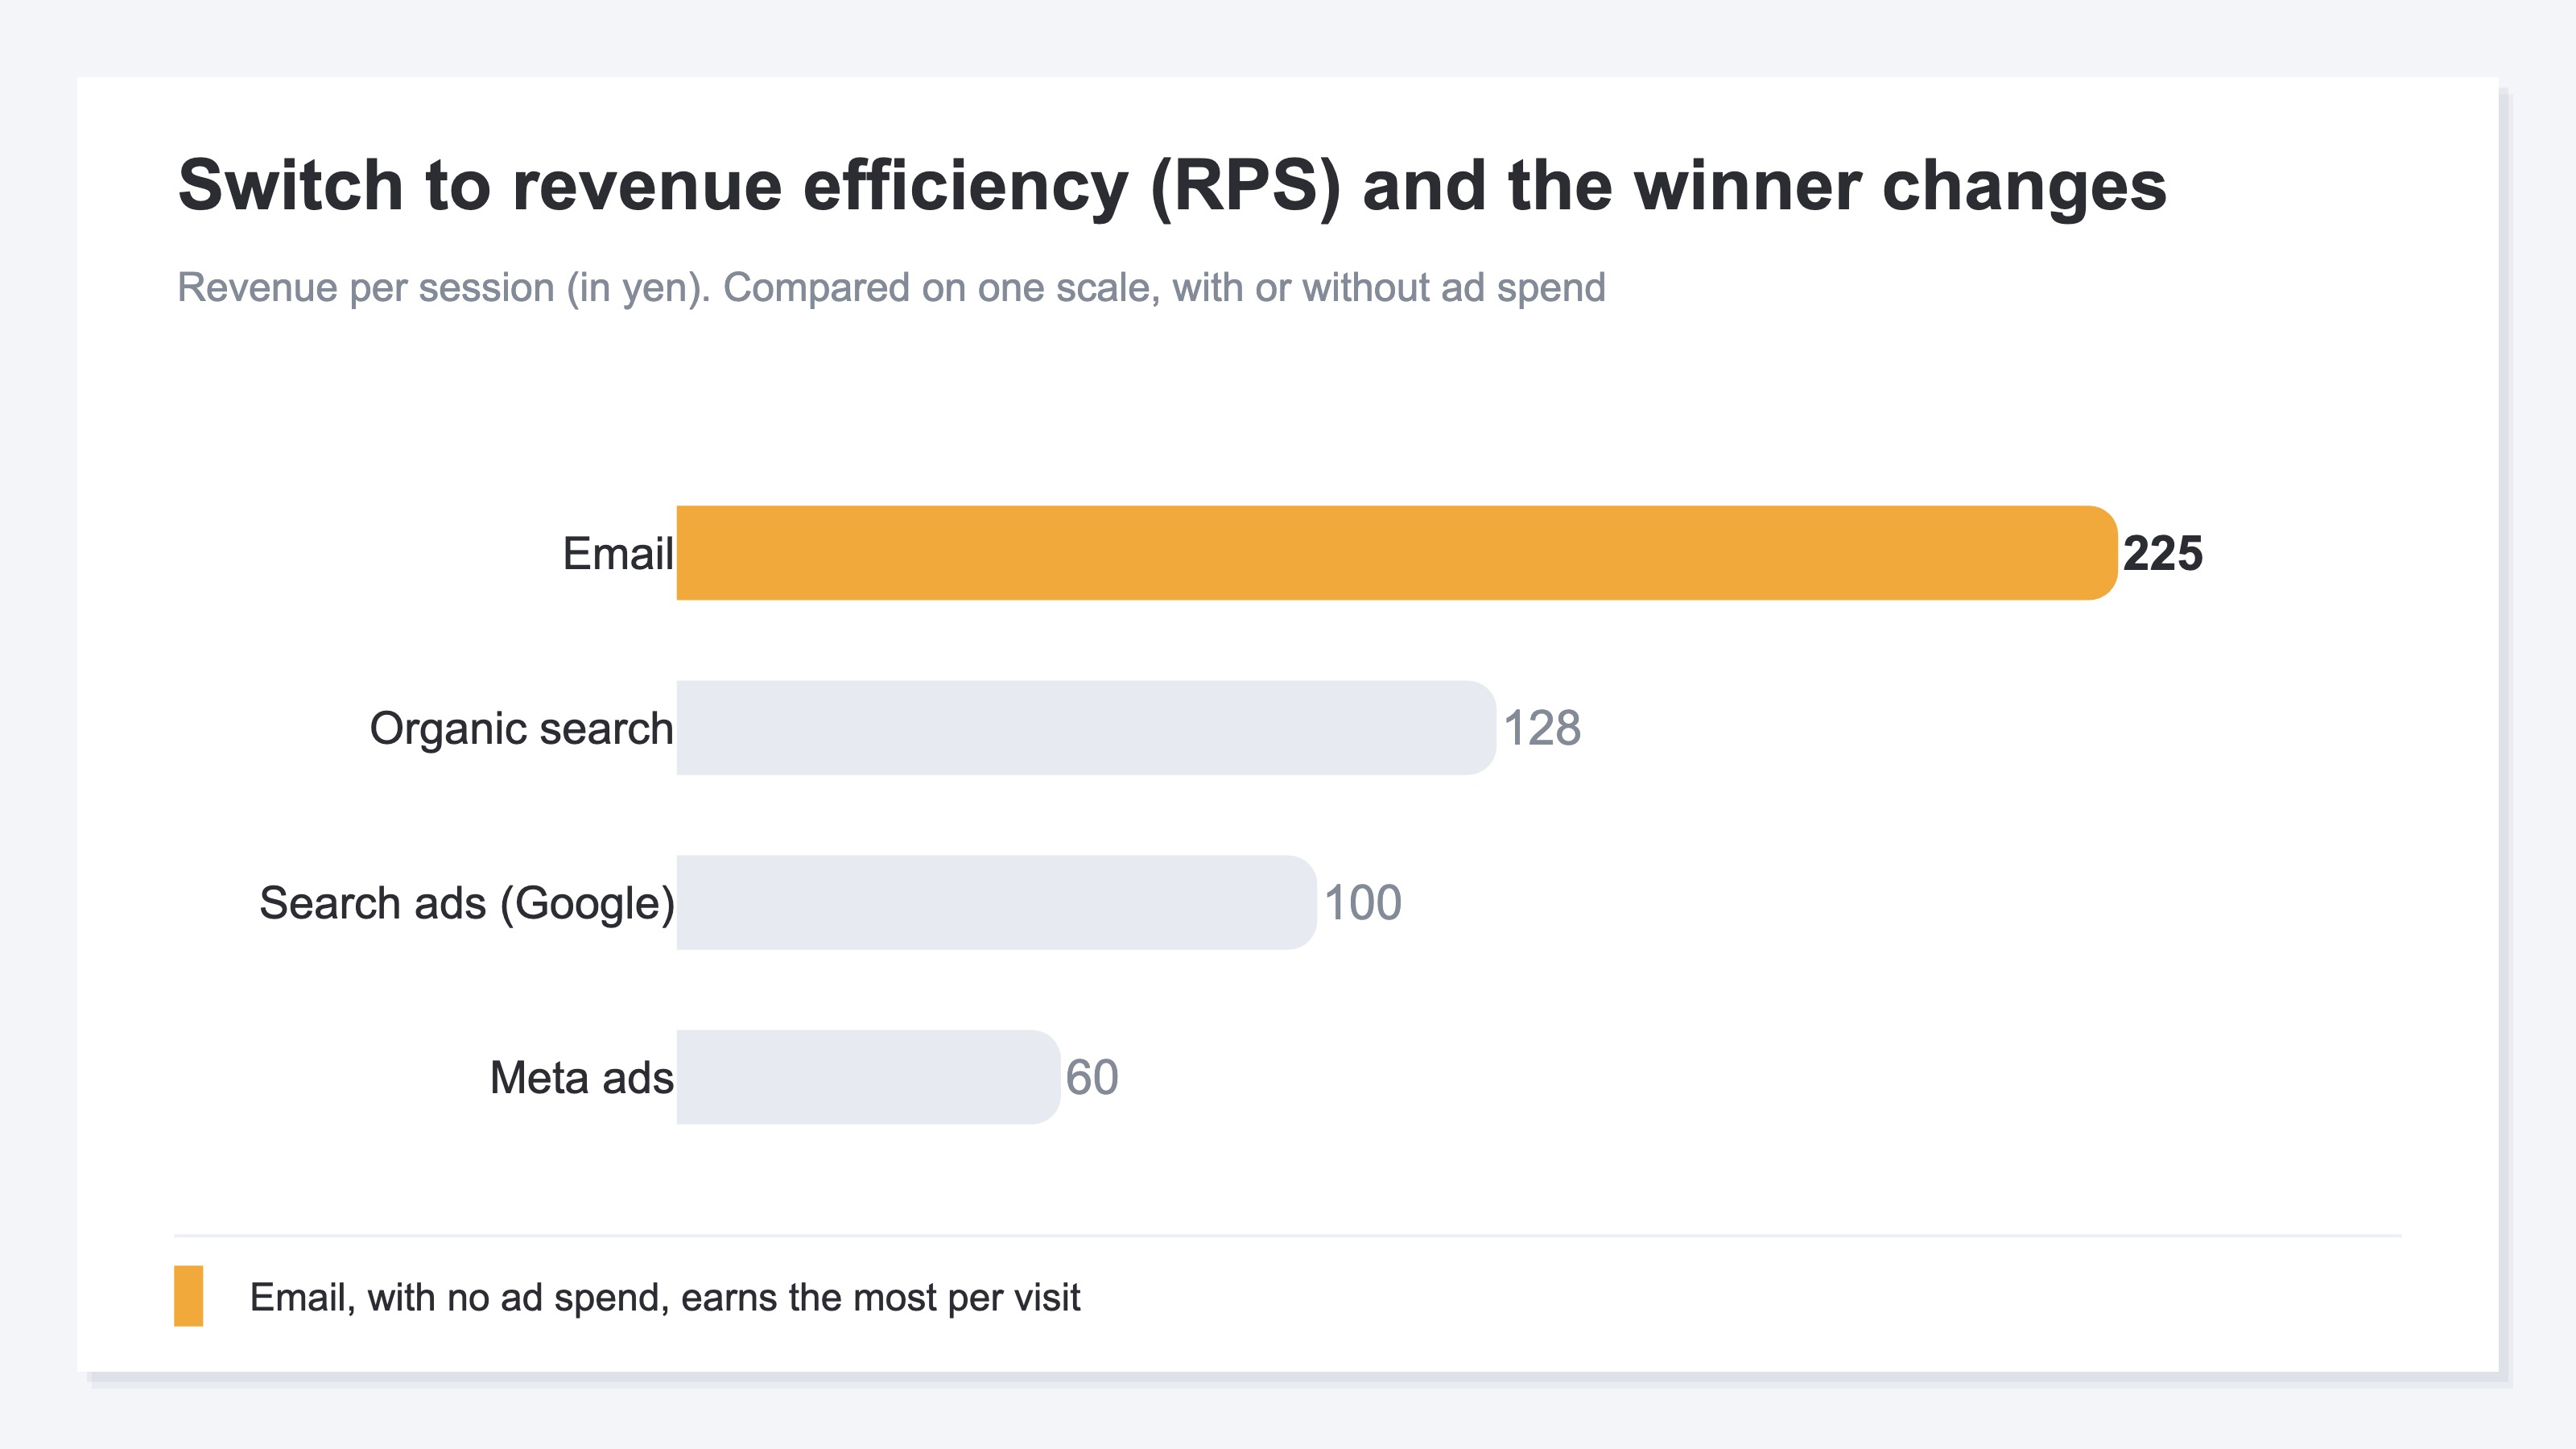
When you look channel by channel, ROAS alone falls short in some situations. Since ROAS is the multiple of revenue against ad spend, it can't measure the efficiency of channels you don't run ads on (organic search traffic or email). That's where revenue efficiency (RPS, Revenue Per Session = revenue per single session) comes in alongside it. RPS shows "how much revenue one visit generated on average," so it lets you compare every channel on the same scale, regardless of whether ads are involved. Line up ROAS, RPS, and revenue by channel on a single screen, and "channels with low revenue efficiency for the ad spend they consume" and "channels earning efficiently without any ad spend" become clearly distinguishable.
The idea itself isn't hard. What's hard is keeping it up every month. To produce ROAS by channel, you have to match each ad platform's ad spend against the site's revenue and sessions, channel by channel. But ad spend lives in each platform's dashboard, while revenue and sessions live in web analytics (GA4 and the like)—scattered across different places. On top of that, GA4 doesn't take in ad spend itself, so channel-by-channel ROAS doesn't show up in GA4's standard reports. In the end, you gather numbers from screen after screen every month and rebuild them by hand into a single table—and that effort stands in your way before you ever reach the decision.
RevenueScope — how it helps
Even once you understand you can't decide budgets on averages, the last thing you hit is the same wall: "I want to know ROAS and revenue efficiency by channel, but the numbers for that are scattered across multiple screens, and I can't see them unless I re-compile them every month."
RevenueScope consolidates those scattered numbers onto a single screen. It matches each ad platform's ad spend (read-only Google Ads integration, or manual entry) against the site's revenue and sessions, and lines up ROAS, revenue efficiency (RPS), and revenue by channel (figures are demo data).
| Channel | Ad spend | Revenue | ROAS | RPS (revenue efficiency) |
|---|---|---|---|---|
| Search (organic) | — | ¥320,000 | — | ¥128 |
| Search ads (Google) | ¥50,000 | ¥300,000 | 6.0 | ¥100 |
| Ads (Meta) | ¥160,000 | ¥240,000 | 1.5 | ¥60 |
| — | ¥180,000 | — | ¥225 |
Seen on a single screen, what the blended average hid surfaces at once. Meta ads, which consume the most ad spend, have a ROAS of 1.5. If your break-even is 2.0, this one bleeds the more you spend. Email, meanwhile, runs no ad spend yet has the highest RPS (revenue per visit) of all channels at ¥225. So the next move comes into view: "pull Meta's budget up and route it toward strengthening the more efficient email and search ads." It's a decision you could never reach by staring at the single number of blended ROAS 3.0.
Let's be clear about one thing. What RevenueScope does is split ROAS, revenue efficiency (RPS), and revenue by channel and line them up on a single screen. How much budget to move and how—that final decision is yours. And profit margin (gross margin) and customer lifetime value (LTV), numbers on the accounting and customer-management side, are not handled by RevenueScope. What it produces is revenue, efficiency against ad spend, and where it came from. It assembles the material for deciding where to pull budget from and where to move it—but you're the one holding the wheel.
FAQ#
Frequently asked questions#
Q. If the blended ROAS clears the break-even point, isn't it fine?
A. Even when the whole clears it, the breakdown often mixes in a bleeding channel. The earning channels are simply covering for the losses of the bleeding one. Leave that as is, and the budget spent on the bleeding channel is money that could have gone to a channel that earns far more efficiently. Even if the whole is profitable, rebuild it channel by channel—"pull up here, move toward there"—and the same budget grows more profit.
Q. Is watching ROAS alone enough? Do I need RPS too?
A. Since ROAS is the multiple of revenue against ad spend, it can't measure the efficiency of channels you don't run ads on (organic search traffic or email). RPS (revenue per session) lets you compare every channel on the same scale regardless of whether ads are involved, so lining up both makes "channels with low efficiency for the ad spend they consume" and "channels earning efficiently without ads" distinguishable. To decide where to move budget, having both keeps the judgment steady.
Q. Can I see channel-by-channel ROAS in GA4?
A. Because GA4 doesn't take in ad spend itself, channel-by-channel ROAS doesn't show up in the standard reports. You can see revenue and sessions in GA4, but to produce ROAS you have to bring in each ad platform's ad spend separately and match it by channel, by hand. That monthly compiling work is the biggest hurdle when moving from average to breakdown.
Summary#
Average ROAS and average order value let strong channels cover for weak ones. Even when the whole looks profitable, the breakdown can mix in a bleeding channel that's melting your budget. The same "average ROAS 3.0" calls for opposite moves between the stable type where every channel lines up and the type where one channel stands out while the rest run at a loss.
Budget allocation is decided not by "is the whole profitable" but by "where to pull from and where to move toward." For that, break the average down and line up ROAS, revenue efficiency (RPS), and revenue channel by channel. First, just once, forget the blended ROAS and split the numbers by channel. The moment you see the bleeding channel the average had covered up, how you build next month's budget changes.
See which ads actually drive revenue, at a glance
Free up to 5,000 sessions/month, AI analyst included. No credit card required. Up and running in 5 minutes.