"Our ad ROAS is 350% — is that good or bad?" This is the question we hear most often from EC operators staring at an ad report.
Comparing against the industry average alone does not tell you. Two apparel stores, one with a 40% gross margin and one with 60%, have break-even ROAS lines that differ by 1.5x. This article organizes ROAS benchmark ranges by industry, then shows how to judge your own number correctly and how to decide what to do next.
Table of contents
TL;DR#
- ROAS benchmarks differ by 2x or more across industries. Apparel 300-400%, cosmetics 400-600%, food 250-350%, electronics 200-300% are representative ranges. Because AOV and margin characteristics vary by industry, comparing on a single "average ROAS" misleads decisions.
- Your own break-even ROAS matters more than the industry average. Break-even ROAS = 1 / gross margin. A 40% margin needs 250%, a 60% margin needs 167%. Judge profit or loss against the floor derived from your own margin, not the industry average.
- ROAS alone does not decide your next move. Even if you know how well ad spend was recovered (ROAS), you cannot decide which channel to fund next without looking at revenue per session (RPS) by channel.
1. ROAS benchmark ranges by industry (2026)#
ROAS benchmarks vary by 2x or more across industries, so start by knowing where your own industry sits.
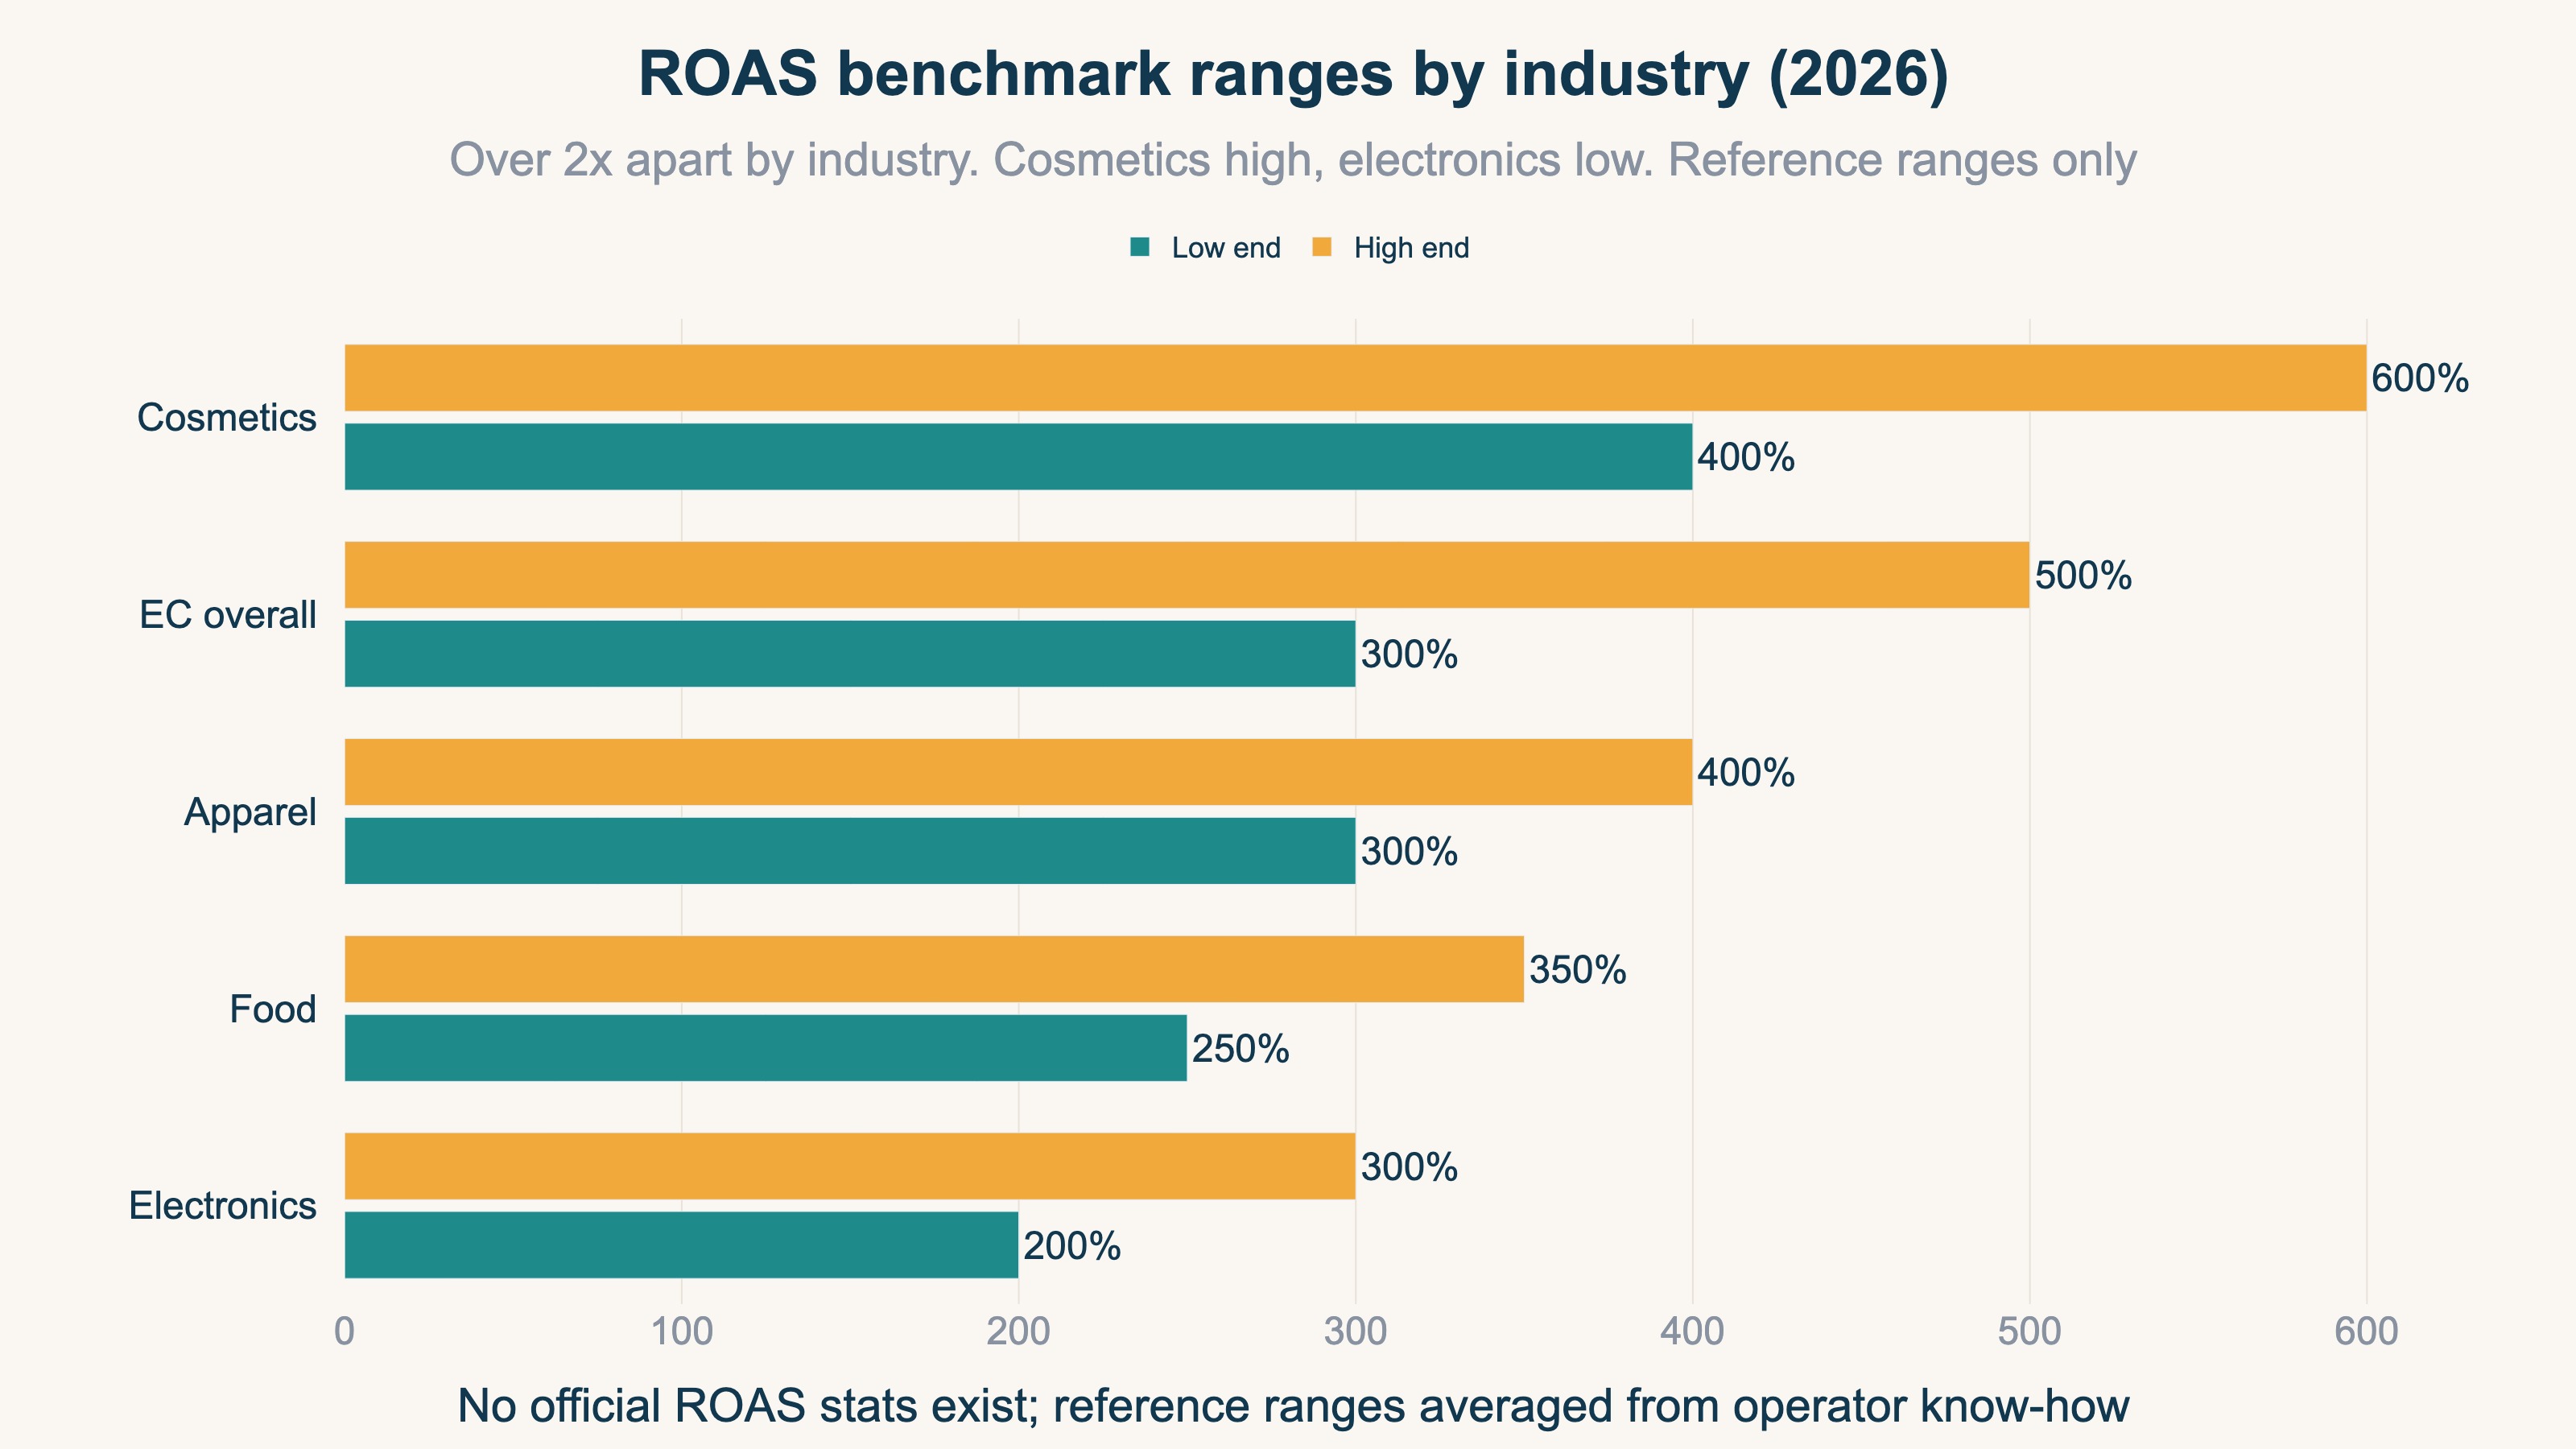
| Industry | ROAS range | Notes |
|---|---|---|
| Fashion / Apparel | 300-400% | Low unit price, intense competition, strong seasonality |
| Cosmetics / Beauty & health | 400-600% | Repeat-driven with high LTV; first-purchase targets run high |
| Food / Grocery / D2C | 250-350% | Low price, high-frequency repeat; a low first ROAS can still recover |
| Electronics | 200-300% | High price but thin margins, long consideration cycle |
| EC overall (reference) | 300-500% | A blended cross-industry reference value |
⚠️ This table is a representative range averaged from operator know-how. There is no official ROAS statistic by industry. The right target shifts greatly with unit price, margin, and ad channel mix. Use it only as a starting point.
Why such big differences? Two reasons. One is the AOV (average order value) gap: a single electronics order can run tens of thousands of yen, while an apparel D2C order averages around ¥6,000. The other is the margin gap: food and apparel run thin margins, so the revenue needed to recover the same ad spend changes. A different industry changes what "the same ROAS" even means.
2. Why copying the industry average as your target is dangerous — break-even ROAS#
Your target should not be the industry average. It should be the break-even ROAS derived from your own gross margin.
Break-even ROAS is the ROAS at which ad spend is exactly recovered (profit is zero). The formula is simple.
Break-even ROAS = 1 / gross margin
Just plug in your gross margin (gross profit as a share of revenue) and you get the minimum ROAS needed to be in the black.
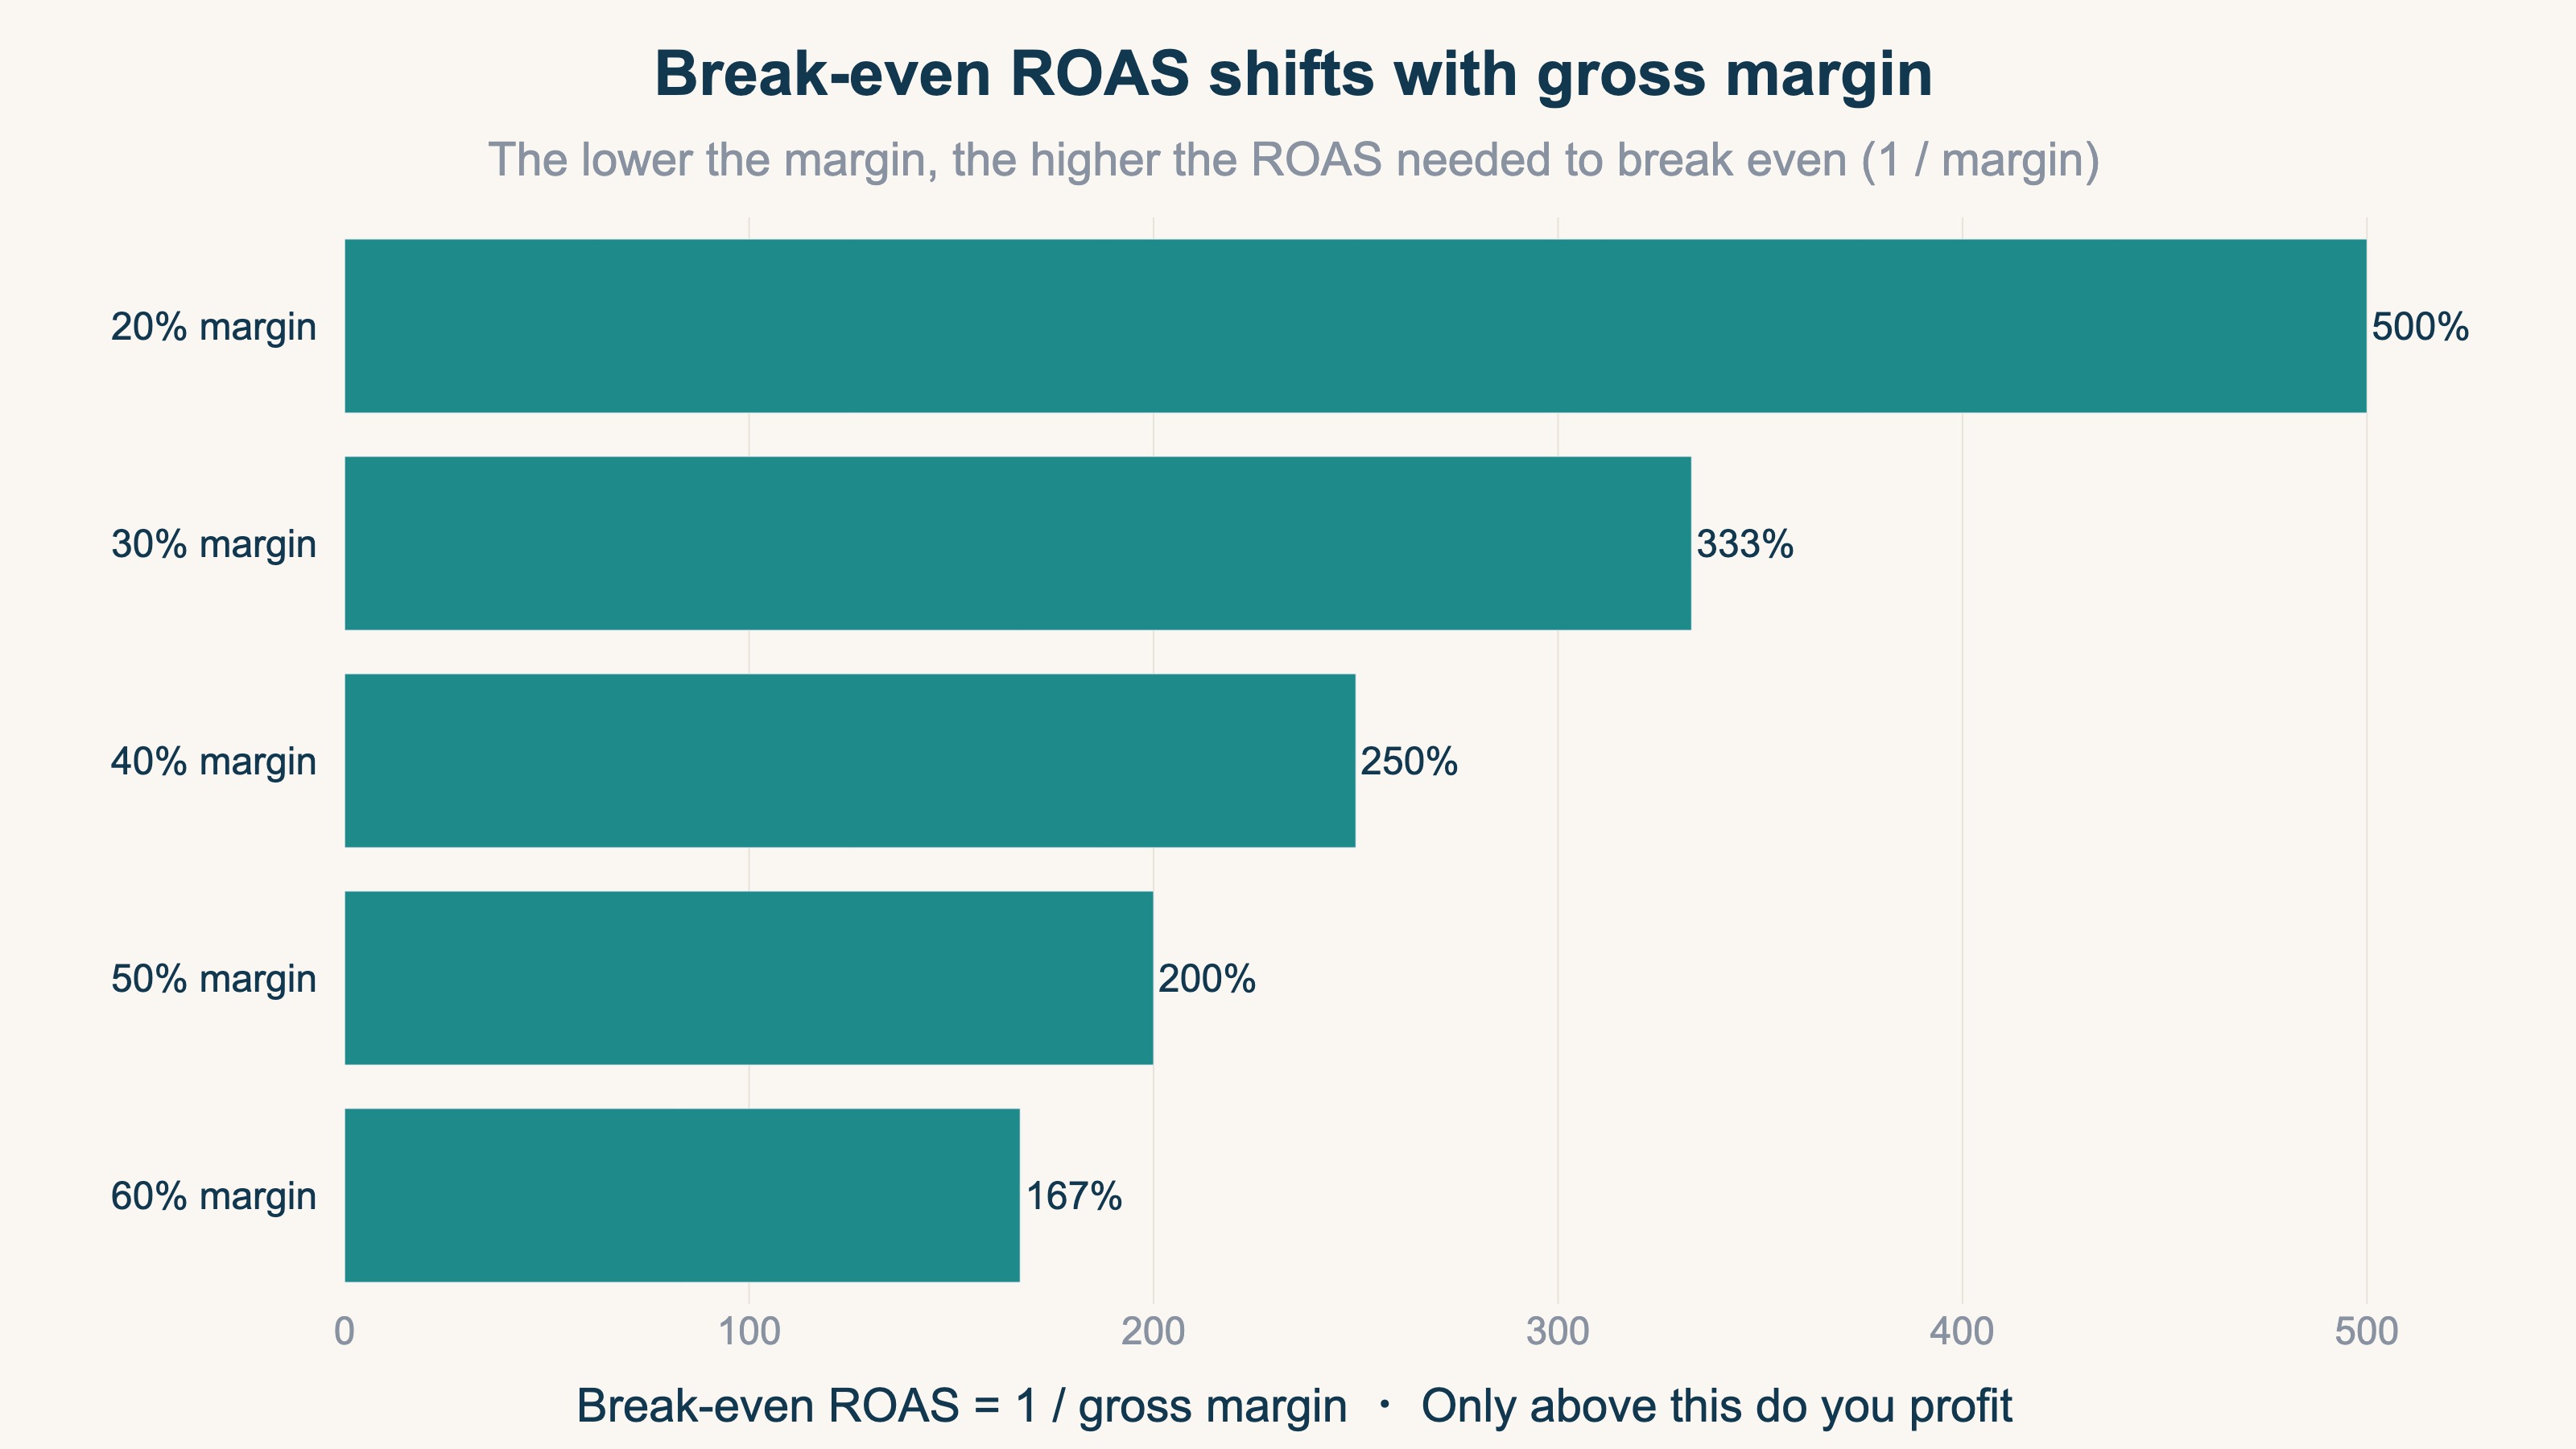
| Gross margin | Break-even ROAS | Meaning |
|---|---|---|
| 20% | 500% | Only at 500% do you break even |
| 30% | 333% | Below 333% is a loss |
| 40% | 250% | 250% is the break-even line |
| 50% | 200% | Recovered at 200% |
| 60% | 167% | Profitable above 167% |
Here the trap of the industry average appears. Say the apparel average is 350% and you set that as your target. But if your own margin is 30%, your break-even is 333%. Hitting the 350% average leaves almost no profit. Conversely, if your margin is 60%, your break-even is 167%, so a 250% ROAS is comfortably profitable.
In other words, judge by "did I beat my own break-even?" not "did I beat the industry average?" For the formula and the detailed back-calculation of break-even, see the ROAS complete guide and what ROAS is.
3. A 3-step way to judge whether your ROAS is good or bad#
Instead of a simple comparison to the industry average, judge "profitable or has room" in three steps against your break-even.
Step 1: Derive your break-even ROAS from your gross margin#
First confirm your gross margin. If cost of goods is unclear, estimate gross profit roughly as "revenue − purchase cost − shipping − payment fees." Once you have the margin, compute break-even ROAS as 1 / margin.
Step 2: Compare actual ROAS to see if you are profitable#
Compare the ROAS in your ad console (revenue / ad spend) to the Step 1 break-even. The judgment is simple.
| Actual ROAS vs break-even | Verdict | Next direction |
|---|---|---|
| Below 0.8x of break-even | Loss | Pause delivery; revisit creative / targeting |
| 0.8-1.2x of break-even | Around break-even | Stage to push into profit through improvement |
| 1.2x or more of break-even | Profitable | You can consider scaling budget |
Step 3: Use the industry range only as a sanity check#
Finally, compare against the industry ranges from Section 1. This is not for goal-setting but for checking how far you sit from your industry. If you fall well below the range, the issue may lie in the product margin structure itself, or in non-ad acquisition (below).
4. ROAS alone does not decide your next move — per-channel revenue efficiency#
ROAS tells you whether you recovered ad spend, but where to put your next budget is decided by per-channel revenue efficiency (RPS).
ROAS has a weakness: it can only evaluate channels you spent on, and "the channel with the most revenue" is not necessarily the most efficient. This is where RPS (Revenue Per Session — revenue per visit) helps.
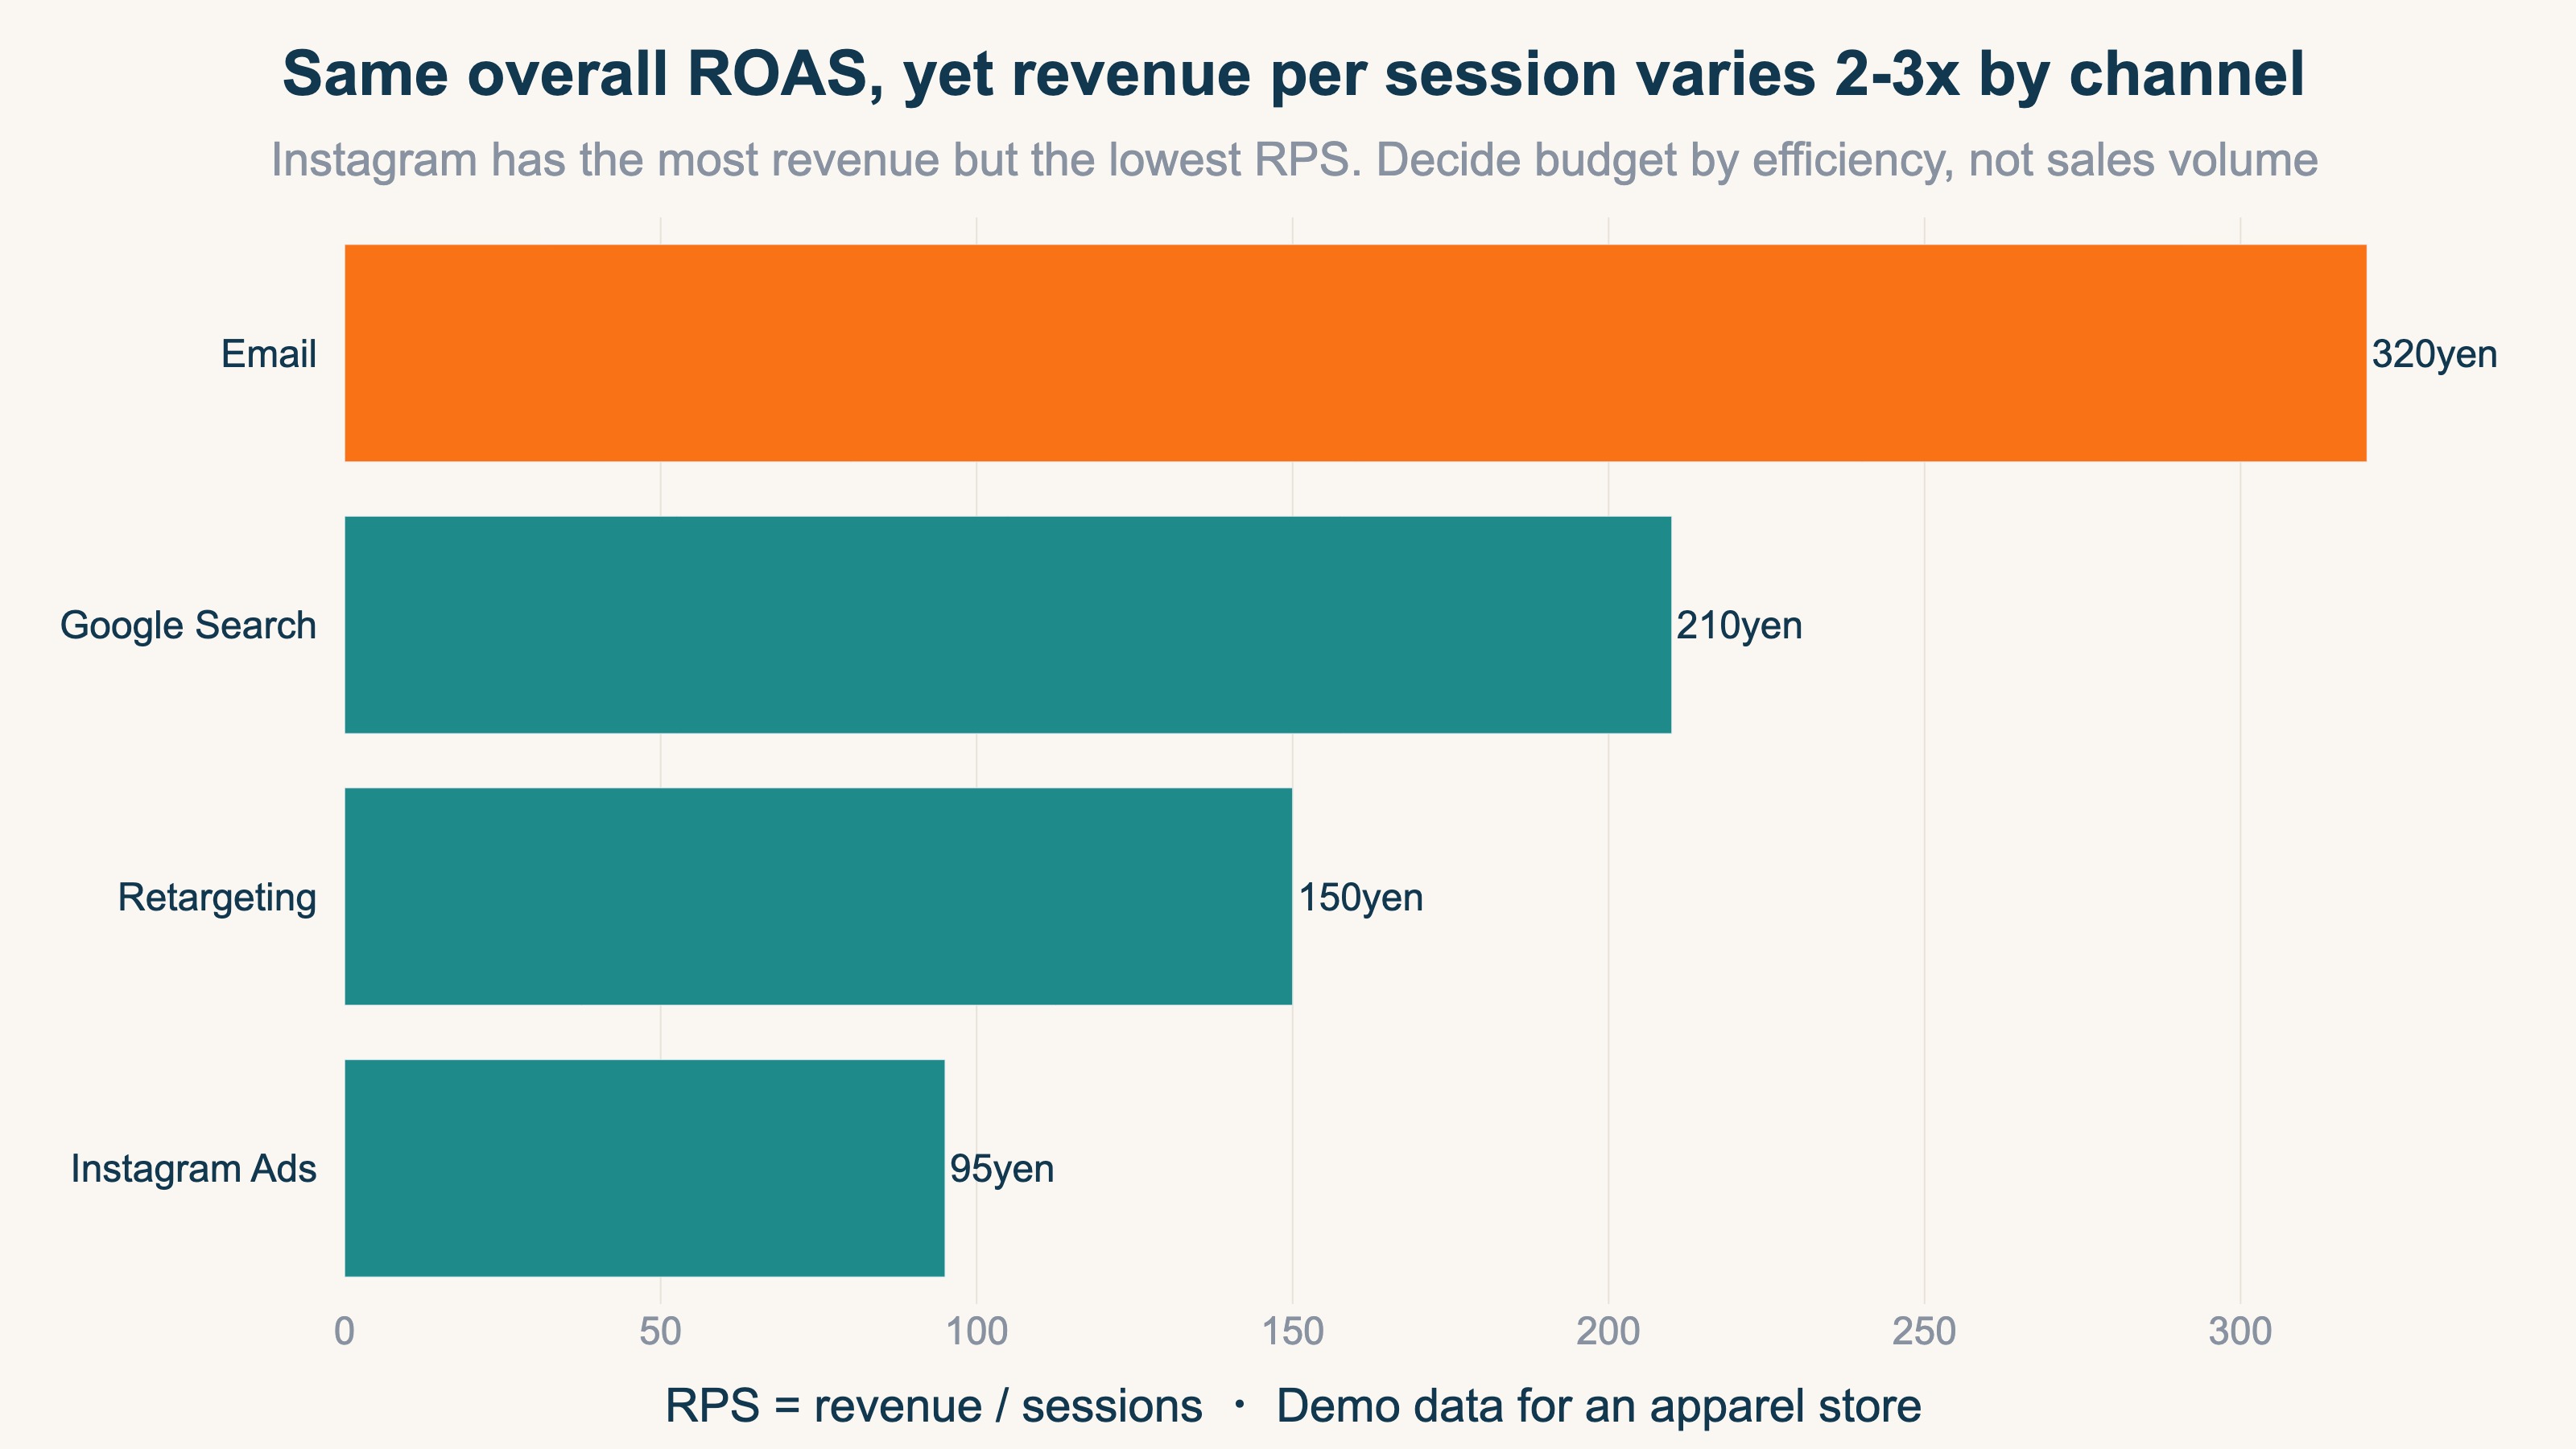
For example, even when overall ROAS is at the same level, splitting it by channel and looking at revenue per visit makes the efficiency gap clear.
| Channel | Revenue per session (RPS) | How it looks |
|---|---|---|
| Email newsletter | ¥320 | Low delivery cost; efficiency is highest |
| Google Search | ¥210 | Consistently high efficiency |
| Retargeting | ¥150 | Mid-tier |
| Instagram Ads | ¥95 | Largest revenue, but lowest per visit |
Instagram Ads often has the largest revenue, so looking at ROAS alone you tend to think "let's spend more." But per visit it is the lowest, meaning more budget buys more inefficient visits. The newsletter, conversely, has the highest revenue per visit yet is overlooked because its cost is low. Decide your next move on "efficiency per visit," not on "revenue volume" — that is the role of per-channel RPS.
RevenueScope's solution
Let us see "judge against your own break-even, then decide next by per-channel efficiency" on an actual screen. RevenueScope brings together, on a single screen by ad channel, the Revenue / AOV (average order value) / RPS (revenue per session) / CVR (purchase rate) from GA4 and your site's revenue data.
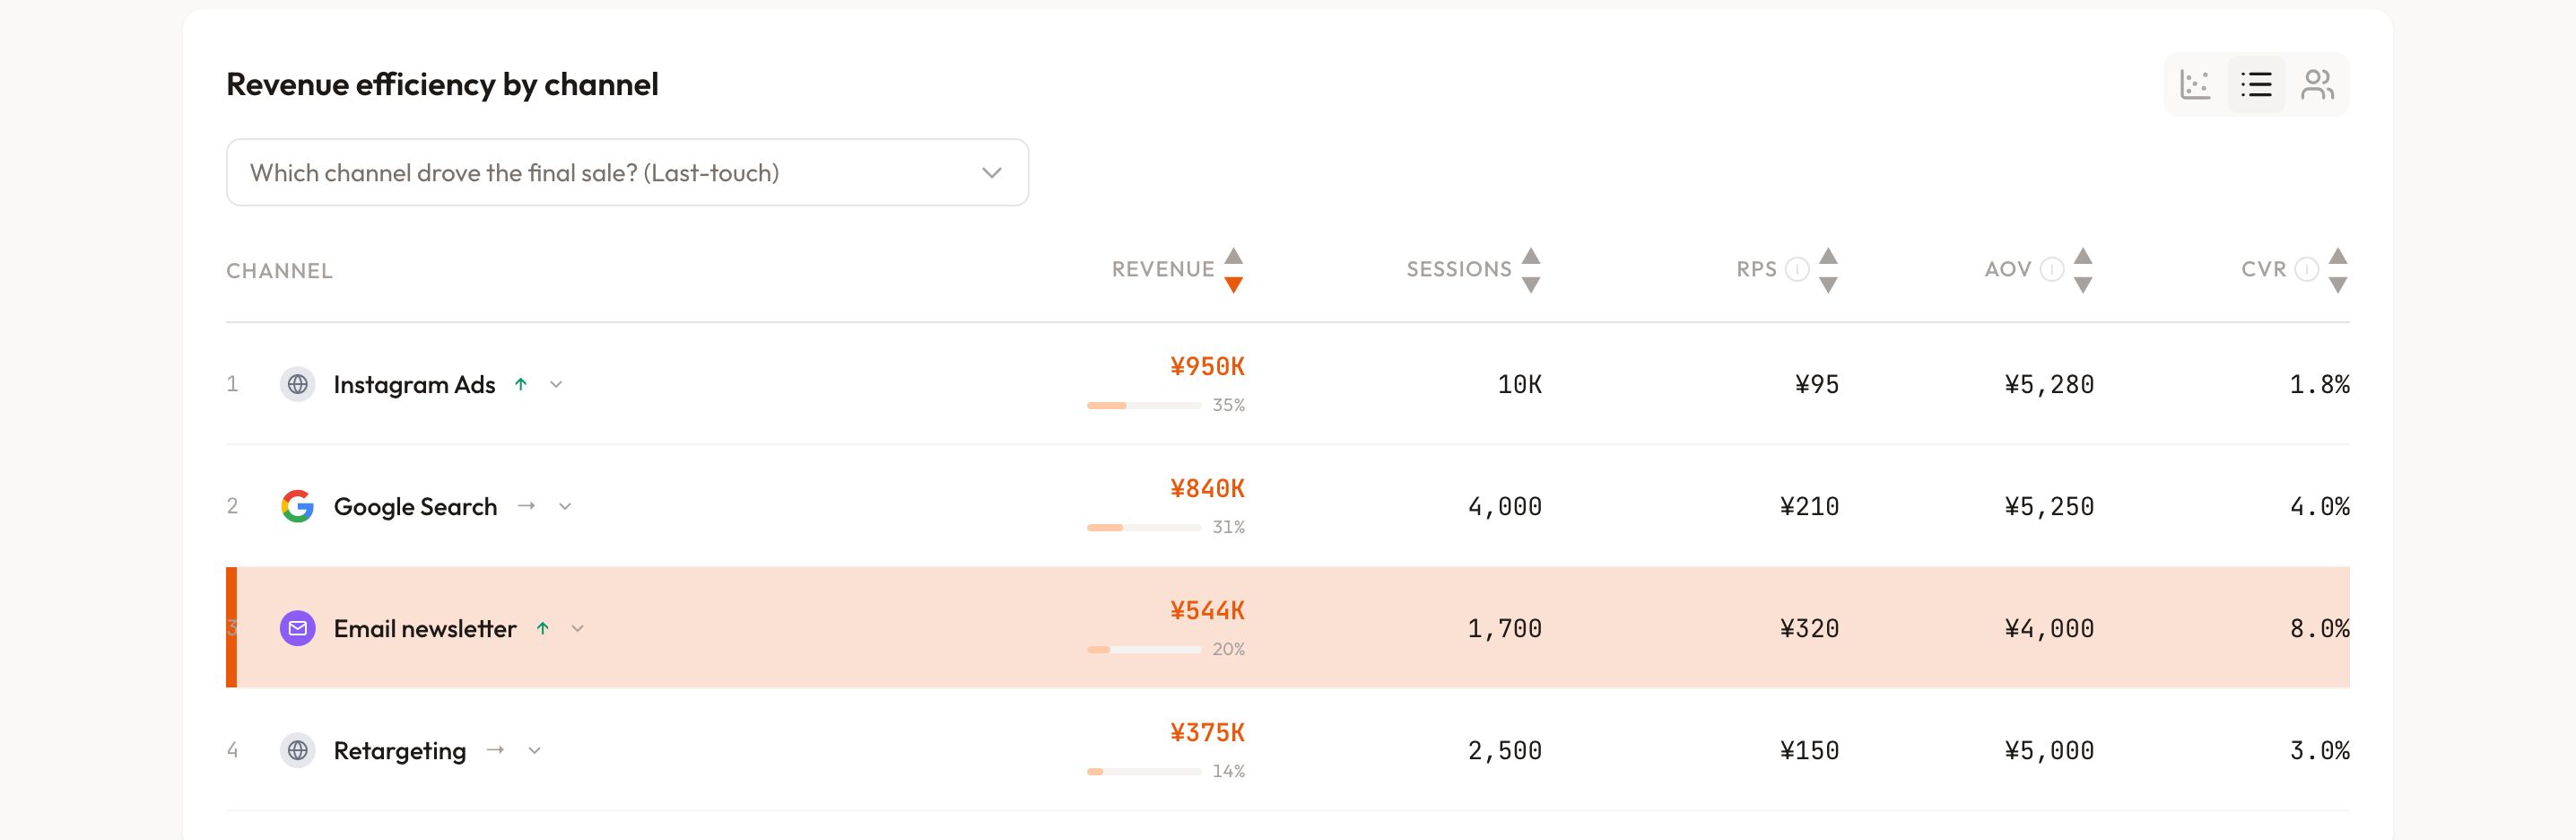
Reading this screen (demo data for an apparel store), two things stand out. First, a reversal: the newsletter's RPS is ¥320, the highest, while Instagram Ads has the largest revenue but the lowest RPS at ¥95. Second, Instagram also has a low conversion rate (CVR), meaning the visit quality itself is weak.
The next move is clear: pause the increase to Instagram, and shift the next budget to the top-efficiency newsletter (CRM) and the consistently strong Google Search. Where ROAS alone might push you to "grow the high-revenue Instagram," per-channel RPS corrects the call.
The thinking itself is not hard. What is heavy is doing this every time, lining it up across channels by hand. Each platform's console uses different definitions and mixes in duplicates. GA4 can show channel totals, but bringing duplicate-free RPS, AOV, and CVR together by channel on one screen becomes a manual rebuild. RevenueScope starts from duplicate-free, per-channel real revenue from its own tracking, so you can compare all of that on a single screen.
Note that RevenueScope calculates ROAS once ad spend is connected (read-only integration per channel, or manual entry). Without a spend connection, RevenueScope doesn't compute ROAS — rather than showing a misleading 0 or infinite value — and instead focuses on revenue, RPS, AOV, and CVR, visible with a single tag in 5 minutes. Connect ad spend and channel-level ROAS appears alongside the RPS comparison above.
FAQ#
Q. Is there a "correct" number for ROAS by industry?
A. There is no official ROAS statistic by industry. The ranges here are reference values averaged from operator know-how. The correct answer is not the industry average but your break-even ROAS (1 / gross margin).
Q. If my ROAS beats the industry average, am I safe?
A. No. A store with a low margin can be in the red even above the industry average. First derive your break-even ROAS and judge whether you exceed it.
Q. How do I use ROAS and RPS together?
A. ROAS tells you "did I recover ad spend," and RPS (revenue per visit) tells you "which channel's visits are efficient." Confirm profit with ROAS, then decide your next budget allocation with RPS. See how to compute RPS.
Conclusion#
The ROAS benchmarks by industry — apparel 300-400%, cosmetics 400-600%, food 250-350% — are only a starting point. The basis for judgment is not the industry average but the break-even ROAS derived from your own gross margin (1 / margin). And once you confirm profit, decide your "next move" with per-channel revenue per session (RPS), not ROAS. Rather than celebrating or worrying over the average, judge from your own numbers — that is the shortest path to spending your ad budget without waste.
See which ads actually drive revenue, at a glance
Free up to 5,000 sessions/month, AI analyst included. No credit card required. Up and running in 5 minutes.
References#
[1] Shopify "Return on Ad Spend: How To Calculate Your ROAS" 2026
[2] LocaliQ "Search Advertising Benchmarks" 2025
[3] Shopify "Average Order Value (AOV): Formula, Benchmarks and 7 Ways to Increase It" 2025
[4] Ministry of Economy, Trade and Industry (METI) "FY2024 E-Commerce Market Survey" 2025
[5] Baymard Institute "E-Commerce Cart & Checkout Usability Research" 2024