"OK, I've got the RPS formula. But is our RPS — actually — high or low compared to our industry?" After you explain what RPS (Revenue Per Session, the revenue earned per single visit) means, this is the question EC operators ask most. The feeling makes sense. Even if you learn your RPS is ¥120, unless you know whether that's the middle, the top, or the bottom of your industry, you can't decide "scale ads, or fix things first."
But the first thing this article wants to say is a slightly different view. The very approach of "feeling reassured or anxious by comparing against an industry average" is less useful for decisions than you'd think. Public industry-RPS data for Japan's EC market barely exists; what circulates is estimates converted from overseas indicators, and AOV and CVR are measured differently by every source. Compare against numbers built on uneven foundations and the conclusions wobble. What actually helps the decision isn't others' averages — it's how much RPS varies within your own business, channel by channel and new-vs-returning. This article honestly shows rough baselines (external estimates) for five industries, then rebuilds the view toward that.
Table of contents
Key takeaways#
- Judging whether your RPS is high or low by comparing it against an industry average rests on a weak foundation. RPS varies 2–10x across industries, but there's almost no public industry-RPS data for the Japanese market — what circulates is estimates from overseas indicators, with AOV and CVR measured inconsistently across sources. Compare against mismatched numbers and the conclusion wobbles.
- So the industry RPS figures in this article (external estimates) are only a reference for guessing "roughly where I might sit." They aren't material for a verdict.
- What actually works is looking inside your own business, not at others' averages. Compute RPS per entry point — search, email, social, ads — and per new-vs-returning, and revenue efficiency varies widely even within one company. That internal spread is exactly the material for deciding which channel to shift budget toward next.
1. Why "comparing against the industry average" alone misleads#
Comparing on an "overall-average RPS" that ignores industry is structurally misleading. There are three big reasons.
The first is the industry gap in AOV (the average revenue per order). A single electronics order reaching ¥30,000 is nothing unusual, but apparel D2C averages around ¥6,000 per item, and a SaaS B2B first-year contract runs ¥50,000–¥500,000. If AOV differs by 10x, RPS differs by 10x even at the same CVR (the share of visitors who buy). The second is the industry gap in that CVR. Food D2C runs 3–5% on a repeat-purchase model, electronics 0.5–1.5% with its long consideration cycle, and SaaS B2B 1–3% through lead generation — a 3–5x spread again. The third is the difference in the weight of a single session. SaaS is the long-haul type with repeat visits, apparel is the short-decision type settled in one go, and electronics is the multi-visit type routed through price-comparison sites. Since one session means something different per industry, an average that blends industries carries no meaning. The RPS formula itself is laid out in What RPS is and how to compute it.
So far this sounds like "then let's line industries up and compare." But the deeper problem is that even when you try to line them up, the very industry data you need is unreliable. Public industry-RPS benchmarks that a Japanese EC operator can use as-is barely exist. What circulates is overseas indicators converted into yen, and whether AOV is taken across all orders or own-EC only, and whether CVR is on an all-sessions basis or a product-page basis, isn't consistent across sources. Compare numbers measured in different ways and the "high or low" you get is unreliable.
In other words, comparison against an industry average works as a doorway for a rough guess, but decide budget allocation on it alone and it'll sweep your feet out. So what should you look at? First we honestly show the external baselines (Chapter 2), then we move the lead role of the decision to "your own internal spread" (Chapter 3).
2. Rough RPS baselines for five industries#
First, the external baselines for a rough guess. The table below is an estimation model that multiplies overseas public benchmarks by industry AOV × CVR — these are not measured values. Use them only to get a sense of roughly where you might sit.
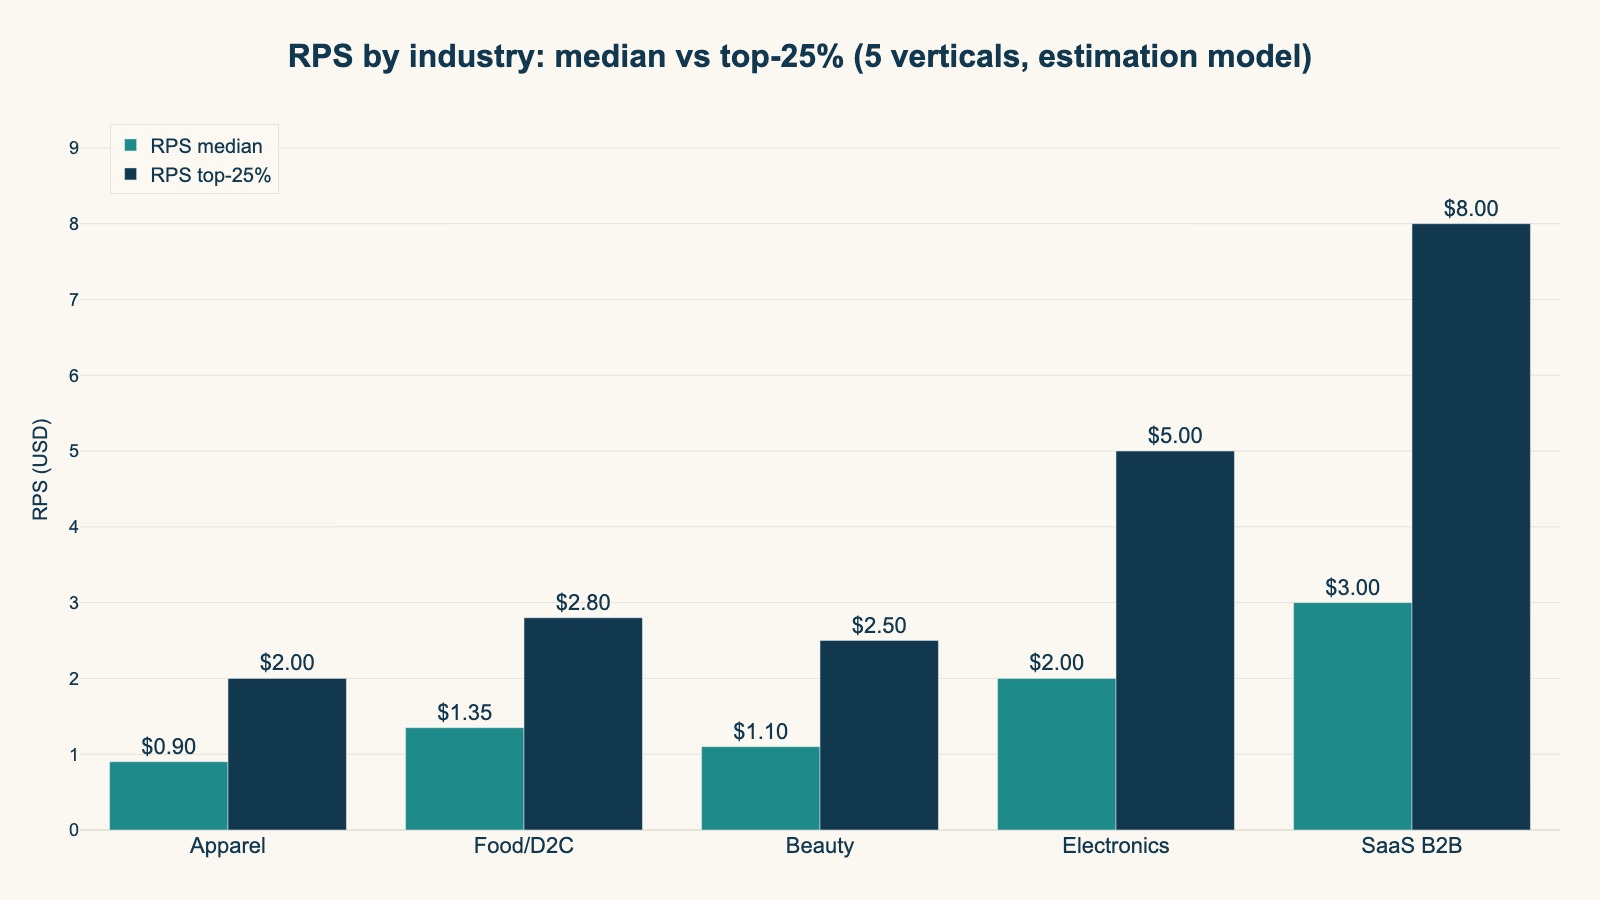
| Industry | AOV median (yen) | CVR median | RPS median (est.) | RPS top-25% (est.) |
|---|---|---|---|---|
| Apparel/Fashion | ¥6,000 | 1.5% | ¥90 | ¥200 |
| Food/D2C | ¥4,500 | 3.0% | ¥135 | ¥280 |
| Beauty/Cosmetics | ¥5,500 | 2.0% | ¥110 | ¥250 |
| Electronics/PC | ¥25,000 | 0.8% | ¥200 | ¥500 |
| SaaS B2B (year-1 ARR) | ¥50,000 | 0.6% | ¥300 | ¥800 |
⚠️ Every figure in this table is an estimation-model representative value for the industry. It's built from overseas public benchmarks (industry EC indicators) and Japan-market AOV × CVR ranges — not measured values. AOV is an own-EC (D2C domain) median estimate with marketplace revenue excluded; CVR is on an all-sessions basis. SaaS B2B is estimated from general industry indicators due to limited public sources and has an especially wide range. Verification against your own environment is assumed.
A quick sketch per industry. Apparel has low AOV and earns on traffic volume, so RPS is on the low side, but repeat-rate improvement gets you to the upper band. Food D2C runs on repeat purchase with high CVR, giving the highest RPS median in the group. Cosmetics stabilizes via subscription but carries first-purchase friction. Electronics is the high-AOV, low-CVR consideration type where one session weighs heavily. SaaS B2B is standardly read as a two-stage funnel from lead generation.
To repeat: even if you confirm here whether your RPS is above or below the median, that's only a starting point. If the AOV or CVR feeding the calculation is measured differently than yours, the very above/below verdict shakes. The next chapter moves the footing of the decision inside your own business.
3. Computing your own RPS and diagnosing position by your own internal spread#
This is the heart of the article. There are two things to do. Compute your overall RPS once. Then split it within your own business by channel and by new-vs-returning, and read the spread. The latter becomes the lead role of the decision.
Your overall RPS isn't hard. The idea is "revenue over a period ÷ sessions over the same period." As long as you've set up purchase tracking in GA4, monthly revenue and session counts read straight off the standard reports. A recent-28-day window is easy to work with since it absorbs day-of-week bias. Computing this once to grasp your rough level is enough; staring this single overall figure against an industry average every month won't lead to a move. When you want to separate the RPS-and-CVR relationship, see The difference between RPS and CVR.
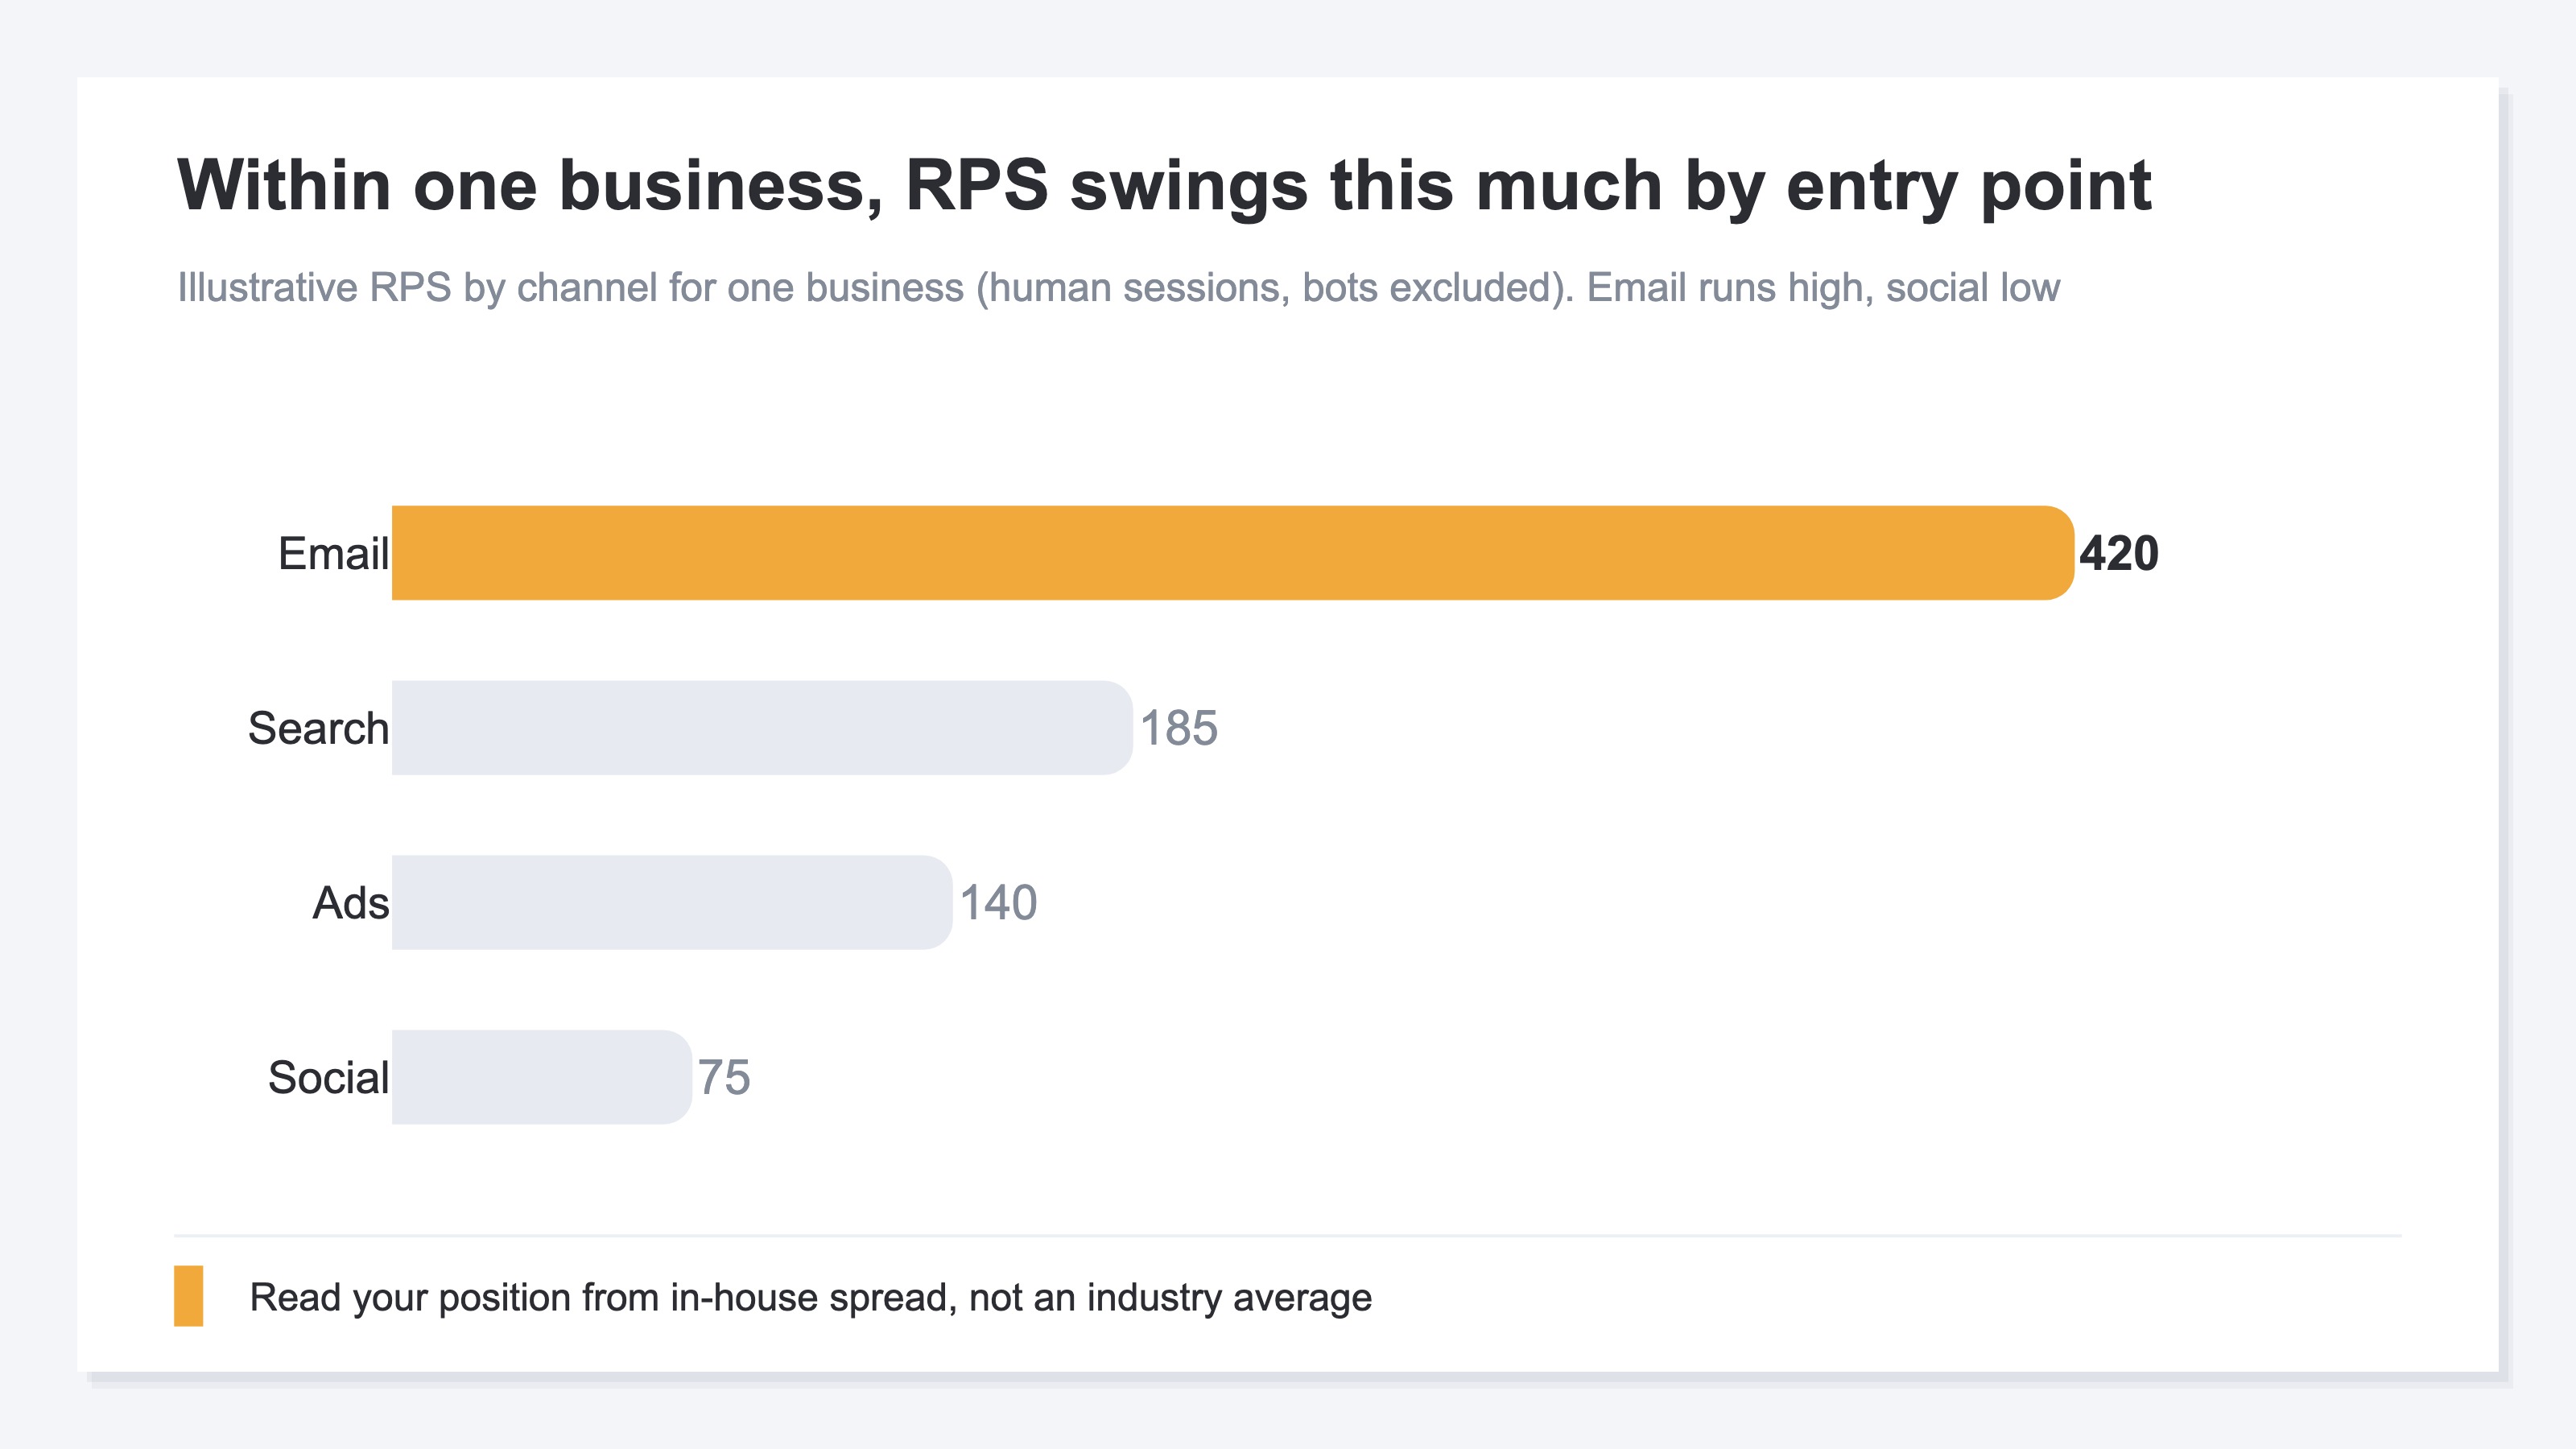
Here's the real point. Say your overall RPS is ¥150 — the breakdown is never uniform. Search (organic) RPS is high, social is low, email is higher still — even within one company, RPS varies widely by entry point. Splitting by new-vs-returning is the same: returning-customer RPS being 2–3x that of new customers happens routinely. Rather than comparing others' industry average against your single overall figure, reading this internal spread connects far more directly to your next move. Once you know your best-earning and worst-earning entry points, where to shift budget settles itself.
There's one easily-missed premise here: the existence of bots (automated access). Channel-level sessions tend to mix in machine access, and ads and social traffic especially take the hit. Keep bots in the denominator and RPS looks lower than it really is, throwing off your read of which entry points are good. So compute the internal spread on human sessions only, with bots excluded. That's the premise. And when you want to track period-over-period change carefully, it's sounder to view it by page or by keyword rather than by channel (channel-level period-over-period rests on a thin foundation and doesn't suit firm verdicts).
The idea itself isn't hard. What's hard is keeping this up every month — tallying it by hand, per entry point and per new-vs-returning, with bots excluded. Traffic data, order data, and revenue data sit in separate places, and just matching them and re-merging them into one screen drains you before you reach the actual decision. A simple idea that gets heavier the longer you keep it up.
4. Below average / above average — the next move for each#
Once your internal spread is visible, the next move splits into two cases.
If your overall RPS looks to be below the industry baseline, first suspect the contents of the inefficient entry points. The work is separating whether to lift CVR or lift AOV. CVR moves more easily via checkout simplification and cart-abandonment measures; AOV moves via free-shipping threshold tweaks and cross-sell. But raising the free-shipping threshold can lose people who fell just short and drop CVR, and AOV ↑ × CVR ↓ can end up dropping RPS — so always watch the pair together. Concrete tactics for moving AOV are laid out in How to raise AOV.
If you look to be above the baseline, it's the budget-scaling phase. What works here is the internal spread from Chapter 3. Even with high overall RPS, it mixes earning and non-earning entry points. Shift budget toward the high-RPS entry points, and decide whether to improve, shrink, or exit the low ones. This is the judgment that only your own data yields — one you'd never reach by staring at others' averages. When you want several metrics on one screen, Designing a revenue dashboard is a useful reference.
One more thing worth adding: RPS alone doesn't complete a budget call. RPS measures acquisition efficiency (revenue per single visit), but to factor in ad-spend recovery, pair it with ROAS (revenue recovered per yen of ad spend).
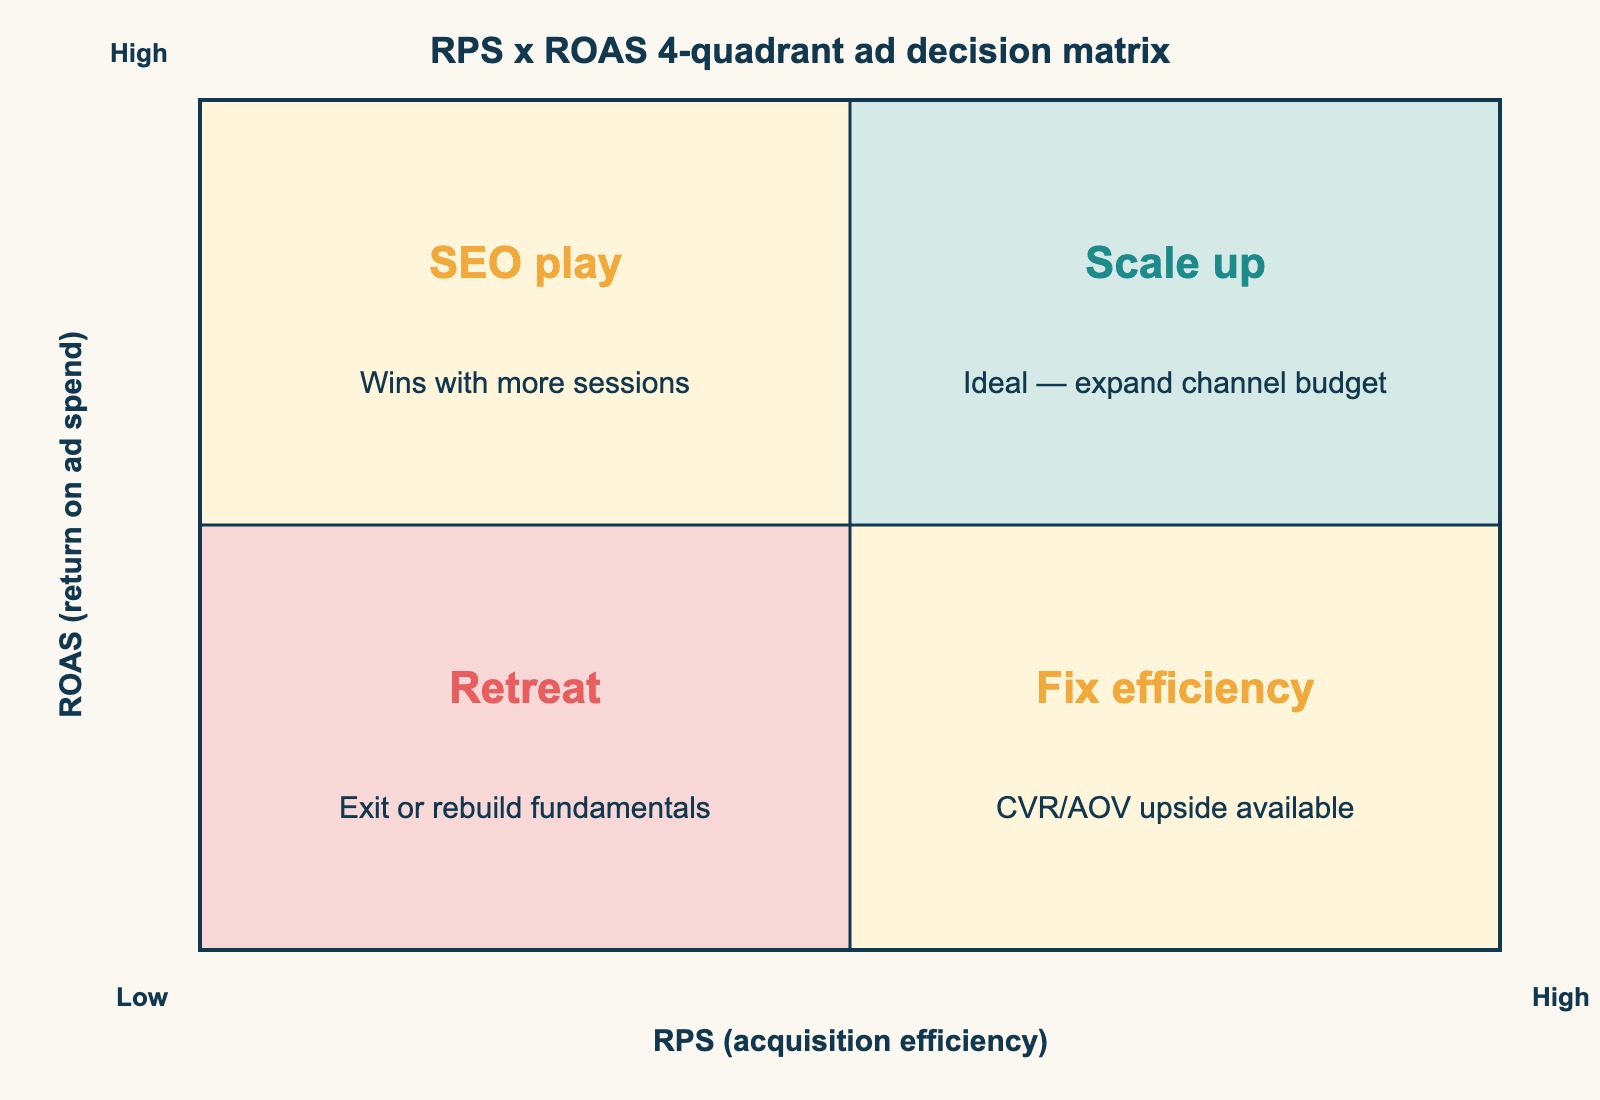
An entry point with high RPS and high ROAS is a scale call; high RPS but low ROAS has room to grow by adding traffic; low RPS but high ROAS has room to move big via CVR/AOV improvement; both low means rethink or exit. Only by reading on two axes does budget-allocation precision rise. The ROAS formula and baselines are covered in The complete ROAS guide.
RevenueScope's solution
Trace the view this far and you keep hitting the same wall. You know what helps the decision is your internal spread — RPS per entry point and per new-vs-returning, read with bots excluded — yet the numbers for it are scattered across several places, and they don't surface unless you re-merge them every month. GA4 is built around the visit as the starting point, so re-arranging RPS by traffic source onto one screen by hand each month is, frankly, heavy work.
RevenueScope consolidates those scattered numbers onto one screen on a revenue basis, returning channel-level and new-vs-returning RPS computed on human sessions only, with bots excluded (display uses demo data).
| What you ask RS | What comes back by default |
|---|---|
| Channel-level RPS | Search ¥185 / Email ¥420 / Social ¥75 / Ads ¥140 (after bot exclusion) |
| New vs returning RPS | New ¥110 / Returning ¥260 |
| Human session count after bot exclusion | 13,200 of 15,300 total, with 2,100 bots removed |
The most telling read on this screen is the gap that never shows in the single overall-RPS figure. Email has high RPS but few sessions; social has many sessions but low RPS; returning customers earn more than 2x new ones. From here the next move comes into view — lean toward email and returning-customer plays, and rework the contents of social. Compare others' industry average against your overall figure one at a time and you'd never notice first.
Let's be clear about one thing. What RevenueScope outputs is revenue, AOV (average order value), CVR (conversion rate), and RPS (revenue per session), broken down by channel, by new-vs-returning, by page, and so on. Channels come back as RPS, and AOV breaks down at the campaign level. And RevenueScope does not output cross-industry benchmarks. It's a tool that returns the real data of your one site; the kind of industry baseline in Chapter 2 belongs to the world of external estimates. Profit after cost and inventory are also out of scope. It assembles the material, but the final call on where and how much to shift is yours.
FAQ#
Q. My RPS is below the industry average — does that mean I should fix it?
A. Not necessarily. The industry RPS here is an estimation model from external public data, and the way AOV and CVR are measured won't always match yours. A "low" read against a mismatched foundation is hard to rely on. First, look inside your own business. Compute RPS by channel and by new-vs-returning, and it's common to find that even with a low overall figure, just one entry point is dragging it down. What you fix isn't "the overall" — it's that entry point.
Q. When computing channel-level RPS, what should I watch for?
A. Excluding bots (automated access). Channel-level sessions tend to mix in machine access, and the effect shows especially via ads and social. Keep bots in and the session denominator swells, RPS looks lower than reality, and your read of which entry points are good goes wrong. Compute on human sessions only. And if you're tracking change period-over-period, the foundation is firmer by page or keyword than by channel.
Q. If RPS is high, can I just increase budget into that channel?
A. RPS alone can't decide it. RPS measures acquisition efficiency, but to factor in ad-spend recovery, pair it with ROAS. An entry point with high RPS and high ROAS is a scale call; high RPS but low ROAS has room to grow by adding traffic — only by reading on two axes does budget-allocation precision rise.
Summary#
Judging whether your RPS is high or low by comparing against an industry average works as a doorway, but decide budget on it alone and it'll sweep your feet out. There's almost no public industry-RPS data for the Japanese market — what circulates is estimates from overseas indicators, with AOV and CVR measured inconsistently. Treat this article's five-industry baselines, too, only as a reference for a rough guess.
What actually works is looking inside your own business, not at others' averages. Compute RPS per entry point — search, email, social, ads — and per new-vs-returning, with bots excluded. Revenue efficiency varies widely even within one company, and that spread is exactly what tells you where to shift budget next. Start with the last month: rather than computing a single overall RPS, split your entry points into three or four and compare them side by side. Once that's visible, the RPS that had you swaying over others' averages turns into grounds for moving your own budget.
See which ads actually drive revenue, at a glance
Free up to 5,000 sessions/month, AI analyst included. No credit card required. Up and running in 5 minutes.
References#
- [1] Ministry of Economy, Trade and Industry (METI) "FY2024 E-Commerce Market Survey" (2025)
- [2] Baymard Institute "E-Commerce Cart & Checkout Usability Research" (2024)
The industry RPS figures in this article (Chapter 2) are an estimation model multiplying overseas public EC industry benchmarks (industry indicators published by Yotpo / IRP Commerce / Dynamic Yield and others) by Japan-market industry AOV × CVR ranges. Because each source's fit to the Japanese market is unverified, we present source names only and do not use individual figures for firm verdicts. SaaS B2B is estimated from general industry indicators due to limited public sources. All assume verification against your own environment.