Pinning down "what ROAS is" once, properly, makes ad-operations decisions a notch clearer. But ROAS isn't a metric where "learn the definition and the formula, and you're done." Getting a number out of revenue ÷ ad spend is quick—yet whether that number connects directly to the next decision, "where to move budget next month," is a separate gap entirely.
This article first lays out "what ROAS is" from an EC operator's practical view. We cover the definition end to end: the formula, how it differs from ROI and CPA, industry benchmarks, and how to calculate breakeven ROAS. Then we walk through why hand-calculating ROAS alone isn't enough for budget allocation decisions—average ROAS hides bleeding channels, channels without ads can't be measured by ROAS and need RPS (revenue efficiency), and the numbers distort unless they're bot-excluded—and finally, how to see channel-by-channel measured ROAS and revenue efficiency on a single screen to drive budget allocation.
Contents
- What ROAS is | the basic definition of return on ad spend
- The ROAS formula | the equation and worked examples
- ROAS vs ROI | revenue-based vs profit-based
- ROAS vs CPA | money-based vs unit-based
- ROAS benchmarks | wide variance by vertical
- ROAS 100% is not breakeven | derive breakeven ROAS
- Hand-calculating ROAS isn't enough for budget decisions | three structural gaps
- Turning ROAS into a budget allocation decision | channel-by-channel × RPS
- How RevenueScope helps
- FAQ
What this article covers#
- ROAS (Return On Advertising Spend) = ad-driven revenue ÷ ad spend × 100%. It's the standard KPI for how many yen (or dollars) of revenue each unit of ad spend generated. First, pin down the definition and formula precisely.
- ROAS 100% is not breakeven. The real bar is the gross-margin-aware breakeven ROAS (= 1 ÷ gross margin × 100%). At 30% margin, breakeven ROAS is 333%; at 50% margin, it's 200%.
- But hand-calculating ROAS, on its own, isn't enough for budget allocation decisions. The overall average ROAS hides bleeding channels, channels without ads can't be measured by ROAS, and bot-mixed numbers distort. Only when you line up measured ROAS and revenue efficiency (RPS) channel by channel on one screen can you decide "where to pull from and where to move toward."
1. What ROAS is | the basic definition of return on ad spend#
Bottom line: ROAS is an ad-investment efficiency metric that measures, in a single number, "how much revenue each unit of ad spend generated."
ROAS (Return On Advertising Spend) is the recovery metric that measures "how much revenue each unit of ad spend generated." It's one of the most basic KPIs, shown by default in the reporting views of Google Ads, Meta Ads, TikTok Ads, and other ad platforms.
ROAS's job is to express "ad-investment efficiency" as a single number. Because it shows how many times over you recovered ad spend in revenue, it's used as the starting point for comparing campaigns, weighing budget allocation, and making stop decisions.
But ROAS is a "revenue-based" metric, not a "profit-based" one. As we'll see in detail later, this is the single biggest caveat in interpreting ROAS.
2. The ROAS formula | the equation and worked examples#
Bottom line: ROAS = ad-driven revenue ÷ ad spend × 100%. 100% is the state where "ad spend is exactly recovered in revenue"—it does not mean profit.
2.1 The ROAS formula#
ROAS = ad-driven revenue ÷ ad spend × 100%
- ROAS 100% = ad spend recovered in revenue (gross margin is a separate question)
- ROAS 200% = generated 2× the ad spend in revenue
- ROAS 500% = generated 5× the ad spend in revenue
2.2 Worked examples#
Example 1: simple case
- Ad spend ¥100,000, ad-driven revenue ¥300,000
- ROAS = 300,000 ÷ 100,000 × 100% = 300%
Example 2: loss case
- Ad spend ¥500,000, ad-driven revenue ¥400,000
- ROAS = 400,000 ÷ 500,000 × 100% = 80% (didn't recover the ad spend in revenue)
Example 3: a margin-aware decision (see "breakeven ROAS" below)
- Ad spend ¥100,000, revenue ¥300,000, gross margin 30%
- Gross profit = 300,000 × 30% = ¥90,000
- Ad spend ¥100,000 − gross profit ¥90,000 = ¥10,000 loss
- → ROAS 300% is still a loss
3. ROAS vs ROI | revenue-based vs profit-based#
Bottom line: ROAS is revenue-based, ROI is profit-based. ROAS can be high while ROI goes negative—and that happens often.
ROAS and ROI are easily conflated, but the vantage point they look from is fundamentally different.
| Metric | Formula | Lens |
|---|---|---|
| ROAS | Ad-driven revenue ÷ ad spend × 100% | Revenue-based (no margin awareness) |
| ROI | (Profit − Investment) ÷ Investment × 100% | Profit-based (reflects actual earnings) |
ROAS being high while ROI goes negative is a frequent case. The numerator of ROAS, "ad-driven revenue," still has cost of goods, shipping, and payment fees baked in—so it's a different thing from the final profit left after stripping those out.
In practice, the common split is ROAS for short cycles (weekly / monthly), ROI for long cycles (quarterly / annual). Using both is also common: ROAS-primary for products with stable margins, ROI for products with large margin swings.
4. ROAS vs CPA | money-based vs unit-based#
Bottom line: ROAS is "how much revenue came from one unit of ad spend"; CPA is "how much you spent for one conversion." Different lenses, so use both.
ROAS and CPA are also used together.
| Metric | Formula | Unit |
|---|---|---|
| ROAS | Ad-driven revenue ÷ ad spend × 100% | Money-based |
| CPA | Ad spend ÷ acquired conversions | Unit-based |
The priority depends on product characteristics.
- High-price products (electronics, SaaS, durables, etc.): ROAS-primary
- Low-price products (convenience goods, small items, low-ticket D2C, etc.): CPA-primary
- Most EC: use both (ROAS for revenue efficiency, CPA for acquisition efficiency)
CPA is "how much you spent to get one conversion"; ROAS is "how much revenue came from one unit of ad spend." Because the lenses differ, looking at both sharpens the resolution of your ad operations.
5. ROAS benchmarks | wide variance by vertical#
Bottom line: Industry-average ROAS is often quoted at 300-500%, but the spread by vertical, product, and LTV strategy is wide—treat it only as a rough reference.
Industry-average ROAS is often quoted at a rough 300-500%, but the spread by vertical, product, and LTV strategy is wide. Below are indicative ranges by vertical (industry-typical values; verify against your own environment).
| Vertical | Indicative ROAS |
|---|---|
| Apparel | 300-500% |
| Food / D2C | 400-600% (high CAC tolerance from repeat purchase) |
| Cosmetics | 300-500% |
| Electronics | 200-400% (high price) |
| SaaS (B2B) | 200-400% (LTV-recovery lens) |
Note: Industry-average ROAS is sparsely published. Dentsu's "2024 Advertising Expenditures in Japan" (February 2025) [1] tracks macro ad-spend trends but does not publish a single ROAS figure by vertical; vertical-level ad investment has to be triangulated from sources like METI's "Survey on E-commerce Markets" (FY2024, August 2025) [3] for EC penetration and market size, and JADMA's "43rd Direct-Marketing Industry Survey" (November 2024) [2] for direct-marketing financial indicators. The above are general references for EC operators; measure your own industry-average ROAS from your ad platform's monthly averages and peer disclosures.
6. ROAS 100% is not breakeven | derive breakeven ROAS#
Bottom line: ROAS 100% is merely the state where "ad spend is recovered in revenue"—a loss for most products. The black line is set by the breakeven ROAS derived from your gross margin.
ROAS 100% means "ad spend recovered in revenue," but it doesn't necessarily mean profit (in most cases it's actually a loss).
The reason is simple.
- Revenue includes cost of goods (procurement, manufacturing)
- Revenue includes shipping and payment processor fees
- ROAS 100% = revenue roughly equal to ad spend = gross profit only equal to the margin rate
6.1 Concrete example: 30% gross margin, ¥100,000 ad spend, ¥100,000 revenue (ROAS 100%)#
- Gross profit = 100,000 × 30% = ¥30,000
- Ad spend = ¥100,000
- Net result: ¥70,000 loss
"ROAS 100% is breakeven" holds only when gross margin is 100% (= the entire revenue is gross profit). No such product exists in real EC. In other words, using ROAS 100% as the bar for profitability is the wrong decision axis for essentially every EC operator.
6.2 Derive breakeven ROAS from gross margin#
To judge "above what ROAS am I profitable," derive the breakeven ROAS from your gross margin.
Breakeven ROAS = 1 ÷ gross margin × 100%
| Gross margin | Breakeven ROAS | Example: ¥100,000 ad spend, required revenue |
|---|---|---|
| 10% | 1,000% | ¥1,000,000 |
| 20% | 500% | ¥500,000 |
| 30% | 333% | ¥330,000 |
| 40% | 250% | ¥250,000 |
| 50% | 200% | ¥200,000 |
| 60% | 167% | ¥170,000 |
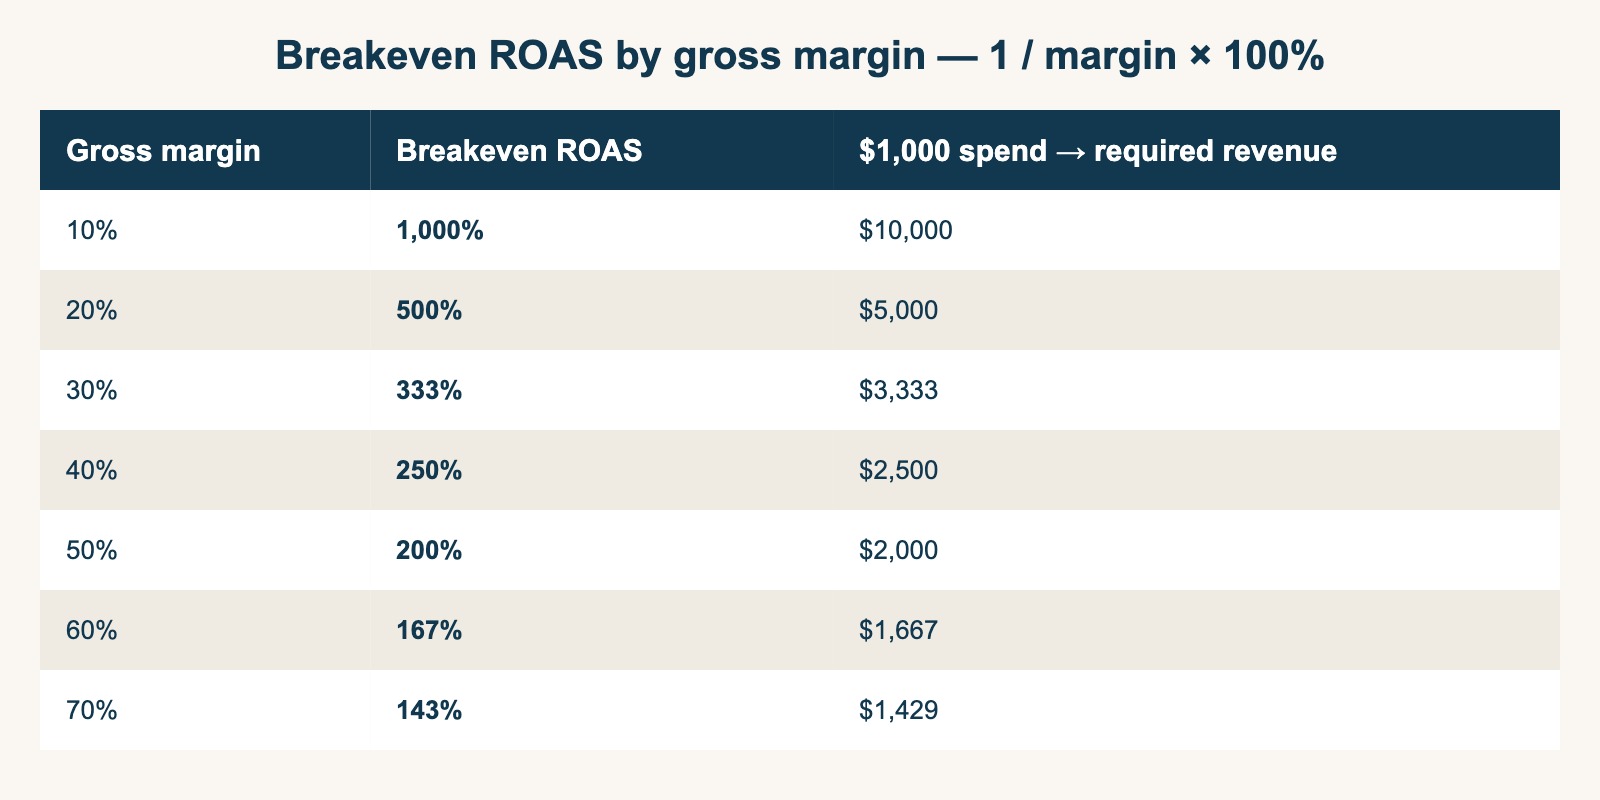
The lower the margin, the dramatically higher the required ROAS. For a 10%-margin product, "ROAS 500%" is a loss (1,000% needed); for a 50%-margin product, "ROAS 250%" is profitable (200% needed).
Operating ads without knowing your own breakeven ROAS is the same as setting prices without knowing your breakeven point. Rather than chasing the industry-average ROAS, holding a target ROAS derived from your own gross margin is the starting point for running an ad budget in the black.
Note: Gross margins by vertical vary materially by product, sales channel, and your own sourcing terms. Recalculate your own breakeven ROAS with your own gross margin (= 1 ÷ your margin × 100%).
Up to here, "what ROAS is" and "where the black line is" are definitional matters you can work out with pen and paper. The problem comes next—how to use this number for next month's budget decision—and that's where the structural gaps appear.
7. Hand-calculating ROAS isn't enough for budget decisions | three structural gaps#
Bottom line: Even with the ROAS definition and breakeven ROAS in hand, you don't reach a budget allocation decision. There are three structural gaps: the average hides bleeding channels, channels without ads can't be measured, and bot-mixed numbers distort.
The ROAS calculation itself can be done on a calculator. Breakeven ROAS can be derived as long as you know your gross margin. Even so, the formula alone doesn't get you to the decision of "which channel to pull budget from next month and where to move it." The reason isn't effort or time-saving—it's that hand-calculating ROAS rests on three structural gaps.
7.1 Average ROAS hides bleeding channels#
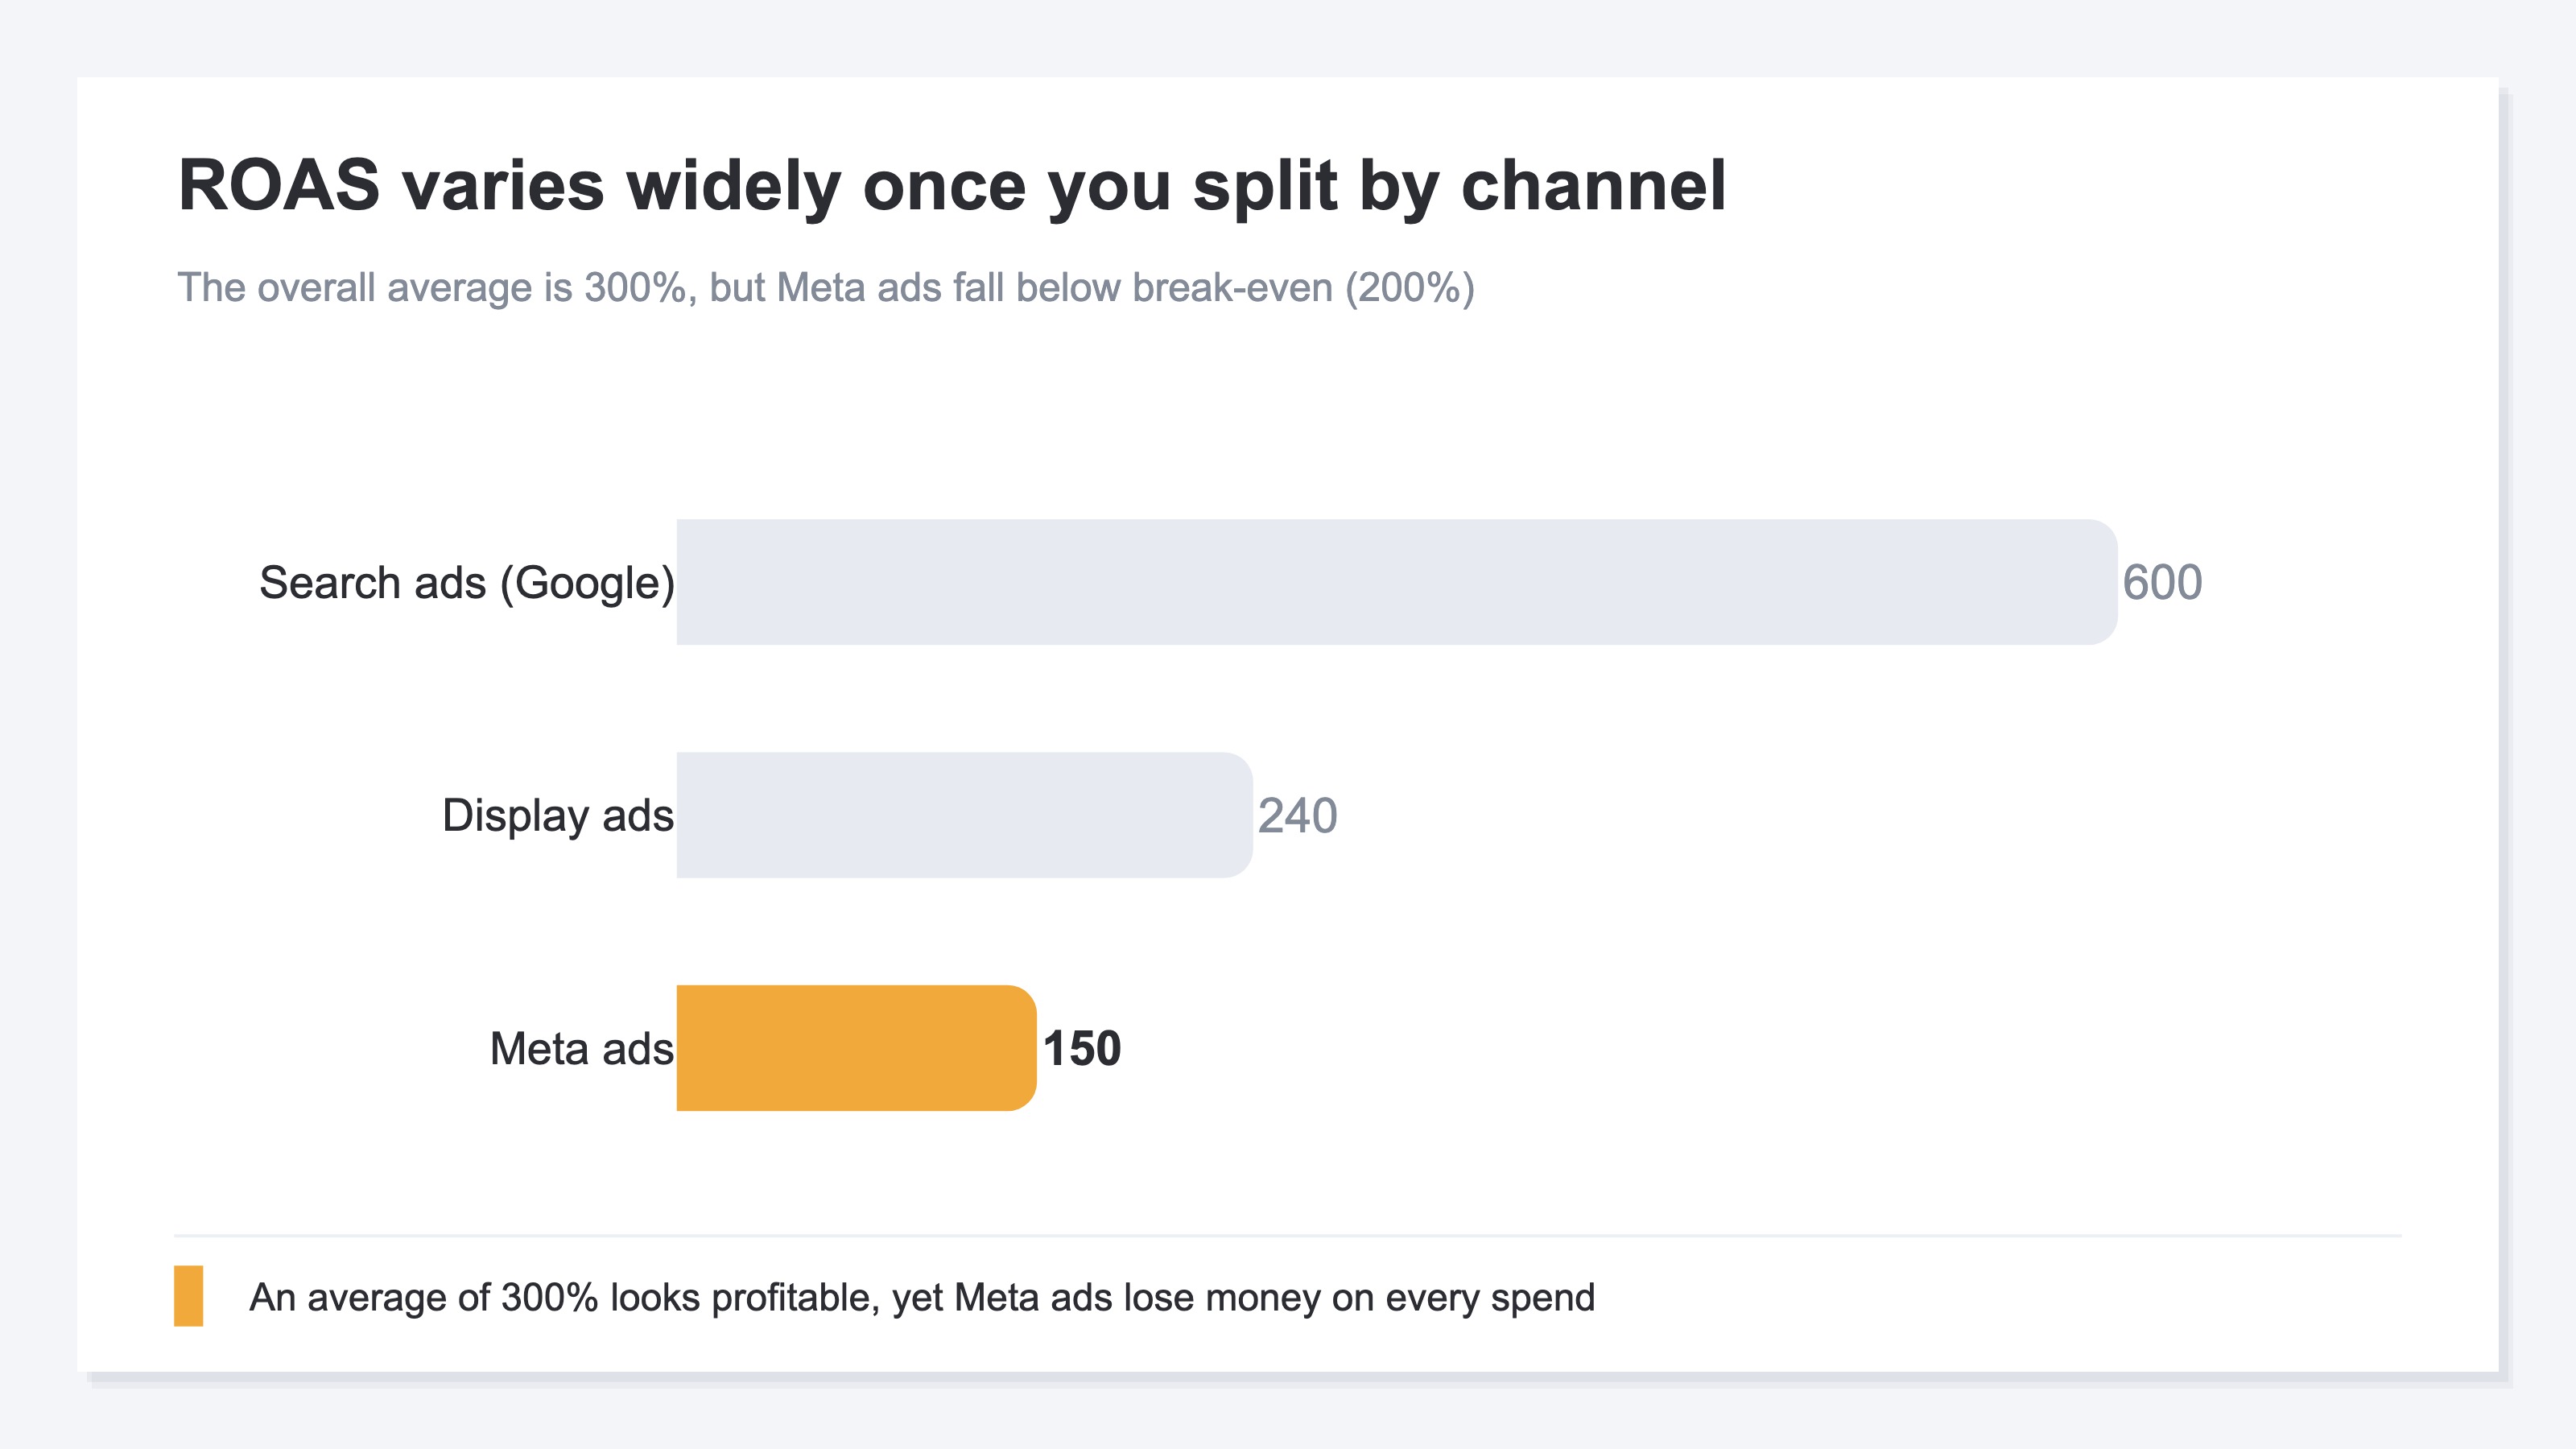
The ROAS you can get on a calculator is usually a "lumped-together" average for the whole. But the average lets earning channels cover up bleeding ones.
For example, even if the overall ROAS is 300%, opening the breakdown often shows search ads earning big at 600% while Meta ads sit at just 150%. If the breakeven ROAS is 200%, Meta bleeds the more you spend. Yet because the overall average reads 300%, it's judged "profitable, no problem," and budget keeps flowing to the bleeding channel. Budget decisions need channel-by-channel ROAS, but a single average erases where you earn and where you melt money.
The sister piece Why average ROAS can't decide your ad budget covers this average trap in detail.
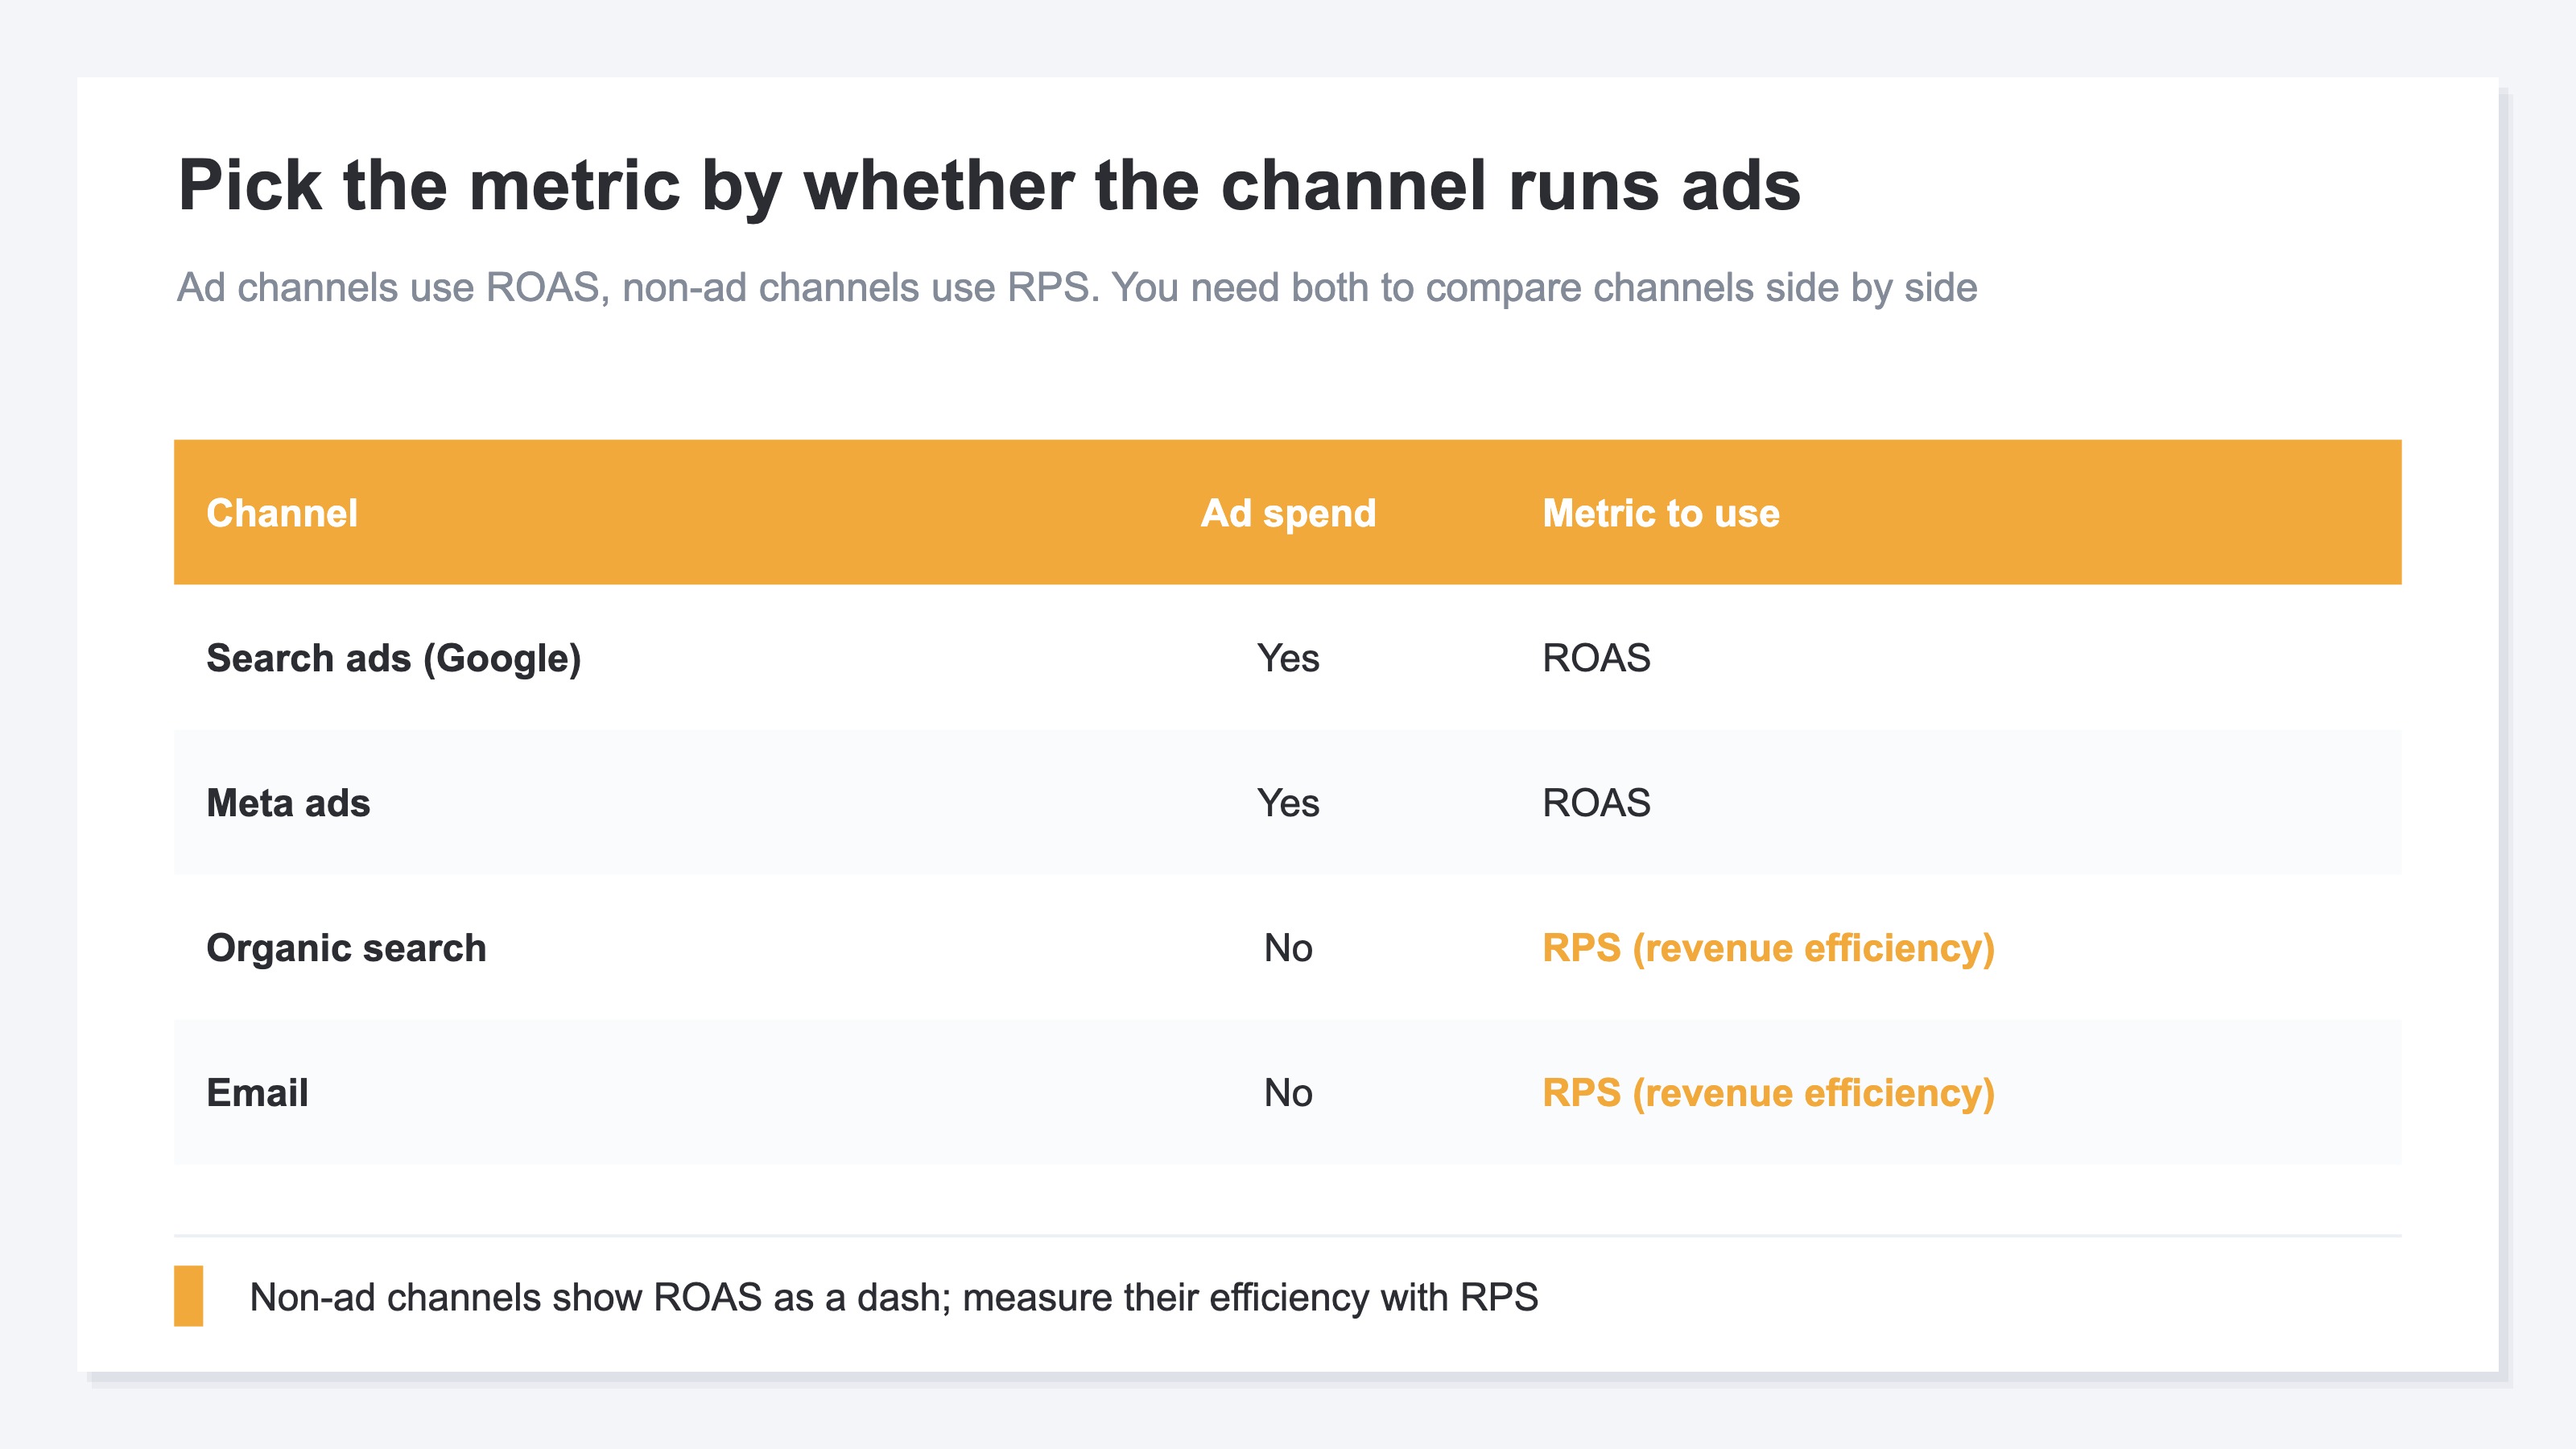
7.2 Channels without ads can't be measured by ROAS#
Because ROAS is "ad-driven revenue ÷ ad spend," it can't be computed for channels with no ad spend in the denominator—organic search traffic or email. Yet for many EC stores these are the main revenue drivers. Watch only ROAS, and the main channels you don't run ads on fall outside your judgment. To measure these on the same scale, you need RPS (revenue efficiency, revenue per session), covered below.
7.3 Numbers distort unless they're bot-excluded#
The basis for both the numerator and denominator of ROAS is the sessions and revenue from analytics, and the ad spend from ad platforms. Of these, the session side can have bots (automated access) mixed in, and measuring efficiency with bot-mixed sessions makes things look better (or worse) than reality. If you're going to use channel-by-channel efficiency for budget decisions, you have to align on bot-excluded actual numbers.
In other words, even with the ROAS definition pinned down correctly, using it for budget allocation decisions requires three things—"channel-by-channel," "a scale that can also measure channels without ads," and "bot-excluded actual numbers"—and these sit outside the formula.
8. Turning ROAS into a budget allocation decision | channel-by-channel × RPS#
Bottom line: The key to turning ROAS into a budget decision is to compare channel-by-channel ROAS against the RPS (revenue efficiency) that can be measured regardless of whether ads are involved.
What makes up for ROAS's limits on its own is RPS (Revenue Per Session) = revenue ÷ sessions. RPS shows "how much revenue one visit generated on average," so it lets you compare every channel on the same scale, regardless of whether ads are involved.
| Metric | Lens | Limit |
|---|---|---|
| ROAS | Revenue efficiency relative to ad spend | Can't measure channels without ads / doesn't show scale |
| RPS | Revenue efficiency relative to sessions | Doesn't show ad spend (investment efficiency) |
Combine both axes, and channel decisions sort into four states.
| State | Decision |
|---|---|
| High ROAS × High RPS | Winning channel → scale budget |
| High ROAS × Low RPS | Room to expand scale → session-growth tactics (audience expansion, wider bidding) |
| Low ROAS × High RPS | Ad spend is too high → re-optimize bidding / refresh creative |
| Low ROAS × Low RPS | Channel mismatch → stop or fundamentally rebuild |
Measure "ad-investment efficiency" with ROAS and "site-side revenue efficiency" with RPS. Only when you line up both axes channel by channel can you nimbly decide "where to pull budget from and where to move it." For the definition and use of RPS itself, see the separate article The complete guide to RPS (Revenue Per Session).
The problem is that actually assembling this into a single table is a chore. Ad spend lives in each ad platform's dashboard, while revenue and sessions live in analytics (GA4 and the like)—scattered across different places. On top of that, GA4 doesn't take in ad spend itself, so channel-by-channel ROAS doesn't show up in GA4's standard reports. Every month you gather numbers from screen after screen, align them on bot-excluded actual numbers, and rebuild them by hand into one table—and that work stands in your way before you reach the decision.
RevenueScope — how it helps
Bottom line: RevenueScope consolidates scattered ad spend, revenue, and sessions onto a single screen and presents measured ROAS and revenue efficiency (RPS) channel by channel as the material for budget allocation decisions.
Even once you understand both the ROAS definition and breakeven ROAS, the last thing you hit is the same wall: "I want to use channel-by-channel measured ROAS and revenue efficiency for budget decisions, but the numbers for that are scattered across multiple screens, and I can't see them unless I re-compile them every month."
RevenueScope consolidates those scattered numbers onto a single screen. It matches each ad platform's ad spend (read-only Google Ads integration, or manual entry) against the site's revenue and sessions on bot-excluded actual numbers, and displays measured ROAS, revenue efficiency (RPS), and revenue channel by channel (figures are demo data).
What you get back when you ask an AI assistant via MCP#
| Channel | Ad spend | Revenue | ROAS | RPS (revenue efficiency) |
|---|---|---|---|---|
| Search (organic) | — | ¥320,000 | — | ¥128 |
| Search ads (Google) | ¥50,000 | ¥300,000 | 600% | ¥100 |
| Ads (Meta) | ¥160,000 | ¥240,000 | 150% | ¥60 |
| — | ¥180,000 | — | ¥225 |
Seen on a single screen, what the overall average hid surfaces at once. Meta ads, which consume the most ad spend, have a ROAS of 150%. If the breakeven ROAS is 200%, this one bleeds the more you spend. Meanwhile, channels with no ad spend show "—" (unmeasurable) for ROAS, but by RPS, email is the highest of all channels at ¥225. So the next move comes into view: "pull Meta's budget up and route it toward strengthening the more efficient email and search ads." It's a decision you could never reach by staring at the single number of an overall ROAS of 300%.
Channels with ads are measured by measured ROAS, and channels without ads (the ones where ROAS becomes "—") by RPS—being able to make this distinction on a single screen is the difference from hand-calculation. Further, because ad spend is taken in, you can also check saturation (whether efficiency holds up as you raise spend) and a budget allocation suggestion (which channel to move toward to raise overall efficiency).
FAQ#
Q. What ROAS target should I aim for?#
A. Not the industry average—it depends on your own gross margin. At 30% margin, breakeven ROAS is 333%, so 400%+ is a safer target. At 50% margin, breakeven is 200%, so 250%+ works. Setting a target ROAS without knowing your gross margin is dangerous.
Q. If I can calculate ROAS, can I decide budget allocation?#
A. Calculation alone isn't enough. The overall average ROAS hides bleeding channels, channels without ads (organic traffic, email) can't be measured by ROAS, and bot-mixed numbers distort. To decide budget allocation, you have to line up measured ROAS (channels with ads) and revenue efficiency RPS (all channels) channel by channel, on bot-excluded actual numbers.
Q. Can I see channel-by-channel ROAS in GA4?#
A. Because GA4 doesn't take in ad spend itself, channel-by-channel ROAS doesn't show up in the standard reports. You can see revenue and sessions in GA4, but to produce ROAS you have to bring in each ad platform's ad spend separately and match it by hand, channel by channel. Google Ads, Meta Ads, and TikTok Ads can each be checked in their own ad managers, but a dedicated tool is more efficient for viewing multiple channels side by side.
Q. Does RevenueScope take in ad spend and calculate ROAS?#
A. Yes. RevenueScope takes in ad spend via read-only Google Ads integration or manual entry, displays channel-by-channel measured ROAS, revenue efficiency (RPS), revenue, and saturation on a single screen, and even produces a budget allocation suggestion. If you have GA4 ecommerce configured, additional setup is minimal—it rides on your existing dataLayer to capture revenue events. Note that gross margin and LTV are not handled.
Summary#
ROAS is the basic KPI for "how much revenue each unit of ad spend generated," and as a definition it's enough once you've pinned down the formula (ad-driven revenue ÷ ad spend × 100%) and the breakeven ROAS derived from gross margin (1 ÷ gross margin × 100%).
But to connect that number to next month's budget decision, there are three gaps outside the formula. The overall average ROAS hides bleeding channels. Channels without ads can't be measured by ROAS. Bot-mixed numbers distort. To get past these, line up measured ROAS and revenue efficiency (RPS) channel by channel, on bot-excluded actual numbers, on one screen, and look at "where to pull from and where to move toward." First, just once, forget the overall ROAS and split the numbers by channel. The moment you see the channel the average had covered up, how you build next month's budget changes.
See which ads actually drive revenue, at a glance
Free up to 5,000 sessions/month, AI analyst included. No credit card required. Up and running in 5 minutes.