
"I wanted to grow sales, so I got every dashboard and tool set up. But the more screens I open, the more numbers there are — and in the end I can't tell what to actually change." It's the most common way ecommerce operators get stuck. Metrics aren't scarce; they're overwhelming. So you can't decide.
The cause isn't too few numbers. It's that "numbers that drive sales decisions" and "numbers that just feel good to watch" are jumbled together on the same screen. This article shows how to narrow your tracked metrics down to the five that decompose revenue. And if you run ads, you add one more — ROAS — and we'll explain exactly why, in plain language.
Table of Contents
TL;DR#
-
You can't decide because you have too many numbers, not too few
Vanity numbers (pageviews, likes, followers) are mixed in with revenue numbers on the same screen
-
Track only the five that decompose revenue
Revenue = sessions × conversion rate × average order value. The five you need are revenue, AOV, RPS, conversion rate, and sessions
-
If you run ads, add ROAS as one more
But ROAS is "efficiency," not "profit." Decide on efficiency alone and it will bite you
-
Even narrowed to five, keeping them aligned by channel is the heavy part
The idea is simple. The work is re-assembling the same five by channel and by new-vs-returning, every time
1. Why more metrics make you less decisive#
Bottom line: most dashboards are built to give you a sense of control, not to tell you what to do next.
The screens ecommerce operators watch are lined with dozens of numbers — pageviews, time on page, bounce rate, followers, likes, impressions, click-through rate. They all move daily, so watching them feels like "staying on top of things." But most of them only describe how much you were seen or liked, not how much you sold.
In fact, ecommerce operators abroad resonate with the line: "you're not drowning in data, you're drowning in noise disguised as certainty." Revenue graphs and ad ROAS feel reassuring to look at, but they point in no direction. The more metrics you add, the calmer you feel — and the further away the decision gets.
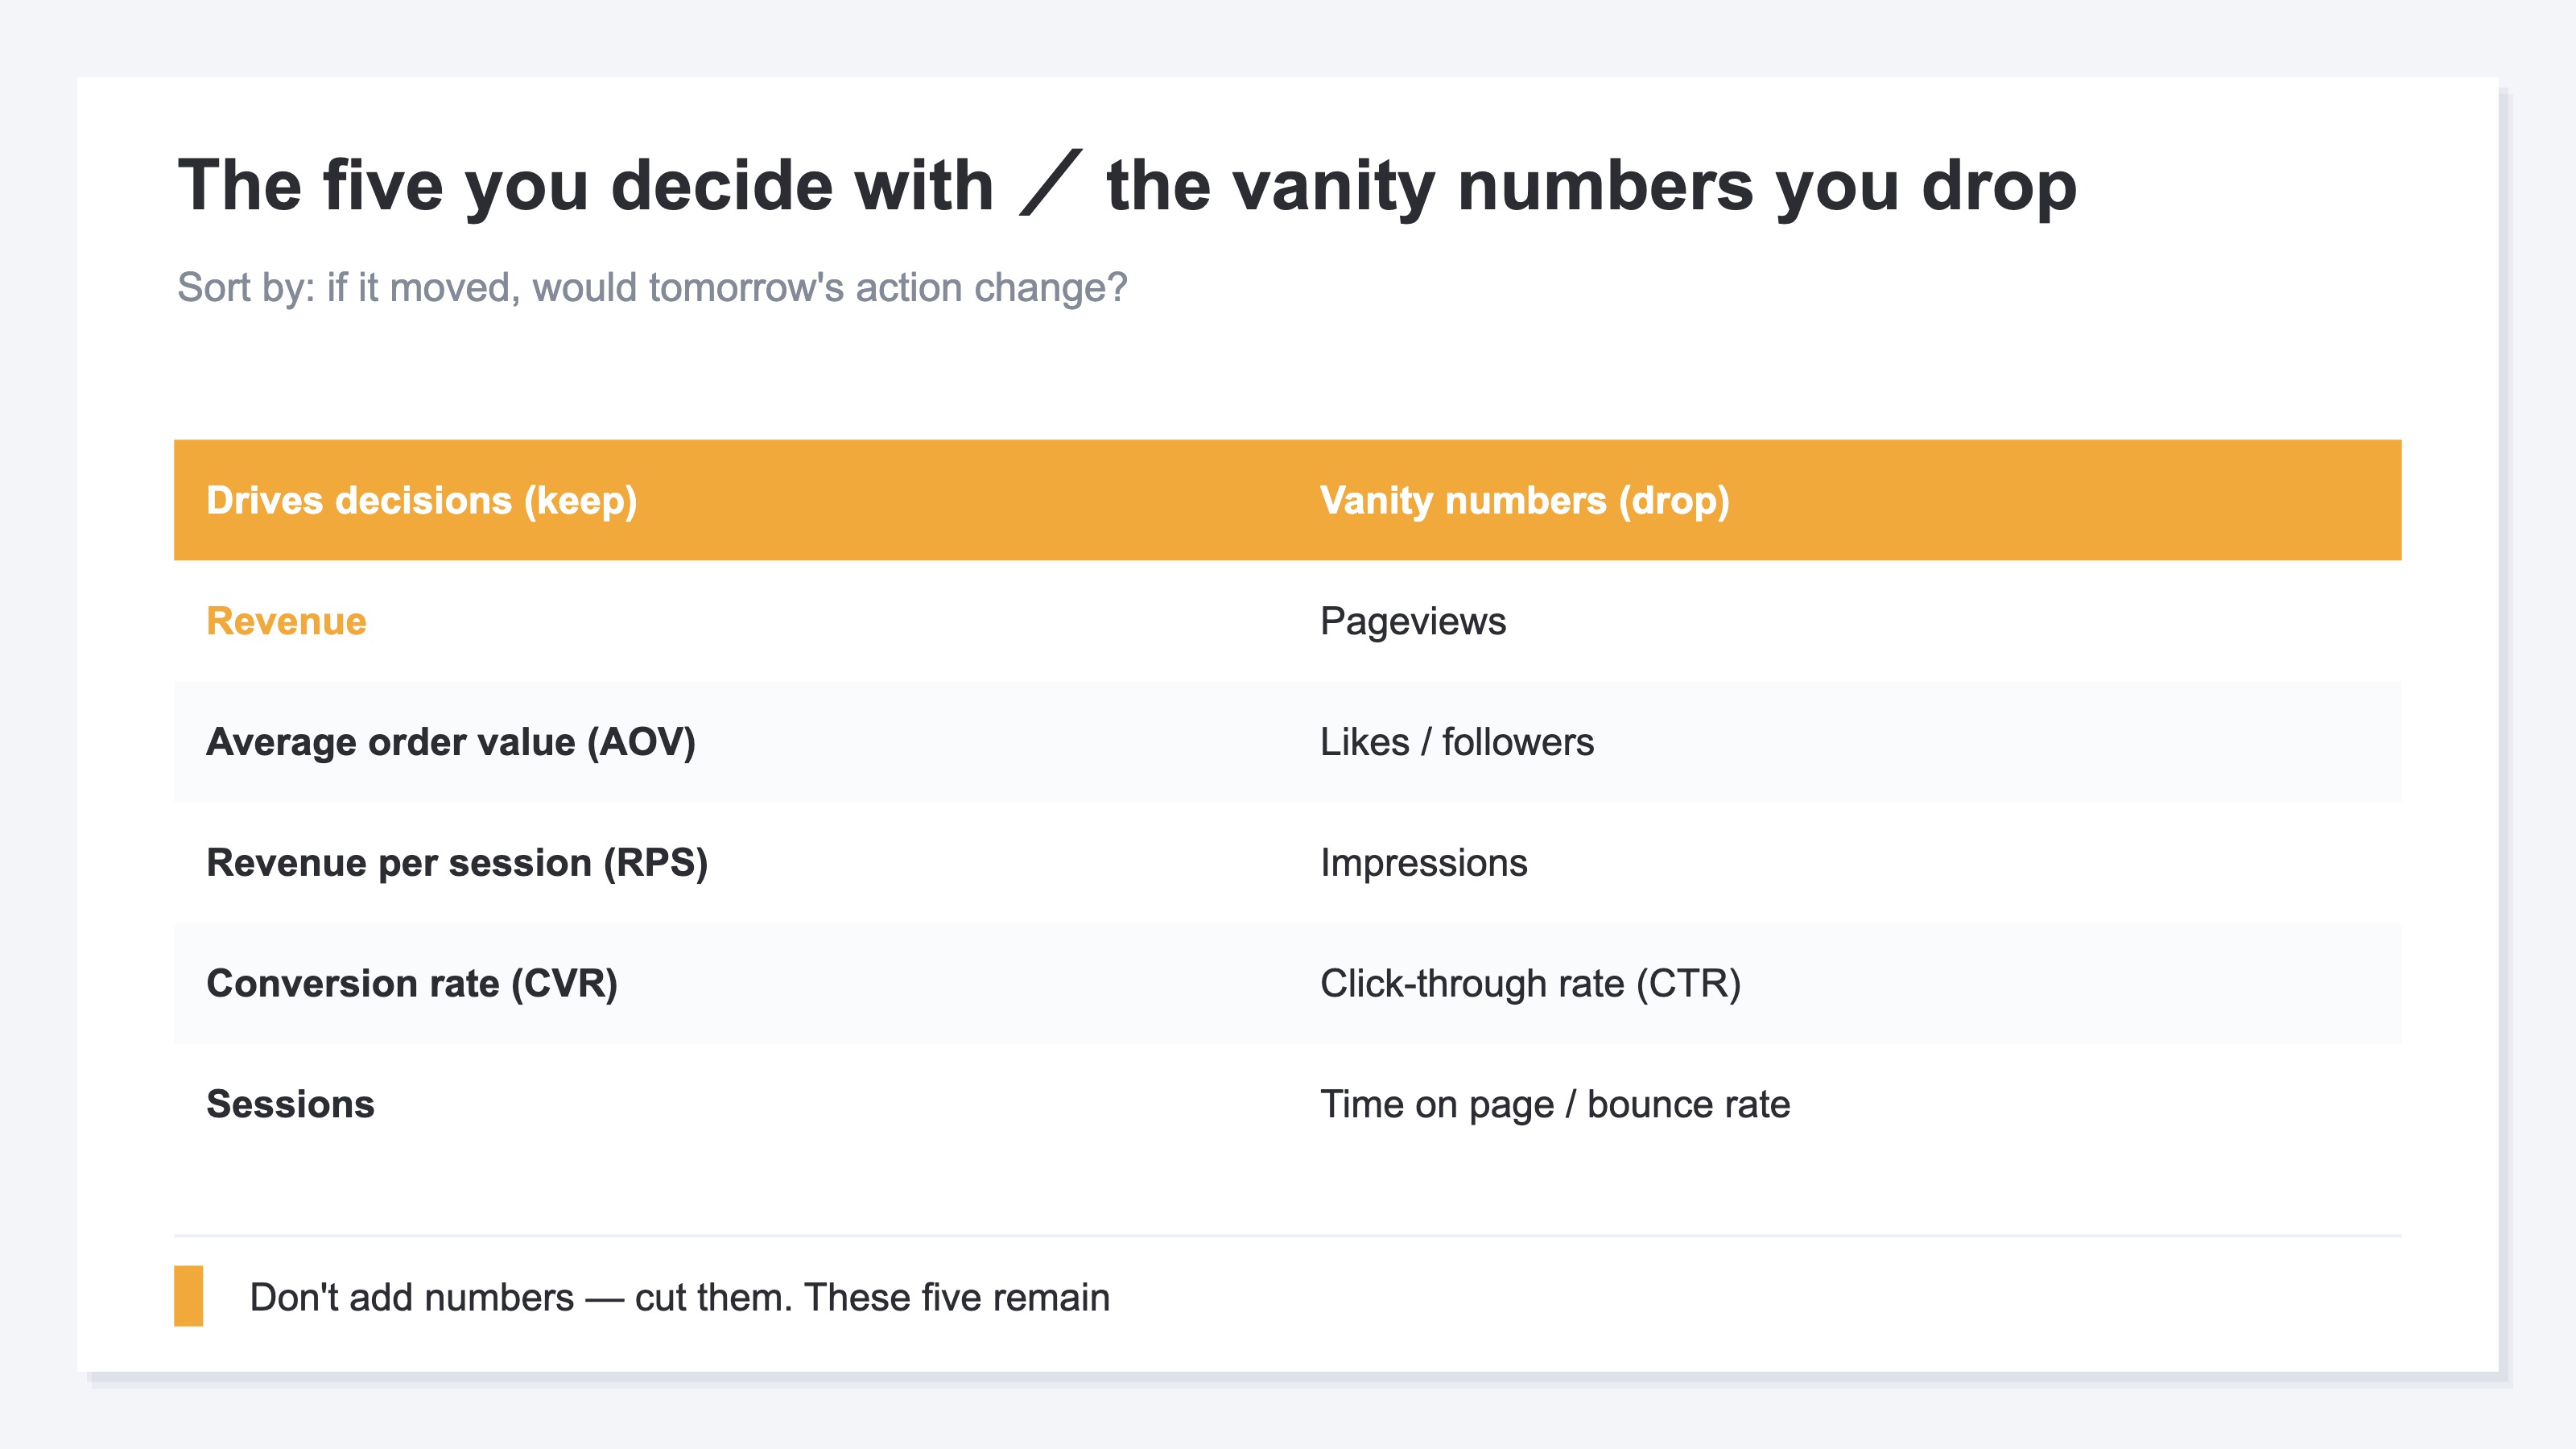
What matters isn't adding numbers; it's cutting them. Ask, "if this number moved, would tomorrow's action change?" Drop the ones where the answer is no. Very few remain.
2. Track only the five that decompose revenue#
Bottom line: revenue decomposes into "sessions × conversion rate × average order value." Track just the five numbers that decomposition needs, and you'll see where revenue comes from and where it's weak.
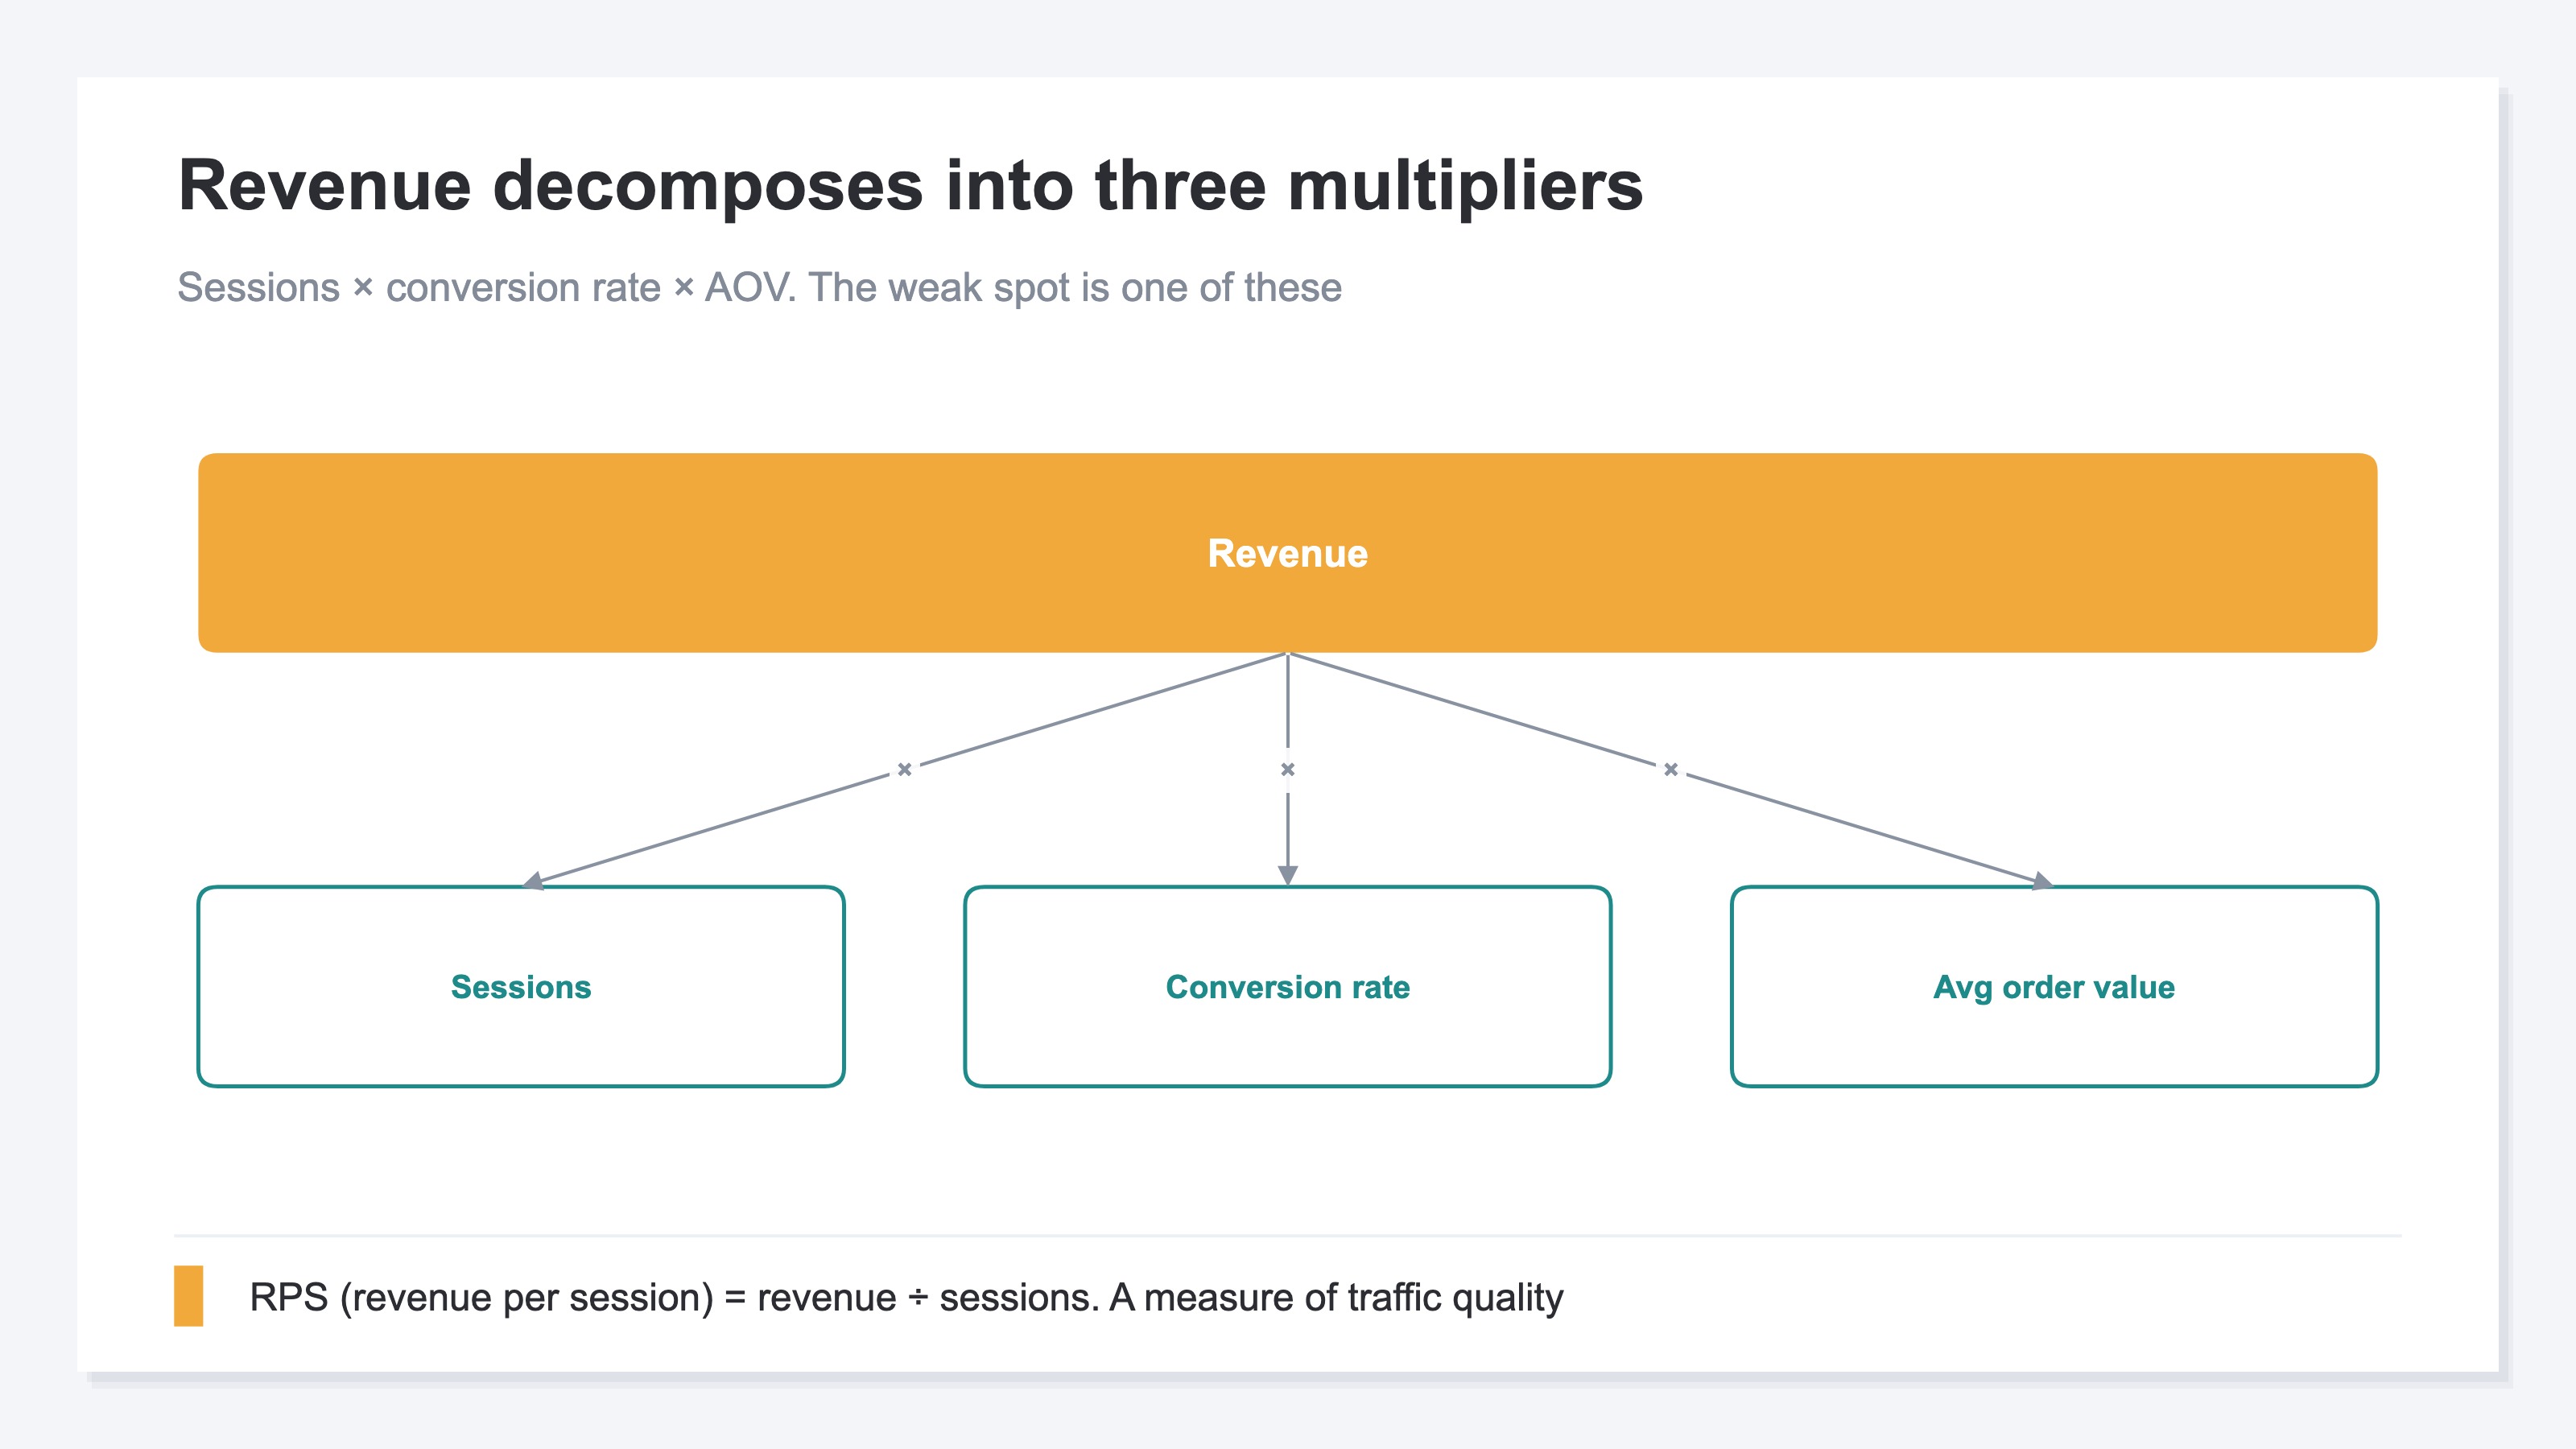
Revenue breaks down into a single equation:
Revenue = sessions × conversion rate × average order value (AOV)
The number of people who visited (sessions), the share who bought (conversion rate), and how much each spent (AOV). Multiply the three and you get revenue. So when sales stall, the cause is always in one of these three: not enough people coming, people coming but not buying, or buying at a low value. Break it down this far and the next move decides itself.
To this, add one more number for comparing channels fairly: revenue per session (RPS). It's revenue divided by sessions — what one average visit is worth in sales. It lets you compare the quality of traffic regardless of volume.
So the core comes down to five: revenue, AOV, RPS (revenue per session), conversion rate (CVR), and sessions. With these five, you can explain both "where revenue comes from" and "where it's weak." Pageviews and followers aren't here — they don't enter the revenue equation. For decisions, the numbers in the equation are all you need.
3. If you run ads, add ROAS as one more#
Bottom line: if you run ads, add ROAS (revenue against ad spend) to the five. But never forget ROAS measures "efficiency," not "profit."
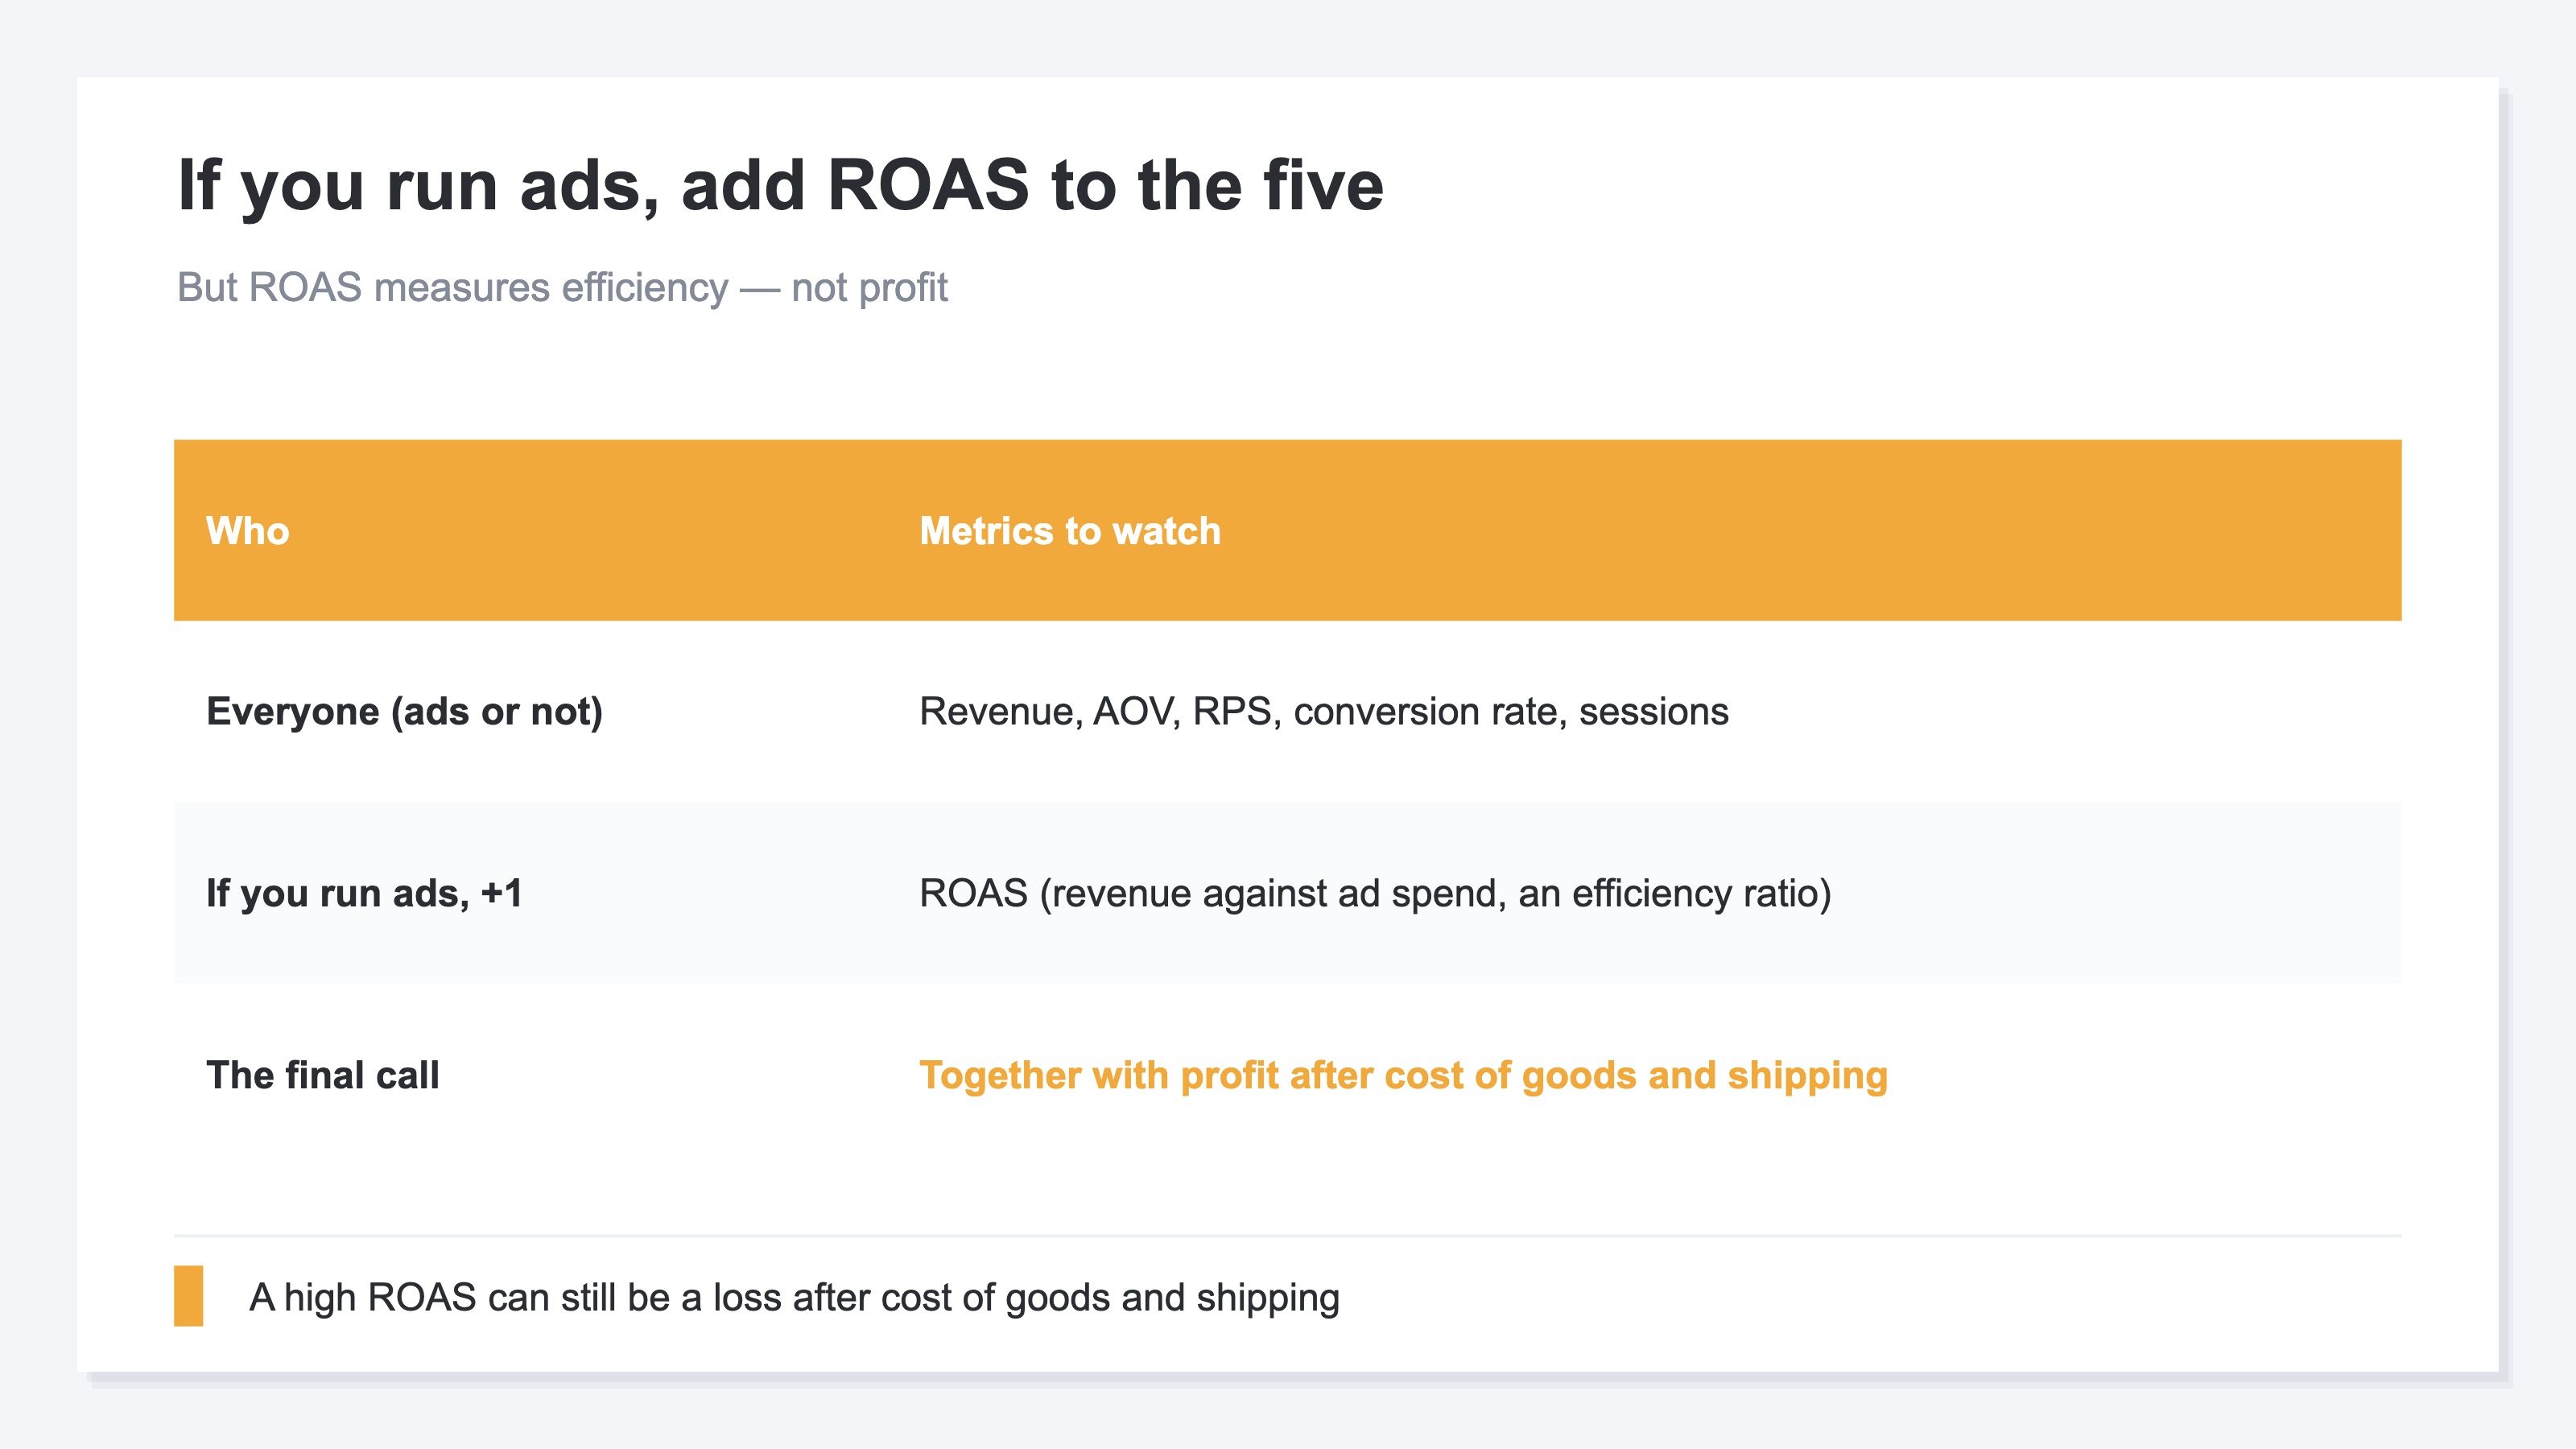
Only when you run ads do you add a sixth: ROAS. It tells you how many yen of revenue each yen of ad spend produced — directly tied to whether to keep or cut a campaign. Conversely, a store that doesn't advertise doesn't need it. So ROAS isn't "everyone's core"; it's "one more for people who run ads."
The caution: ROAS is efficiency, not profit. Operators abroad repeat the lines "ROAS, margin, and gross profit are three completely different things" and "revenue is vanity, margin is sanity." A high ROAS can still be a loss once you subtract cost of goods and shipping. So use ROAS as the entry-level number for "scale up or down," and make the final call together with AOV and gross margin.
Now your tracked numbers are narrowed to "the five everyone watches" plus "ROAS for people who run ads." The thinking itself isn't hard. What's hard is re-assembling this small set by channel, and split by new versus returning, every single time. GA4 can show each number individually, but to line up the five by channel and then add new-vs-returning efficiency, you end up rebuilding exploration reports over and over — quietly heavy when repeated weekly.
RevenueScope solution
Bottom line: aligning the five that decompose revenue by channel and by new-vs-returning is multi-axis work that takes rebuilding several GA4 exploration reports. RevenueScope holds that state on one screen from the start.
There are two sides to having too many metrics. One is vanity numbers mixed in with revenue numbers. The other is that the numbers you actually need are scattered across separate services — GA4, your ad dashboards, your cart platform. So you collect them yourself and re-organize them into the core few by channel, which gets heavy every time you repeat it.
RevenueScope consolidates those scattered numbers onto one screen and organizes them into the form ecommerce decisions actually need. Ask it, and it returns the five core numbers together (demo data):
| Metric | Value | vs. prior period |
|---|---|---|
| Revenue | ¥3,180,000 | +12% |
| Sessions | 41,200 | +5% |
| Conversion rate (CVR) | 1.8% | +0.2pt |
| Average order value (AOV) | ¥4,290 | −3% |
| Revenue per session (RPS) | ¥77 | +6% |
| ROAS (only when ad spend is connected) | 3.2 | +0.4 |
Reading just these six rows, the weak spot decides itself: "visits up, efficiency (RPS) up — but average order value is slipping." And RevenueScope splits these five by channel and by new vs returning. So decision-ready differences — "Instagram brings low-AOV new visitors," "branded search is efficient on returning buyers" — sit lined up without rebuilding a single report. Connect your ad spend, and per-channel measured ROAS and a budget-allocation suggestion are added on top.
Stop chasing followers and pageviews; narrow to the few numbers that decompose revenue. Gathering that narrowed set from separate services onto one screen and organizing it clearly — chore and all — is what RevenueScope is for.
FAQ#
Frequently asked questions#
Q. Should I stop looking at pageviews and followers entirely?
A. Glancing at them is fine, but stop treating them as "results." Neither enters the revenue equation (sessions × conversion rate × AOV). Keep decisions to the five in the equation, and place vanity numbers at the "nice if they grow" level.
Q. Is it wrong to track more or fewer than five KPIs?
A. Five is the smallest set that fully decomposes revenue. Fewer, and you can't isolate why sales are weak (no traffic, no purchases, or low value). Add dozens more, and you're back to the original "can't decide" state. Start with five — plus ROAS if you run ads.
Q. Can't I judge ads on ROAS alone?
A. Use it as an entry point, not the final call. ROAS is efficiency, not profit. A high ROAS can still be a loss after cost of goods and shipping. Make it your first gauge for scaling up or down, and decide finally together with AOV and gross margin.
Conclusion#
In ecommerce, you freeze not because you have too few numbers, but too many. Vanity numbers and revenue numbers share a screen, so the first step is sorting them.
Track only the five that decompose revenue — revenue, AOV, RPS, conversion rate, and sessions. If you run ads, add ROAS as one more (remembering it's efficiency, not profit). As a first step, open your own dashboard and ask of each number, "if this moved, would tomorrow's action change?" Delete the ones that don't, and these five are what remain.
See which ads actually drive revenue, at a glance
Free up to 5,000 sessions/month, AI analyst included. No credit card required. Up and running in 5 minutes.