
"I finished setting up GA4 ecommerce for my Shopify store, but where do I actually look to make decisions?" This is the most common question I get right after a GA4 ecommerce setup is completed.
This article walks through how to read the numbers and turn them into ad decisions in four steps. For the setup itself, see Finish GA4 Ecommerce Setup for Shopify in 30 Minutes.
Table of contents
TL;DR#
-
Shopify numbers decompose; GA4 numbers break down by source; RPS unifies both
The admin panel shows absolute revenue. GA4 shows source-level traffic. Revenue Per Session (RPS) is the single metric that compares channel efficiency across both views[1]
-
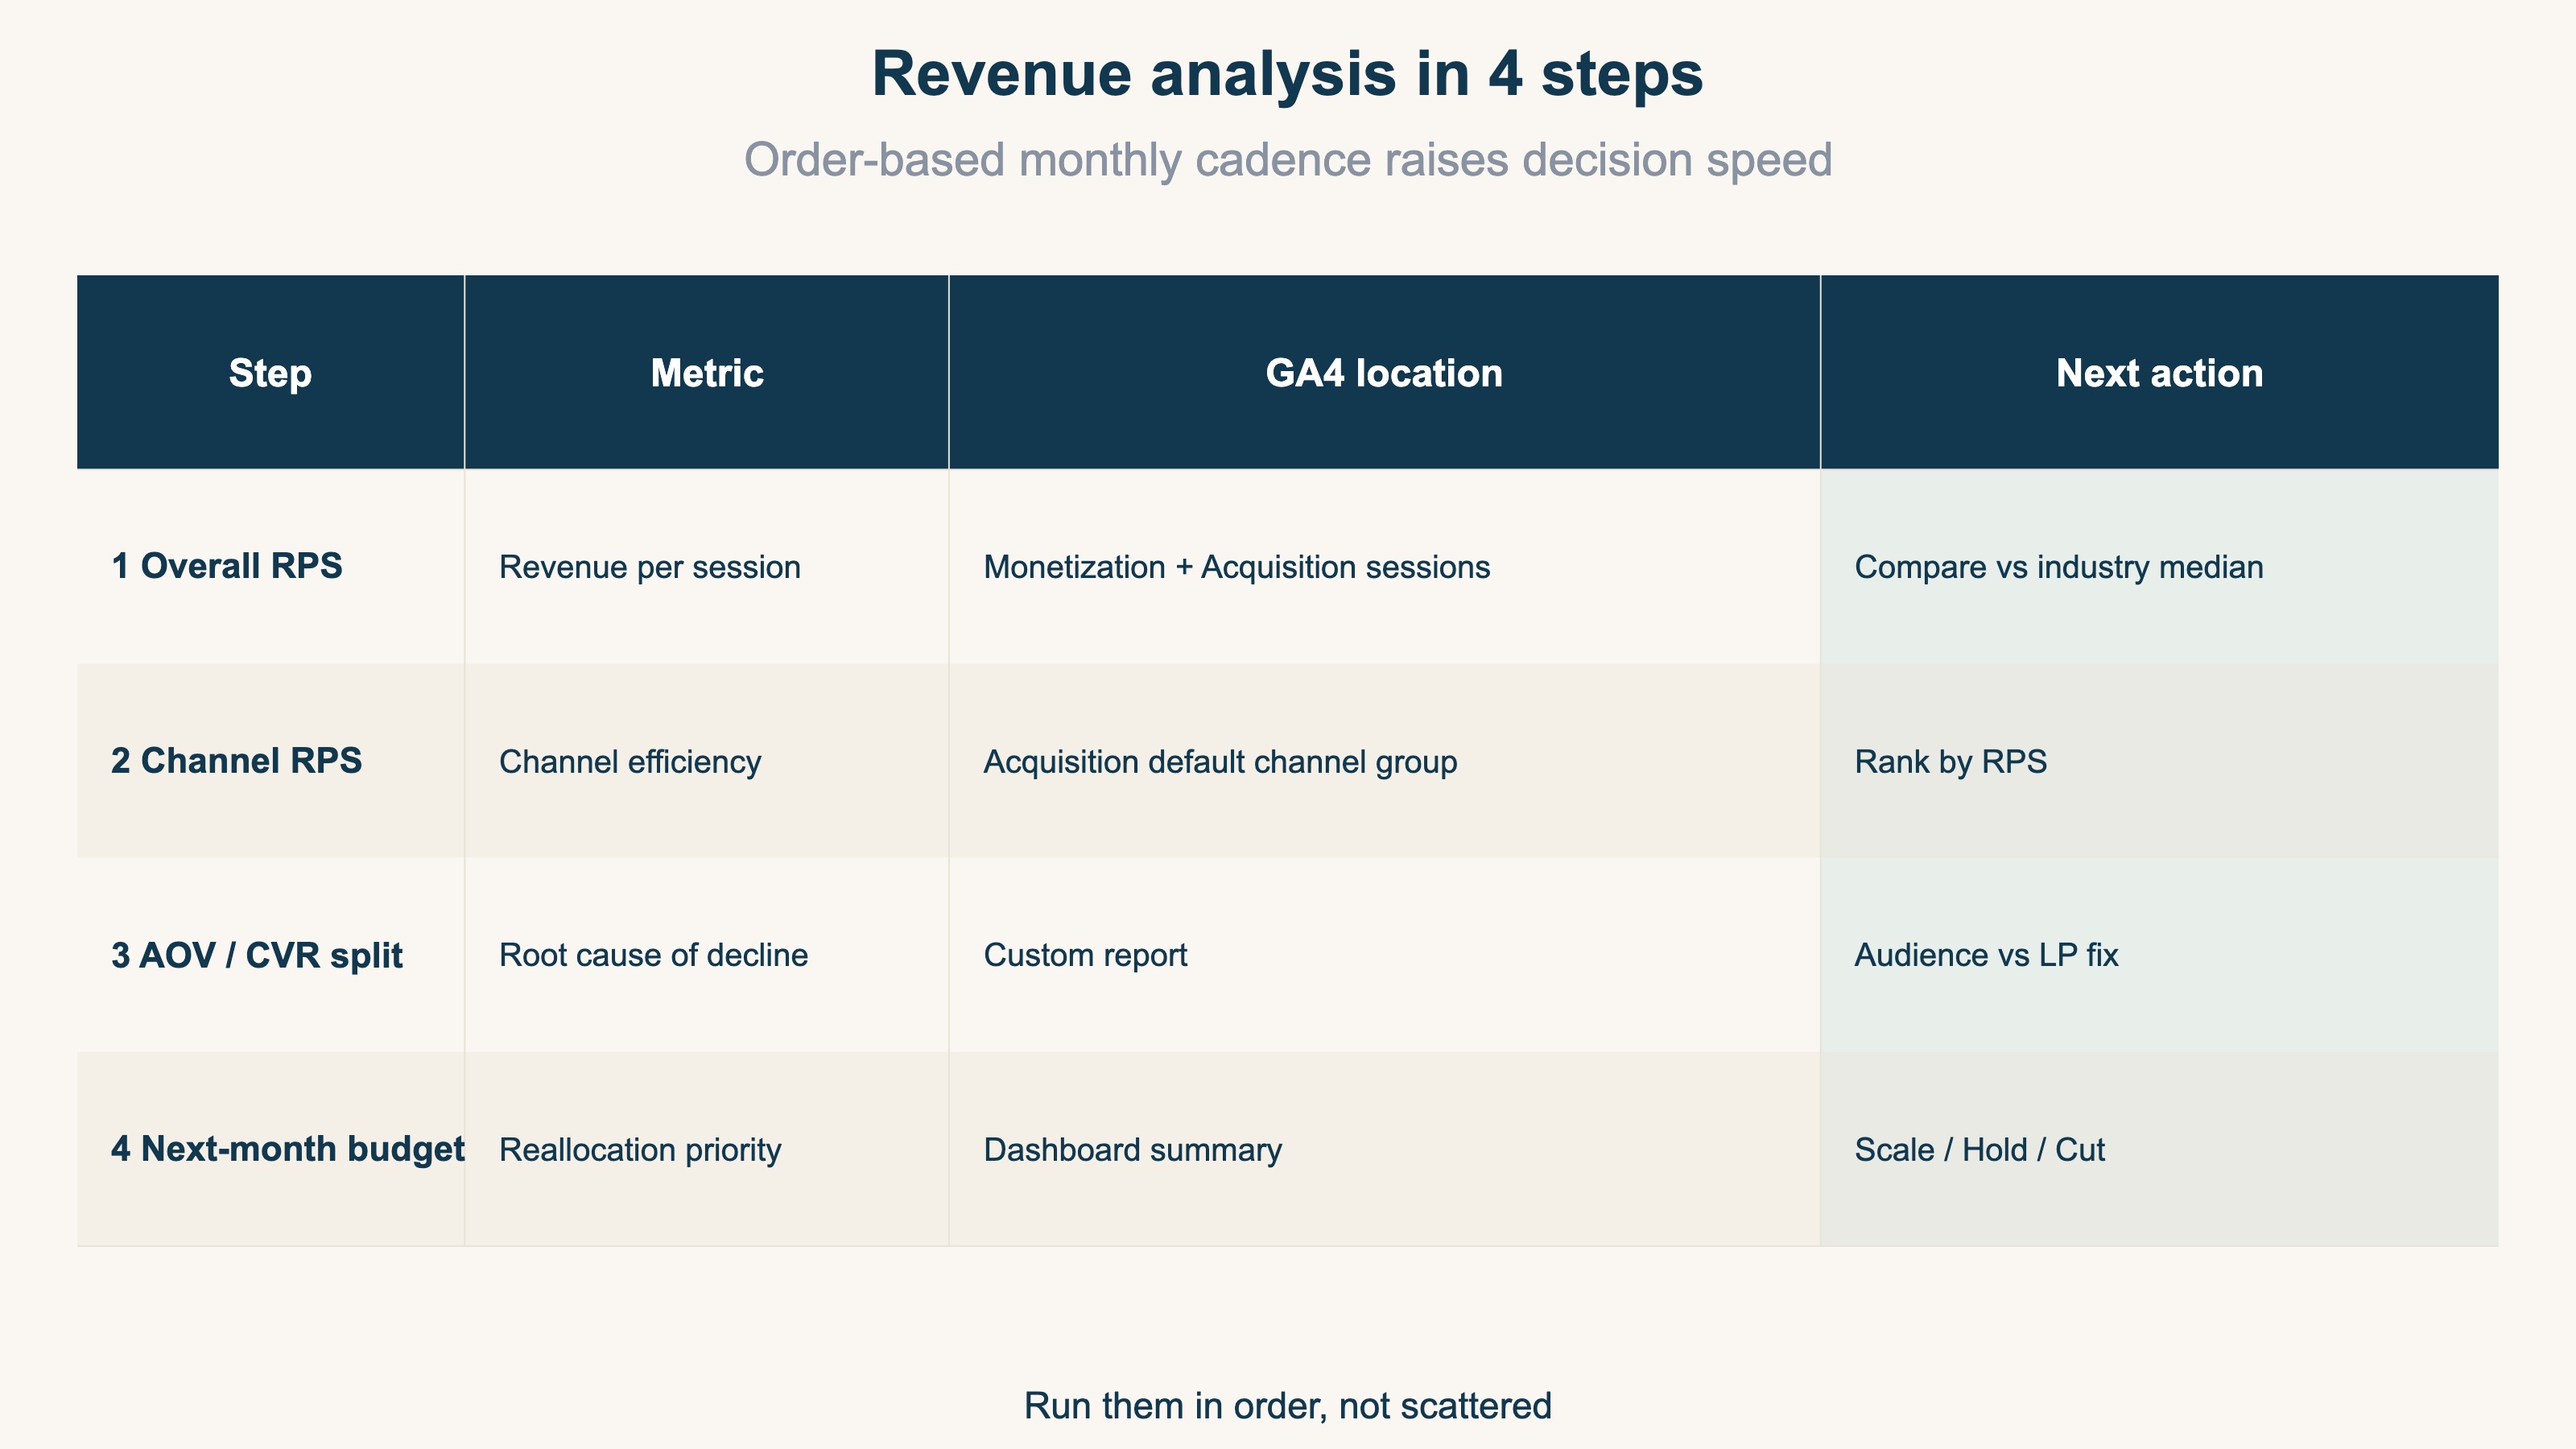
Post-setup revenue analysis runs in four ordered steps
① Overall RPS for monthly health → ② Channel-level RPS for ad efficiency → ③ AOV and CVR to split root causes → ④ Next-month budget allocation. Each step decides the next one
-
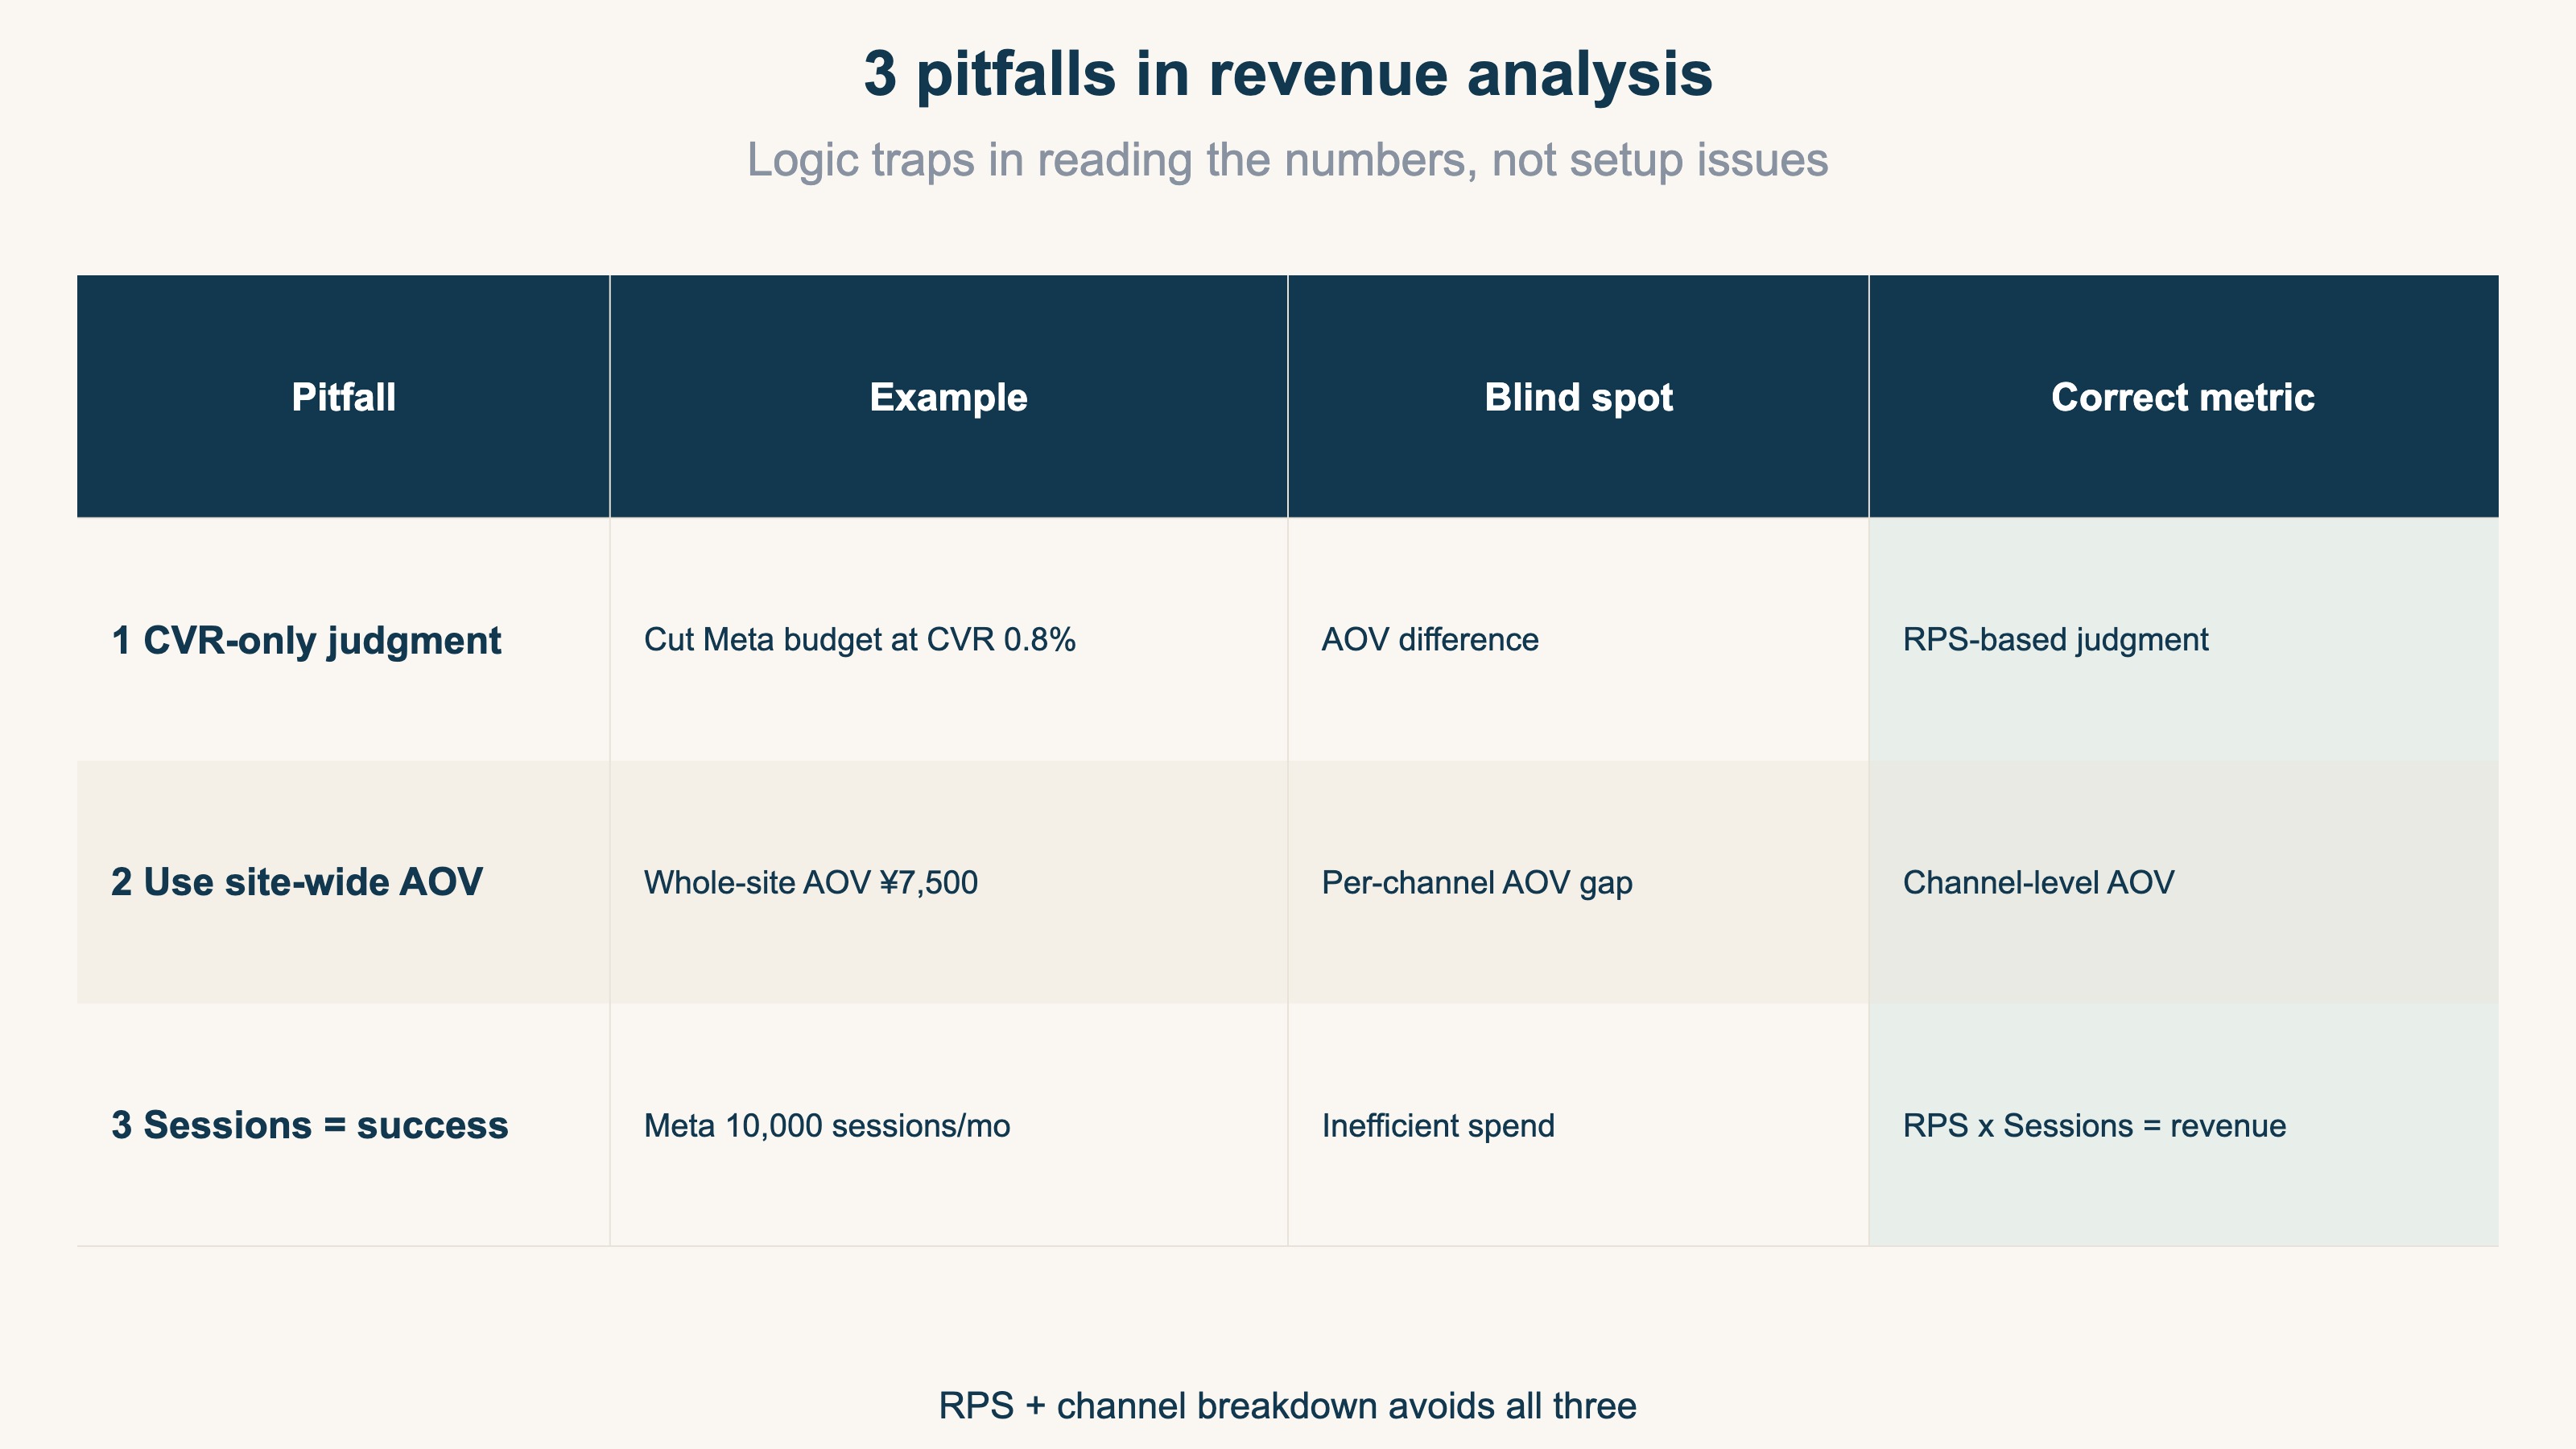
Three pitfalls trip up the read, even when setup is perfect
Judging on CVR alone, using site-wide AOV, treating session count as success. These three logic traps prevent budget optimization regardless of setup quality
1. Three Metrics to Look at After GA4 Setup#
After GA4 ecommerce setup is complete, the metrics worth focusing on narrow down to just three: RPS (Revenue Per Session), AOV (Average Order Value), and CVR (Conversion Rate).
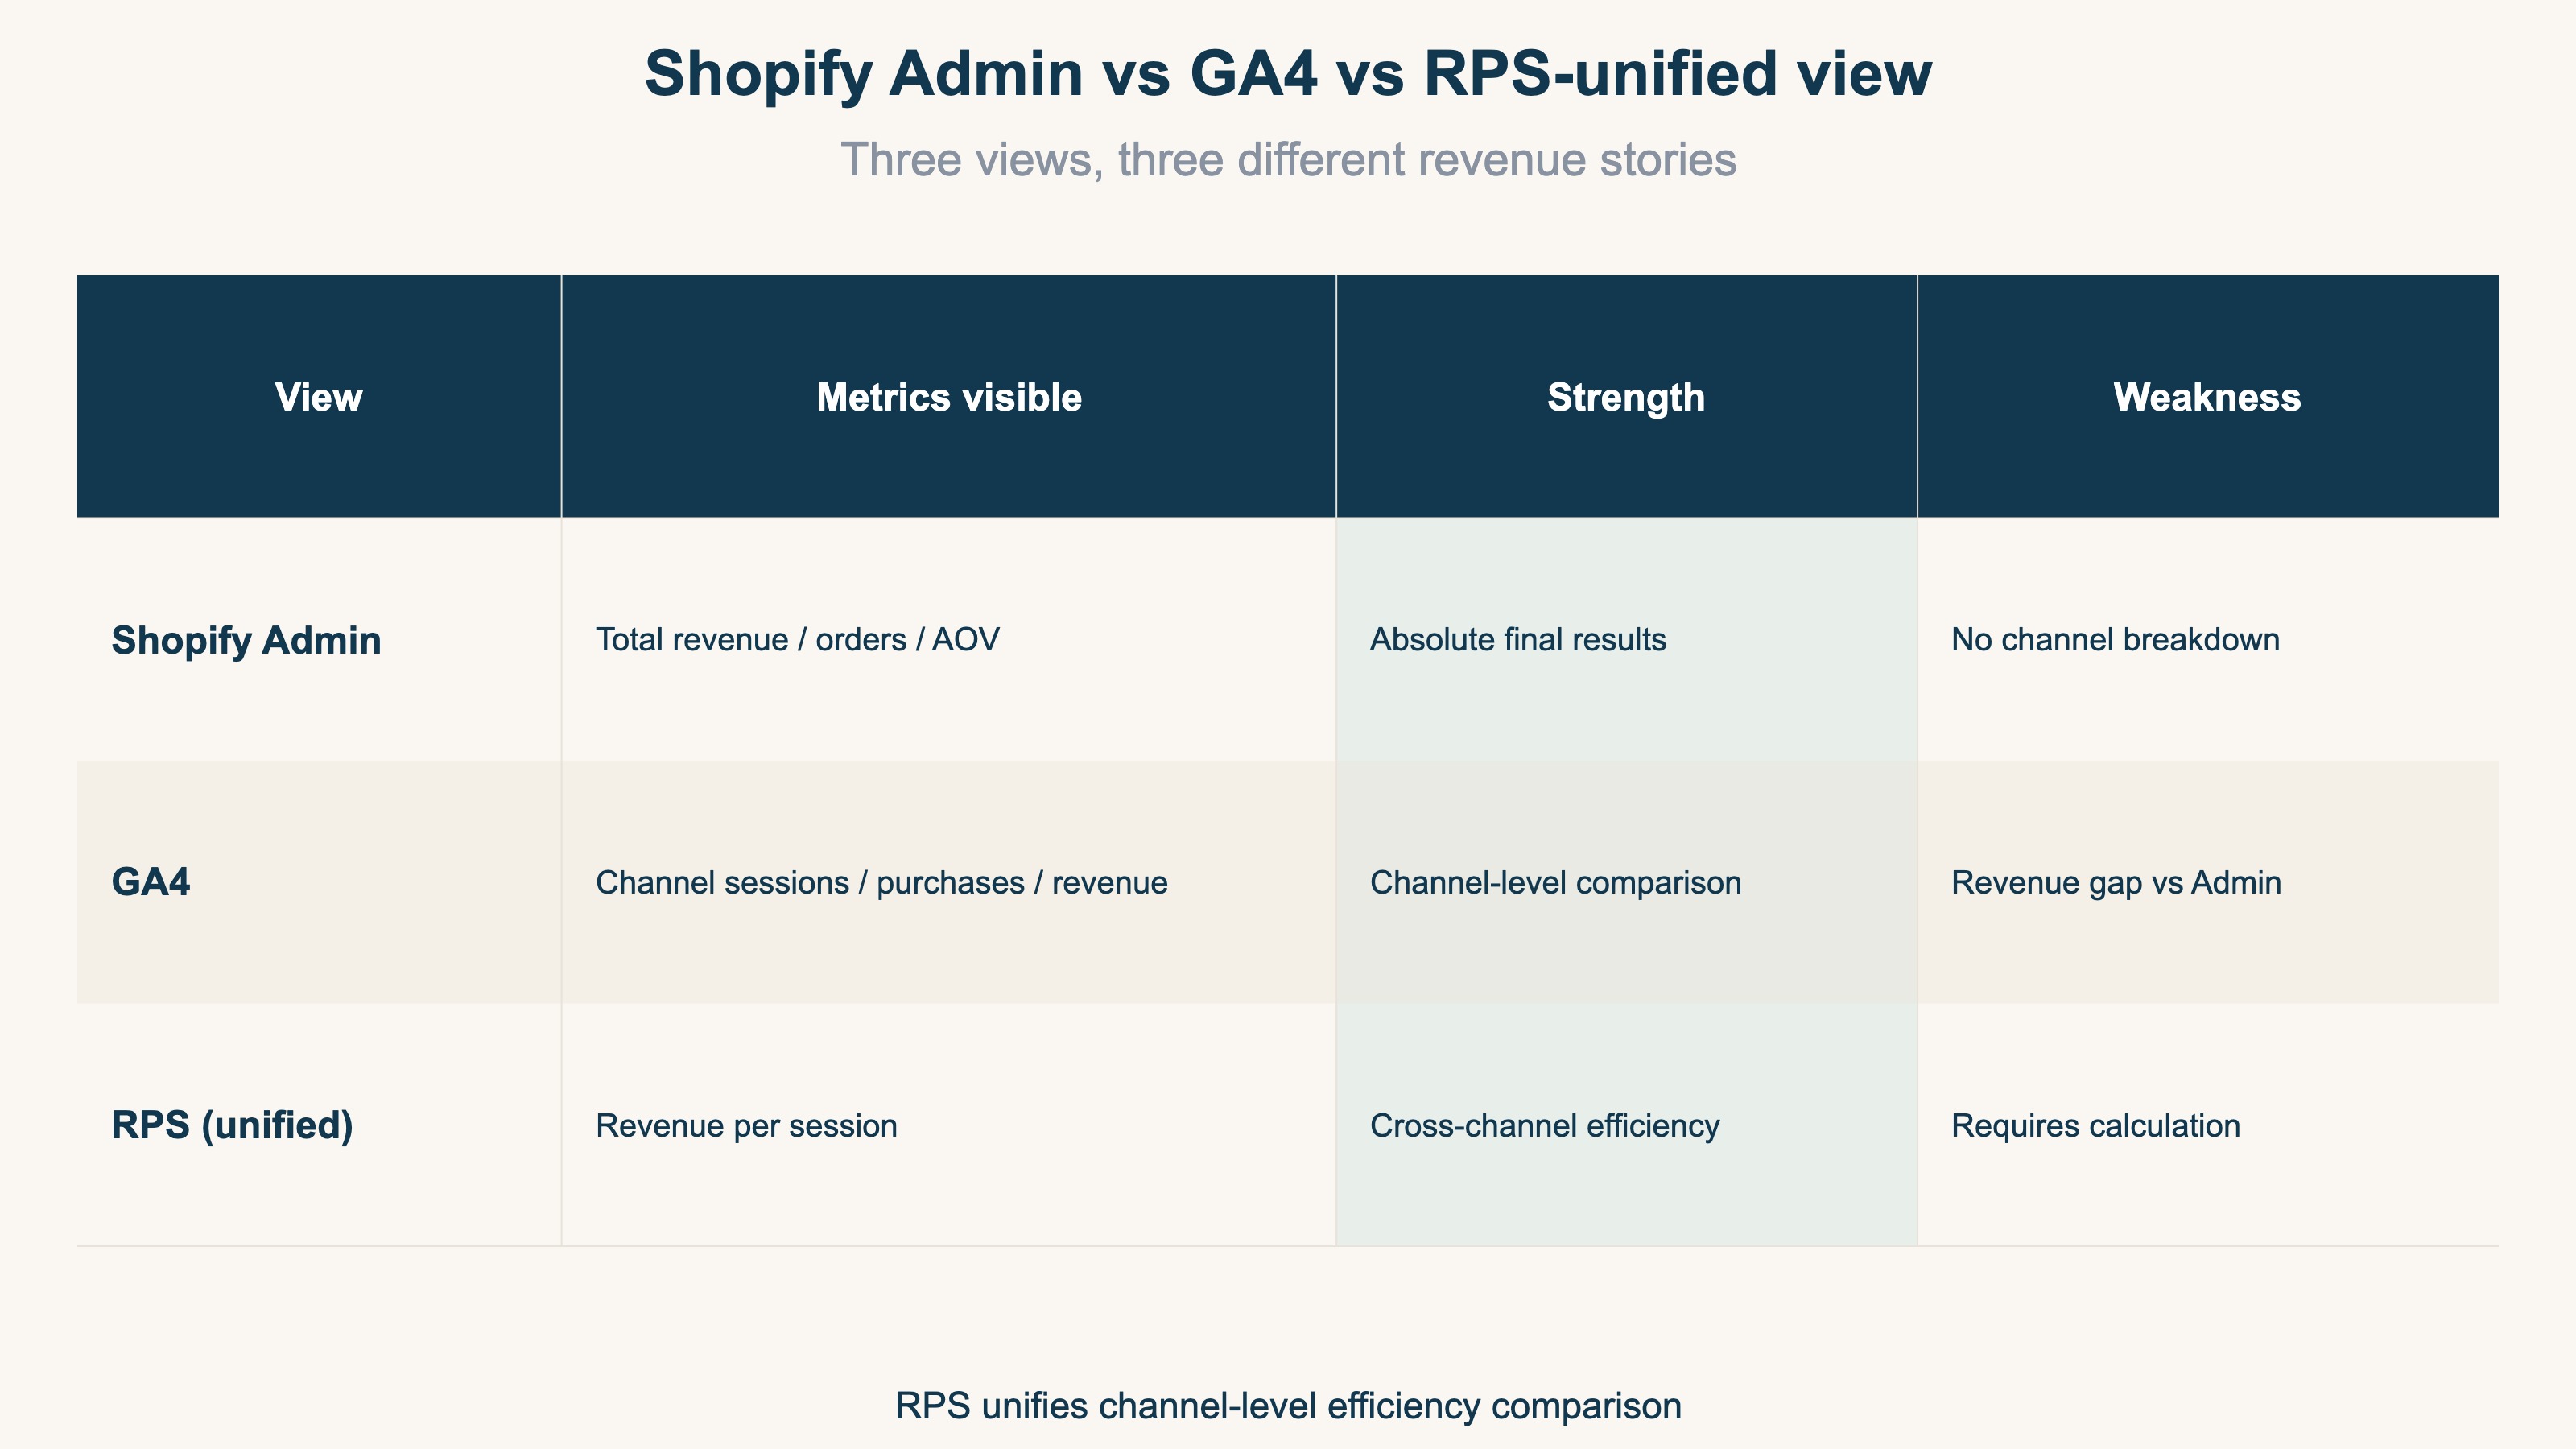
The Shopify admin panel shows "final absolute results," GA4 shows "source-level intermediate process," and RPS is the single metric that unifies both.
A "revenue +20% MoM" line in the admin panel does not tell you whether AOV rose, sessions grew, or CVR improved. Even GA4's source breakdown shows the relationships between numbers, but not the next move.
RPS makes it clear. "Google Ads RPS dropped from $1.20 to $0.98" tells you that acquisition efficiency is degrading — likely from creative fatigue or traffic-quality decay. Pairing it with AOV and CVR narrows the root cause further.
2. Revenue Analysis in 4 Steps#
Post-setup revenue analysis works better with a fixed order. Run the same four steps every month and the speed and quality of decisions both step up.
Step 1: Overall RPS for monthly health#
Pull monthly total revenue from GA4's "Monetization > Ecommerce" and monthly sessions from "Acquisition > Sessions," then divide. This single number is the most important whole-site health check.
For industry-level RPS medians, see Industry RPS Benchmark 2026. Own-RPS / industry-median = efficiency ratio: below 1.0 means CVR/AOV improvement first, 1.0–1.5 means hold, above 1.5 means room to scale ad spend.
Step 2: Channel-level RPS for ad efficiency#
In GA4 "Acquisition > Default Channel Group," pull sessions and revenue by Organic Search, Direct, Paid Search, Paid Social, Referral, then compute RPS per channel. Sort by RPS descending and channel efficiency becomes obvious at a glance.
Step 3: Split root causes with AOV and CVR#
Once a low-efficiency channel surfaces, split it by AOV and CVR. Because RPS = AOV × CVR, a low RPS must trace to either (a) low AOV or (b) low CVR.
Compare "Meta RPS $0.80, AOV $60, CVR 1.3%" against "Organic Search RPS $2.20, AOV $80, CVR 2.75%." Meta is low on both AOV and CVR — the creative is attracting a low-value audience that also fails to convert. Audience pivot (new creative) before LP tweaks is the right call[4].
Step 4: Decide next-month budget allocation#
With the three preceding steps done, route next-month budget as "creative refresh → hold spend," "high efficiency → scale up," or "no easy fix → cut."
3. Three Pitfalls in Reading the Numbers#
Even with a clean setup, three logic traps in reading the numbers themselves show up.
Pitfall 1: Judging on CVR alone#
CVR in isolation hides the AOV gap. A low CVR with high AOV can still have healthy RPS. Always pair CVR with AOV and judge by RPS as the final signal[2]. See RPS vs CVR: A Two-Axis Framework for the joint framework.
Pitfall 2: Using site-wide AOV#
Site-wide AOV erases channel-level AOV gaps. Pull channel-level AOV and treat each source as a different number[3].
Pitfall 3: Treating session count as success#
Treating absolute session count as a success metric lets inefficient spend go unchecked. A low-RPS session is "just driving counts" and is the prime target for budget cuts.
4. FAQ#
Q1: Why don't Shopify admin revenue and GA4 revenue match?#
A 5–15% gap is normal. Causes include (a) sessions where GA4 tags did not fire, (b) returns/cancellation timing differences, (c) tax-inclusive vs exclusive settings. Aim for 5–10% tolerance rather than exact match in practice. Channel-level comparison on the GA4 side is what matters for ad decisions.
Q2: GA4 reports lag — what do I do?#
GA4 realtime reports update within seconds. Standard reports lag 24–48 hours by spec. Don't trust same-day numbers — use yesterday's, and run monthly judgments after the 3rd of the following month.
Q3: Why not just use ROAS?#
ROAS (Return on Ad Spend) is critical for ad investment but only works on channels with known spend. Organic Search, Direct, and Referral have no defined ROAS. RPS works across all channels, so use RPS for the whole picture, and ROAS for paid channels only. See ROAS Complete Guide for detail.
5. Next Step — Turn GA4 Setup Into Revenue Decisions#
Computing channel-level RPS manually in GA4 every month takes 30–60 minutes per cycle. Over time this becomes a chore, leading to "skip analysis this month" → "ad decisions revert to gut feel" — a classic failure pattern[5].
RevenueScope auto-visualizes channel-level RPS, AOV, and CVR from your GA4 ecommerce data. If GA4 ecommerce is already set up, installation takes five minutes with no extra config. Revenue, AOV, RPS, and CVR — the four core metrics, plus Sessions on the dashboard for a 5-KPI card layout — let you run the four steps above with zero manual work every month.
See which ads actually drive revenue, at a glance
Free up to 5,000 sessions/month, AI analyst included. No credit card required. Up and running in 5 minutes.
References#
[1] Shopify "Average Order Value (AOV): Formula, Benchmarks and 7 Ways to Increase It" September 2025
[2] Baymard Institute "E-Commerce Cart & Checkout Usability Research" 2024
[3] BigCommerce "Ecommerce Growth with Upselling and Cross Selling Tactics" 2024
[4] McKinsey & Company "Unlocking the next frontier of personalized marketing" January 2025
[5] METI "FY2024 E-Commerce Market Survey" August 2025


