
"We increased budget on a high-CVR ad and revenue did not grow." We hear this from EC operators several times a month. CVR (conversion rate) improves but revenue stays flat or drops. This happens routinely when CVR is used as the sole judgment metric.
CVR is an intermediate metric that measures purchase rate. Revenue Per Session (RPS) is an absolute measure of revenue efficiency, computed as AOV (average order value) multiplied by CVR. The two often move in opposite directions, and watching CVR alone leads to repeated misjudgments. This article explains the difference between RPS and CVR, why both axes are required, the three CVR myth patterns, and a four-quadrant decision framework for ad budget allocation.
Note on terminology: We use Revenue Per Session (RPS) below. RPS is not yet a standardized industry metric in the way ROAS or LTV are — it is RevenueScope's core metric. We spell out the full term on first mention.
TL;DR#
- RPS is an absolute revenue-efficiency metric; CVR is an intermediate purchase-rate metric. CVR alone cannot judge initiative effectiveness. From the relationship RPS = AOV × CVR, when AOV drops, RPS can fall even as CVR rises.
- Three patterns produce a directional divergence between CVR and RPS (CVR up, AOV down, RPS down): bundle discounts, low-price-product funneling, and aggressive coupon distribution. Treating "CVR up means initiative success" leaves revenue on the table in all three cases.
- A two-axis quadrant chart of RPS and CVR enables proper ad budget allocation. Q2 (high RPS, high CVR) is the top priority, Q4 (low RPS, high CVR) needs AOV-lifting initiatives, Q3 (both low) is a withdrawal candidate, and Q1 (high RPS, low CVR) is a scale candidate.
1. RPS vs CVR — Why Both Axes Matter#
RPS and CVR have different formulas and different roles.
| Metric | Formula | Role | Standalone Judgment |
|---|---|---|---|
| RPS | Revenue ÷ Sessions | Absolute revenue-efficiency metric | Possible |
| CVR | Purchase Sessions ÷ Total Sessions | Intermediate purchase-rate metric | Not possible |
The two are linked by RPS = AOV × CVR, meaning CVR is just one component of RPS. With AOV ¥6,000 and CVR 2.0%, RPS is ¥120. Even if CVR rises to 3.0%, if AOV drops to ¥3,500, RPS becomes ¥105 — actually worse. An improvement in CVR does not automatically mean an improvement in revenue. This is the starting point for using both metrics.
The full RPS calculation method and how to derive it in GA4 is covered in the RPS (Revenue Per Session) Guide: Formula and How to Calculate in GA4. The full dashboard design with these core metrics is covered in Revenue Dashboard Design.
The reason many operators rely on CVR alone is that CVR appears prominently in GA4's standard reports, while RPS is a derived metric requiring a small extra step. But final judgment requires the composite result, not the input.
2. CVR — Position in the 5-KPI Framework#
CVR (Conversion Rate) is the percentage of all sessions that result in a purchase.
CVR = Purchase Sessions ÷ Total Sessions × 100%
Google Analytics 4 official documentation defines purchase-rate-related indicators in derived forms such as "Purchase rate" [1]. According to Baymard Institute's EC research, the industry average CVR is around 2-3%, with 4-5% being the ceiling even for high-performing ECs [2].
In RevenueScope's core 5-KPI framework, CVR sits as follows.
| # | Metric | Type |
|---|---|---|
| 1 | Revenue | Outcome metric |
| 2 | RPS (Revenue Per Session) | Top priority metric |
| 3 | AOV (Average Order Value) | Core metric (RPS component) |
| 4 | CVR (Conversion Rate) | Core metric (intermediate) |
| 5 | Sessions | Supporting metric |
CVR is positioned as an "intermediate metric" used as a supplementary view. CVR alone cannot describe business health — it must be combined with AOV and consolidated into RPS before any judgment is made.
3. The CVR Myth: 3 Patterns Where CVR Misleads#
"If CVR rises, revenue will grow." This is only half true. When CVR rises while AOV drops or sessions shrink, three patterns produce a fall in RPS or revenue.
Trap ①: Bundle Discounts Pull Down AOV#
With AOV ¥6,000 and CVR 2.0%, RPS is ¥120. A "10% off second item" promotion may push CVR to 3.5%, but if AOV drops to ¥3,500, RPS becomes ¥3,500 × 0.035 = ¥122.5. A 42% AOV drop in exchange for a 2.1% RPS gain is not a successful initiative. Approaches to lift AOV are covered in How to Properly Lift AOV (Average Order Value).
Trap ②: Low-Price-Product Funneling#
"Trial product ¥980" funneling pushes CVR up while destroying AOV. CVR moving from 2.0% to 6.0% (3x) with AOV moving from ¥6,000 to ¥1,200 (1/5) yields RPS dropping from ¥120 to ¥72 — a 40% decline. Outside of an LTV-recovery model, monthly judgment shows RPS falling.
Trap ③: Aggressive Coupon Distribution#
A site-wide 10-20% off coupon falls into the same category. CVR rises but AOV drops by the discount amount.
| Trap | CVR | AOV | RPS |
|---|---|---|---|
| ① Bundle discount | Up (2.0% → 3.5%) | Down (¥6,000 → ¥3,500) | Slight gain (¥120 → ¥122.5) |
| ② Low-price funnel | Sharp up (3x) | Sharp down (1/5) | 40% loss (¥120 → ¥72) |
| ③ Coupon spam | Up | Down | Flat or down |
The shared structure across all three traps is directional divergence between CVR and RPS. Treating "CVR up = initiative success" guarantees you will fall into at least one of these.
4. The RPS × CVR Quadrant Decision Framework#
To visualize the directional divergence between CVR and RPS, a two-axis quadrant chart is effective.
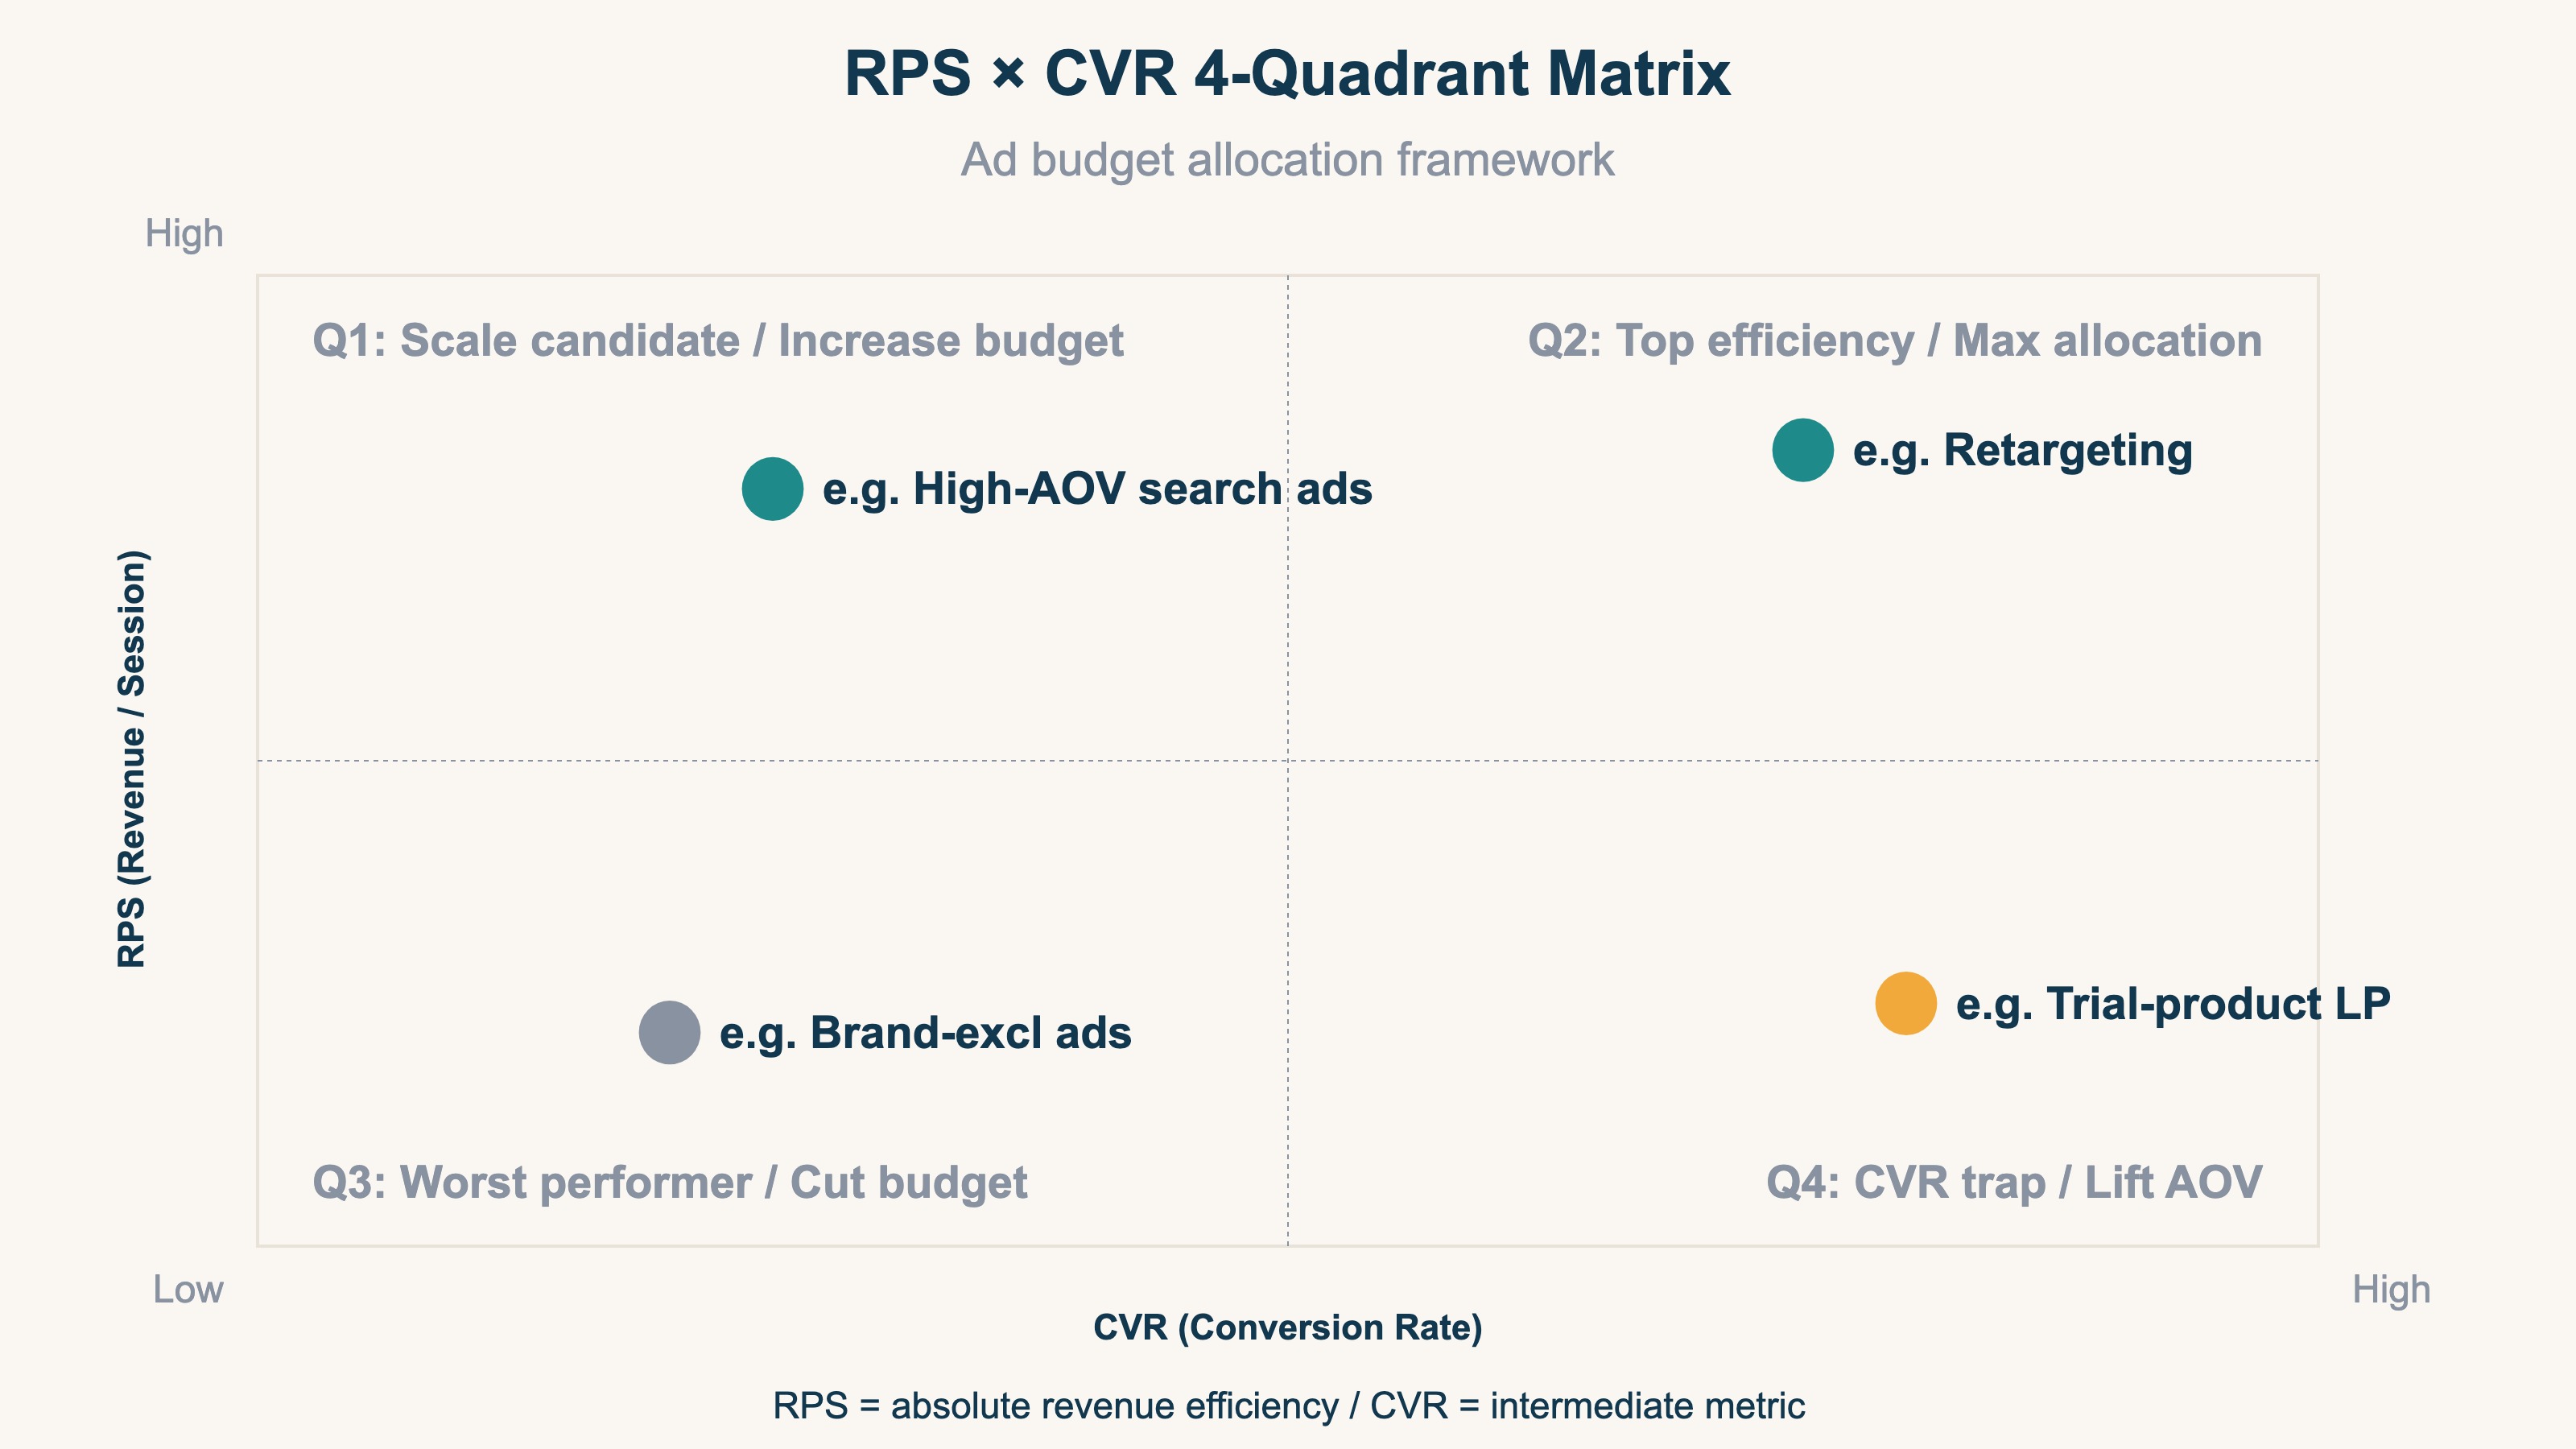
Plotting CVR on the x-axis and RPS on the y-axis maps ad channels, LPs, and product pages into four quadrants.
| Quadrant | State | Action |
|---|---|---|
| Q1: High RPS × Low CVR | High-AOV product hit, scale candidate | Increase budget |
| Q2: High RPS × High CVR | Best revenue efficiency, top priority | Maximize allocation |
| Q3: Low RPS × Low CVR | Largest improvement room, withdrawal candidate | Reduce budget or rebuild LP |
| Q4: Low RPS × High CVR | CVR trap zone | AOV-lifting initiatives |
The decision flow is three steps: (1) compute monthly RPS and CVR for each ad channel, (2) plot into the four quadrants, and (3) for Q4 channels, judge as "not eligible for budget allocation unless AOV is lifted" instead of "keep because CVR is high."
Q4 is the most easily misjudged as "good channel because CVR is high," but most fall into one of the three traps. There is also the possibility of RPS being underestimated due to attribution distortion, in which case The Last-Click Trap is recommended reading. The position of the four-quadrant view inside a full dashboard design is covered in Revenue Dashboard Design.
5. Practical Application: Monthly Ad Budget Review#
In monthly ad budget review meetings, follow this order.
- Revenue: Outcome metric, overall picture
- RPS: Primary axis for cross-channel comparison
- AOV and CVR: Decomposition of why RPS moved
- Sessions: Inflow scale check
Treat CVR as a supporting metric and enforce a rule that CVR alone never drives budget decisions.
FAQ#
Q1. Should RPS or CVR take priority?
A. RPS first. CVR is one component of RPS (RPS = AOV × CVR), and the composite RPS is what directly connects to revenue.
Q2. Why does CVR rise but revenue stay flat?
A. AOV is likely dropping. Bundle discounts, low-price funneling, and aggressive coupons frequently produce the pattern "CVR up while AOV down keeps RPS flat or falling."
Q3. What is the industry average for RPS?
A. RPS varies significantly by industry and AOV, so monthly trends and cross-channel comparisons within your own business are more practically useful than industry averages.
Q4. Should we stop looking at CVR?
A. No. CVR is useful for diagnosing the purchase flow on your LP. The argument of this article is that CVR should not be the primary axis for ad budget allocation.
The Japanese B2C EC market reached ¥26.1 trillion in 2024 [3], and the quality of ad budget allocation directly drives business growth. Migrating from CVR-only judgment to RPS-as-primary requires only a KPI configuration change in your dashboard. To deploy a Revenue First dashboard in 5 minutes, please use our free trial.
References#
[1] Google "Analytics dimensions and metrics — Average purchase revenue per user" 2025
[2] Baymard Institute "E-Commerce Cart & Checkout Usability Research" 2024
[3] Ministry of Economy, Trade and Industry "FY2024 Survey on E-Commerce Market" August 2025
See which ads actually drive revenue, at a glance
Free up to 5,000 sessions/month, AI analyst included. No credit card required. Up and running in 5 minutes.
Start measuring for free