Open GA4 and the left menu lines up "Reports," "Explore," and "Advertising," and inside Reports the screens go on and on — Summary, Realtime, Acquisition, Engagement, Monetization, and more. You can't tell where to look every day, so you stop opening it. That's the first place ecommerce operators get stuck with GA4. The short answer: there are only three reports ecommerce needs to check daily. This article lays out where those three live and which columns to read. Then, when you try to go further — to "which channel deserves your next budget" — looking at the three separately isn't enough, and I'll cover where GA4's structural wall sits.
Table of contents
TL;DR#
-
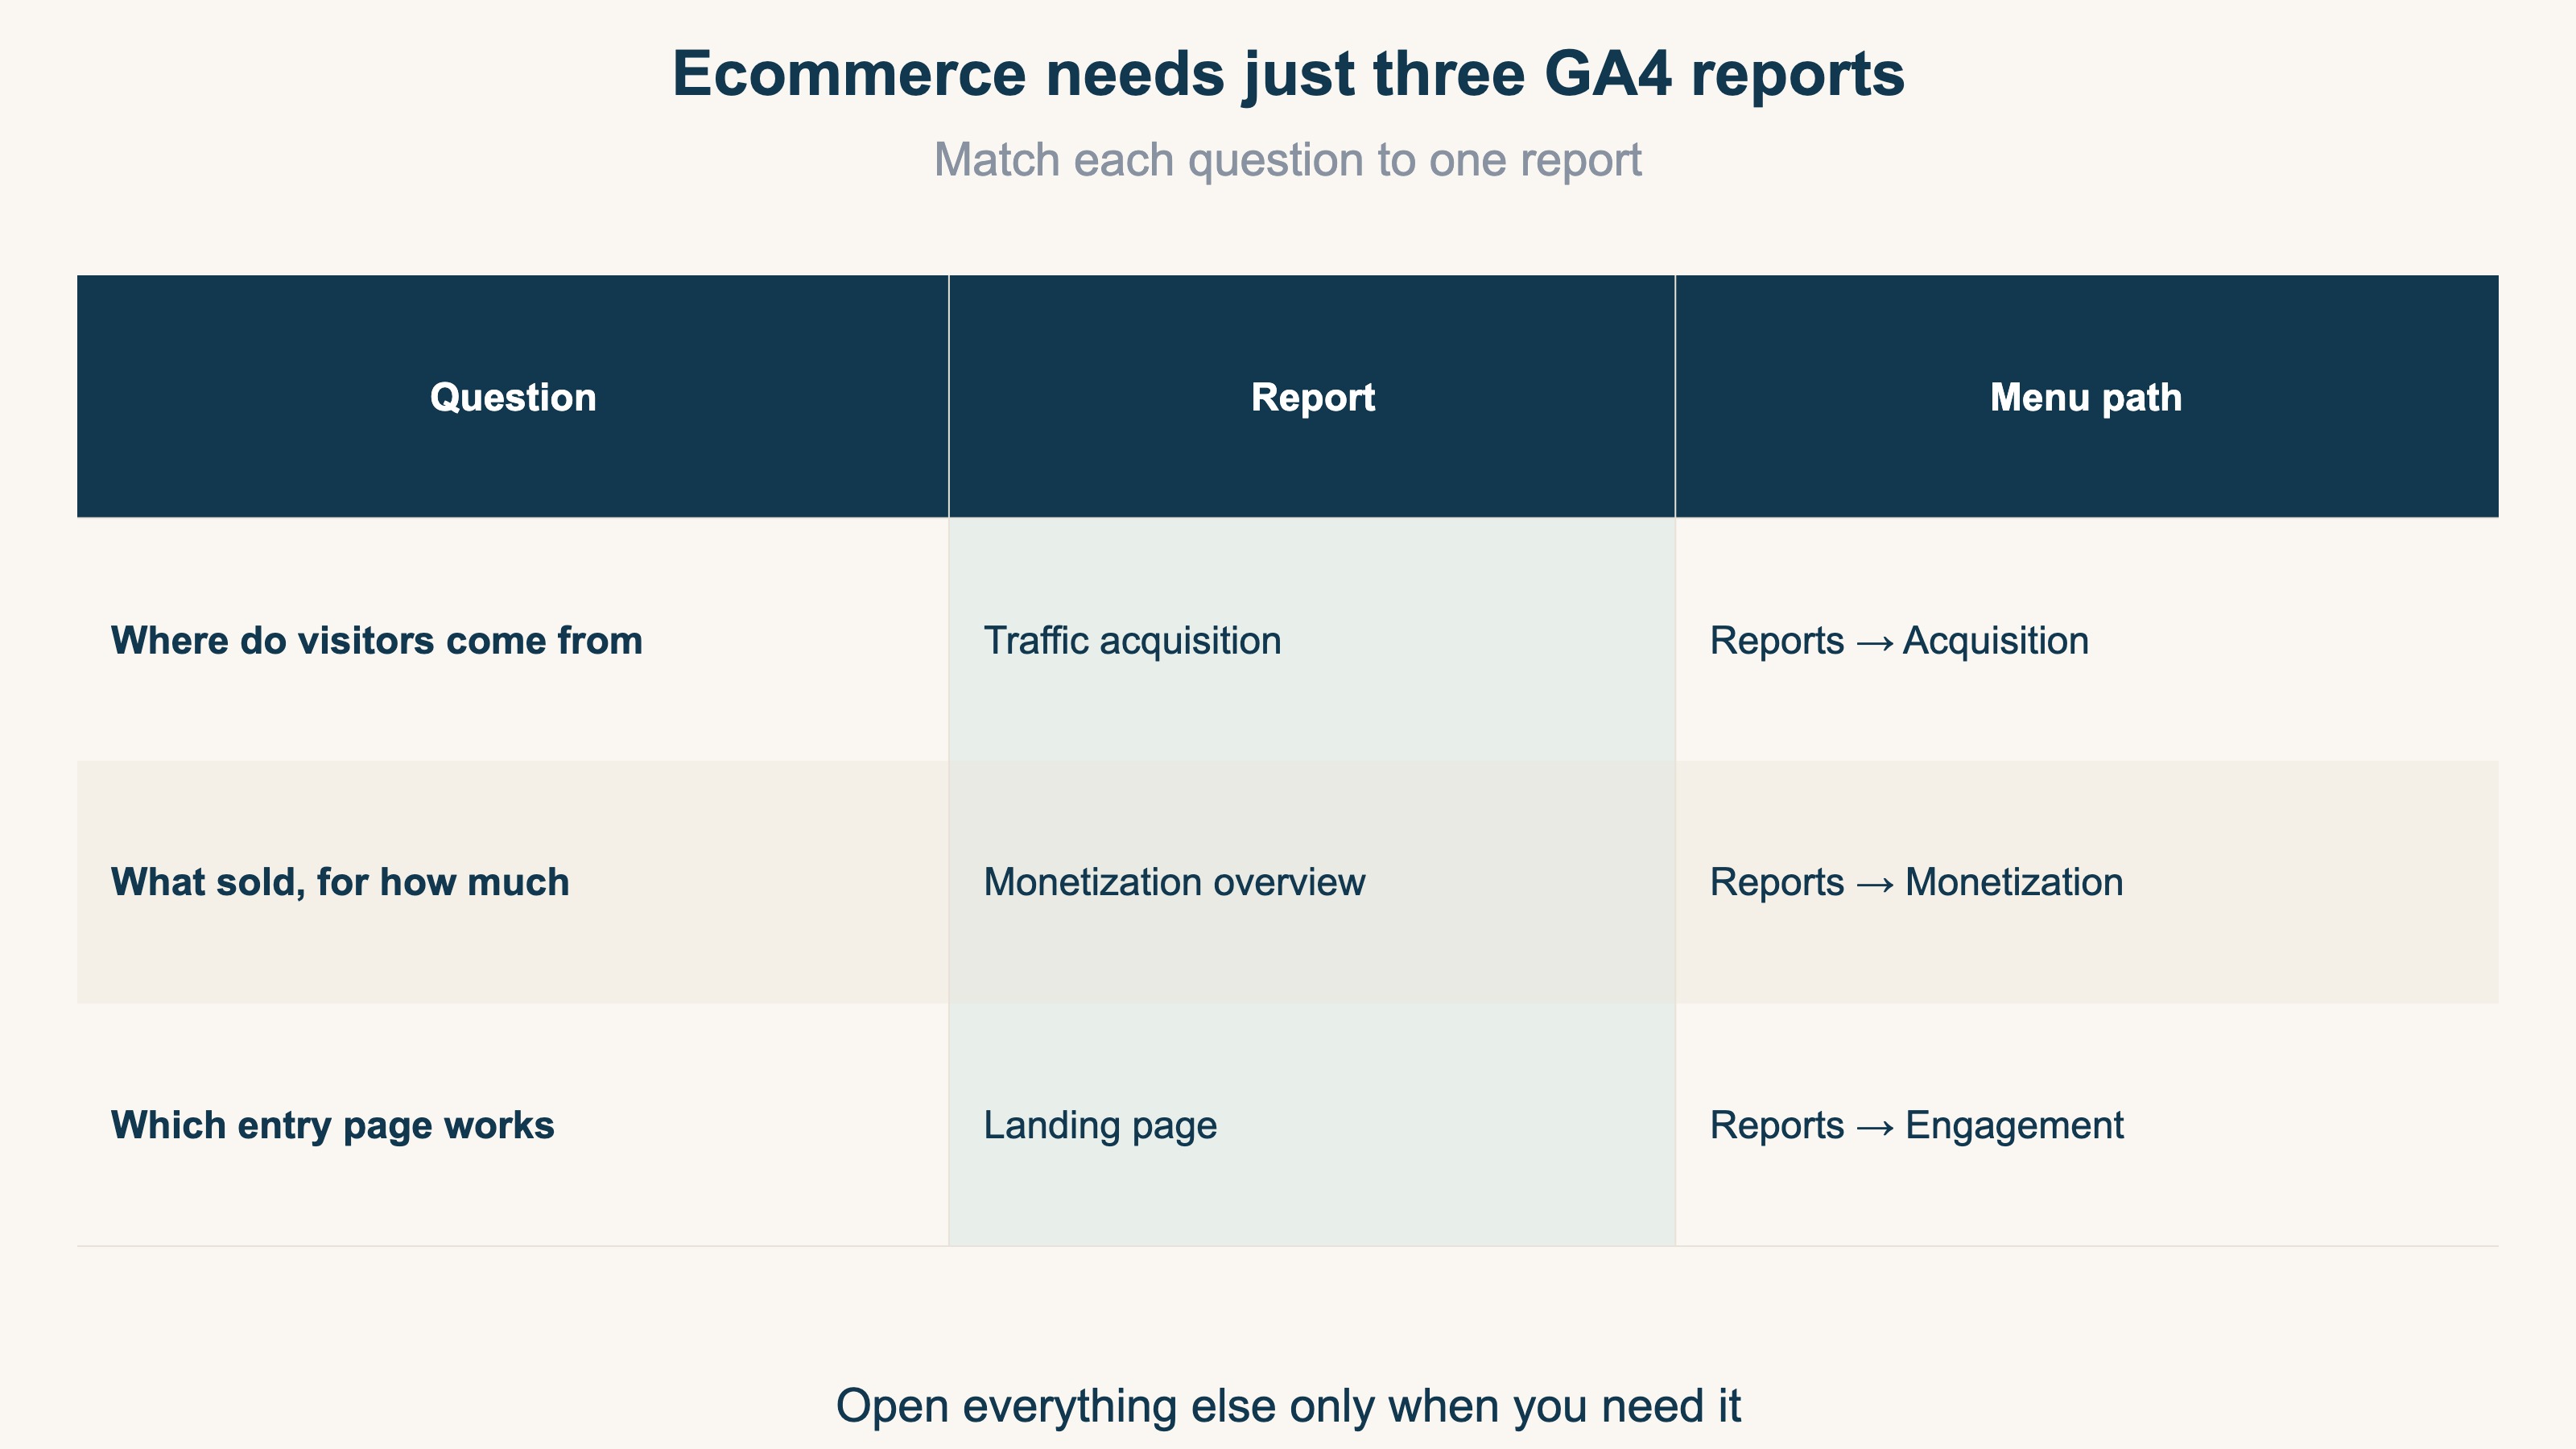
Ecommerce needs only three GA4 reports daily
- "Traffic acquisition" = where people came from
- "Monetization overview (Ecommerce purchases)" = what sold and for how much
- "Landing pages" = which entry page drove revenue
-
Don't try to read every report
Most GA4 reports aren't used directly for ecommerce revenue decisions. For anything outside the three, "open it when you need it" is enough
-
Reading the three separately won't tell you where to invest
Which channel to fund is something you can only judge by lining up per-channel revenue efficiency on real, bot-excluded visits. GA4's standard reports can't display that on one screen
-
GA4 shows the entrances to your traffic. Comparing revenue efficiency is a separate wall
The three build the "looking habit." Where most people stall is the next step — connecting them to make an investment call
1. Why GA4 feels like a maze (ecommerce needs only a few reports)#
Bottom line: GA4 is a general-purpose tool for every industry, so only a small part of it matters for ecommerce. Trying to see everything is what gets you lost.
GA4's reports are built to work for any industry — blogs, apps, B2B sites, ecommerce. That's why the menu is so large. Flip it around, and only a small part relates directly to ecommerce revenue decisions.
The questions an ecommerce operator wants answered daily boil down to three:
- Where did people come from (is acquisition working)
- What sold, and for how much (how is this month's revenue)
- Which entry drove revenue (which page / which source to strengthen)
One report answers each of these three. Everything else — Realtime, user demographics, tech environment, and so on — you can open when you're troubleshooting or digging deeper. Deciding "I only check three every day" is the first step to actually keeping GA4 open.
2. The three reports to watch — location and columns to read#
Bottom line: "Traffic acquisition," "Monetization overview," and "Landing pages." Learn just the location and the columns to read, and you can run the loop in five minutes a day.
Menu names reflect GA4's labels as of June 2026. Depending on your property settings, the menu layout may differ (reports that aren't shown can be added from the Report library).
① Traffic acquisition — where people came from
Location: Reports → Acquisition → Traffic acquisition.
Sessions line up by "Session default channel group." What's counted here is "how many times people came to the site" — a session — which is different from "event count," which counts each action like a page view or a click (Event count vs. session count). You read "which source grew this week" by channel: Organic Search, Paid Search, Organic Social, Direct, and so on. One caveat: traffic that lost its UTM parameters (the tags that identify the source) gets miscounted as Direct. If Direct is unnaturally high, suspect a measurement-side problem — see Five causes of rising GA4 "Direct / (none)" and the fix order.
② Monetization overview (Ecommerce purchases) — what sold and for how much
Location: Reports → Monetization → Monetization overview (for a product breakdown, "Ecommerce purchases").
You see total revenue, number of buyers, and average purchase revenue. For "which product sold, how many units, for how much," use "Ecommerce purchases." As a prerequisite, ecommerce measurement (the purchase event) has to be set up. If it isn't yet, start with Finish your GA4 ecommerce setup in 30 minutes — Shopify edition. Also, GA4 revenue normally differs from your cart or Shopify admin by a few percent. The reasons are covered in Why GA4 revenue doesn't match Shopify.
③ Landing pages — which entry drove revenue
Location: Reports → Engagement → Landing page.
By the page visitors first land on, you get sessions and key events (formerly "conversions," renamed in 2024 — see Conversions vs. key events). For ecommerce, this gives you a read on "which product page or article works as an entry that drives revenue." Compare sessions and key events per entry page and you start to see "pages with lots of traffic but little movement" versus "unassuming pages that actually convert."
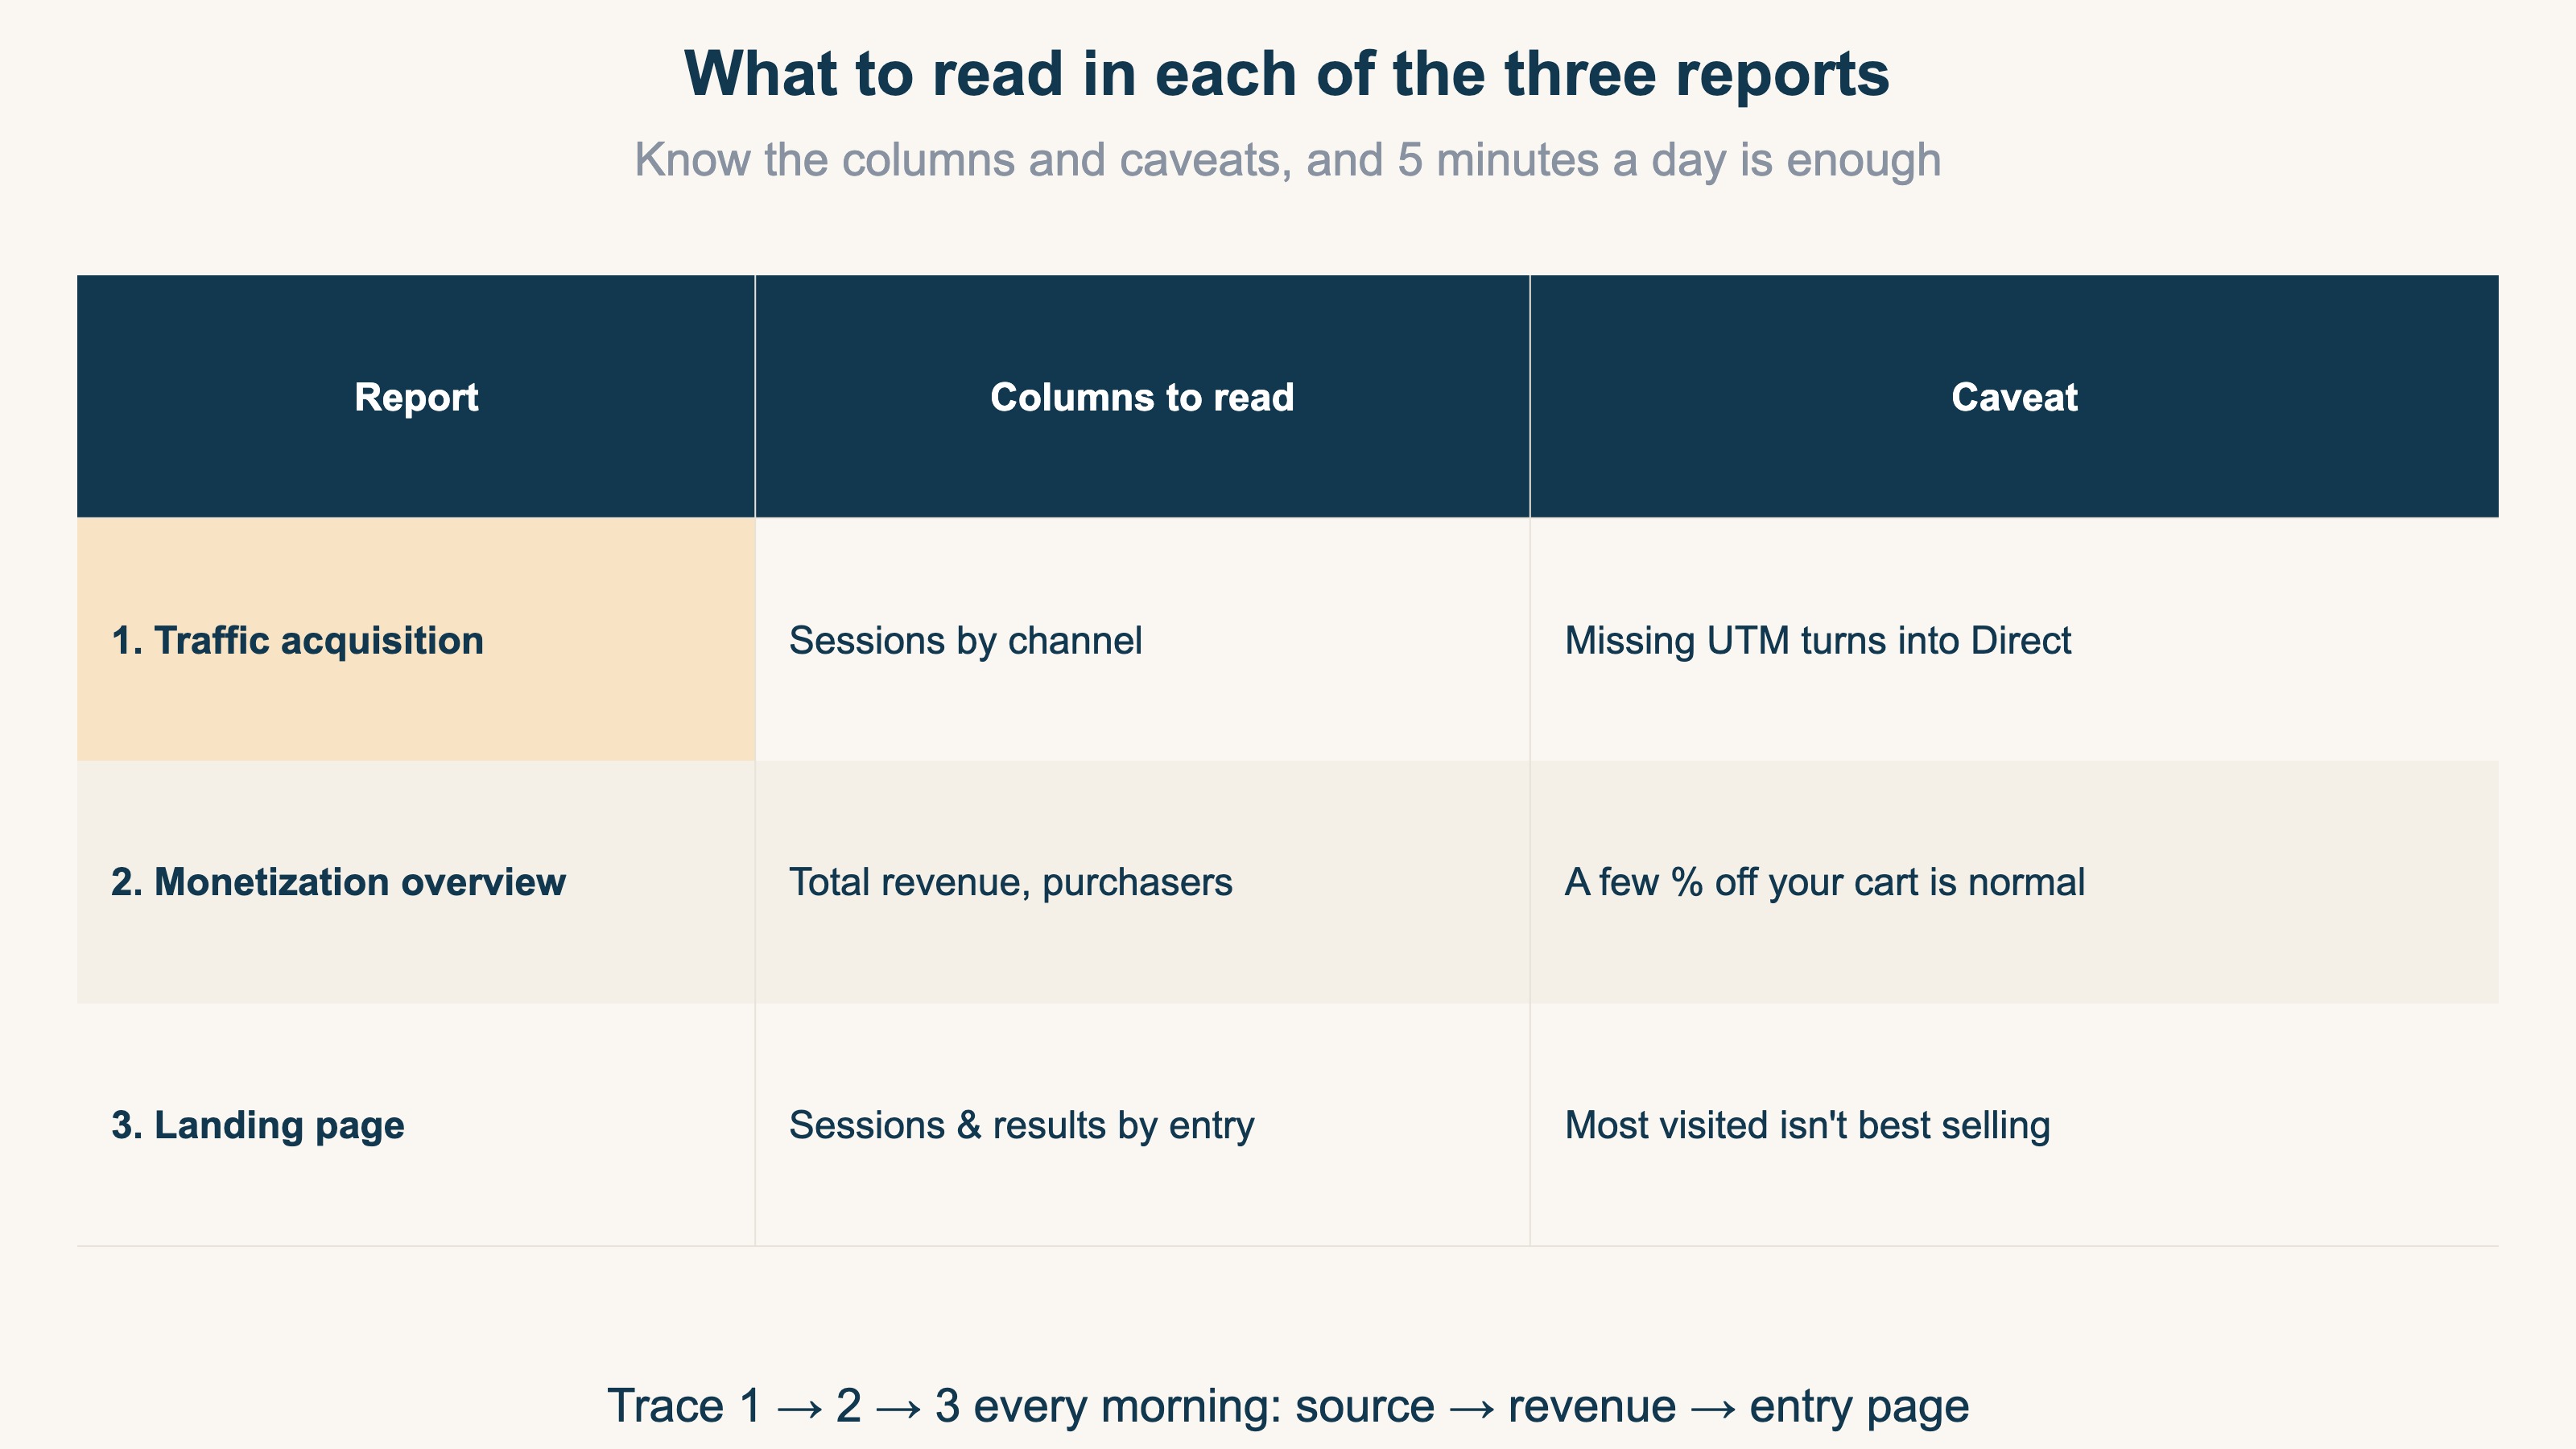
Make these three a morning routine and you can trace the whole revenue picture in five minutes: ① where they came from → ② what sold → ③ which entry worked. Start by turning this loop into a "looking habit."
3. Three reports alone won't tell you where to invest#
Bottom line: Reading the three separately won't tell you "which channel to fund next." For that you need to see per-channel revenue efficiency together on real, bot-excluded visits — and that's GA4's structural wall.
Read the three reports separately and you can keep a daily pulse. But investment decisions — which channel gets your ad spend and effort — are a different story.
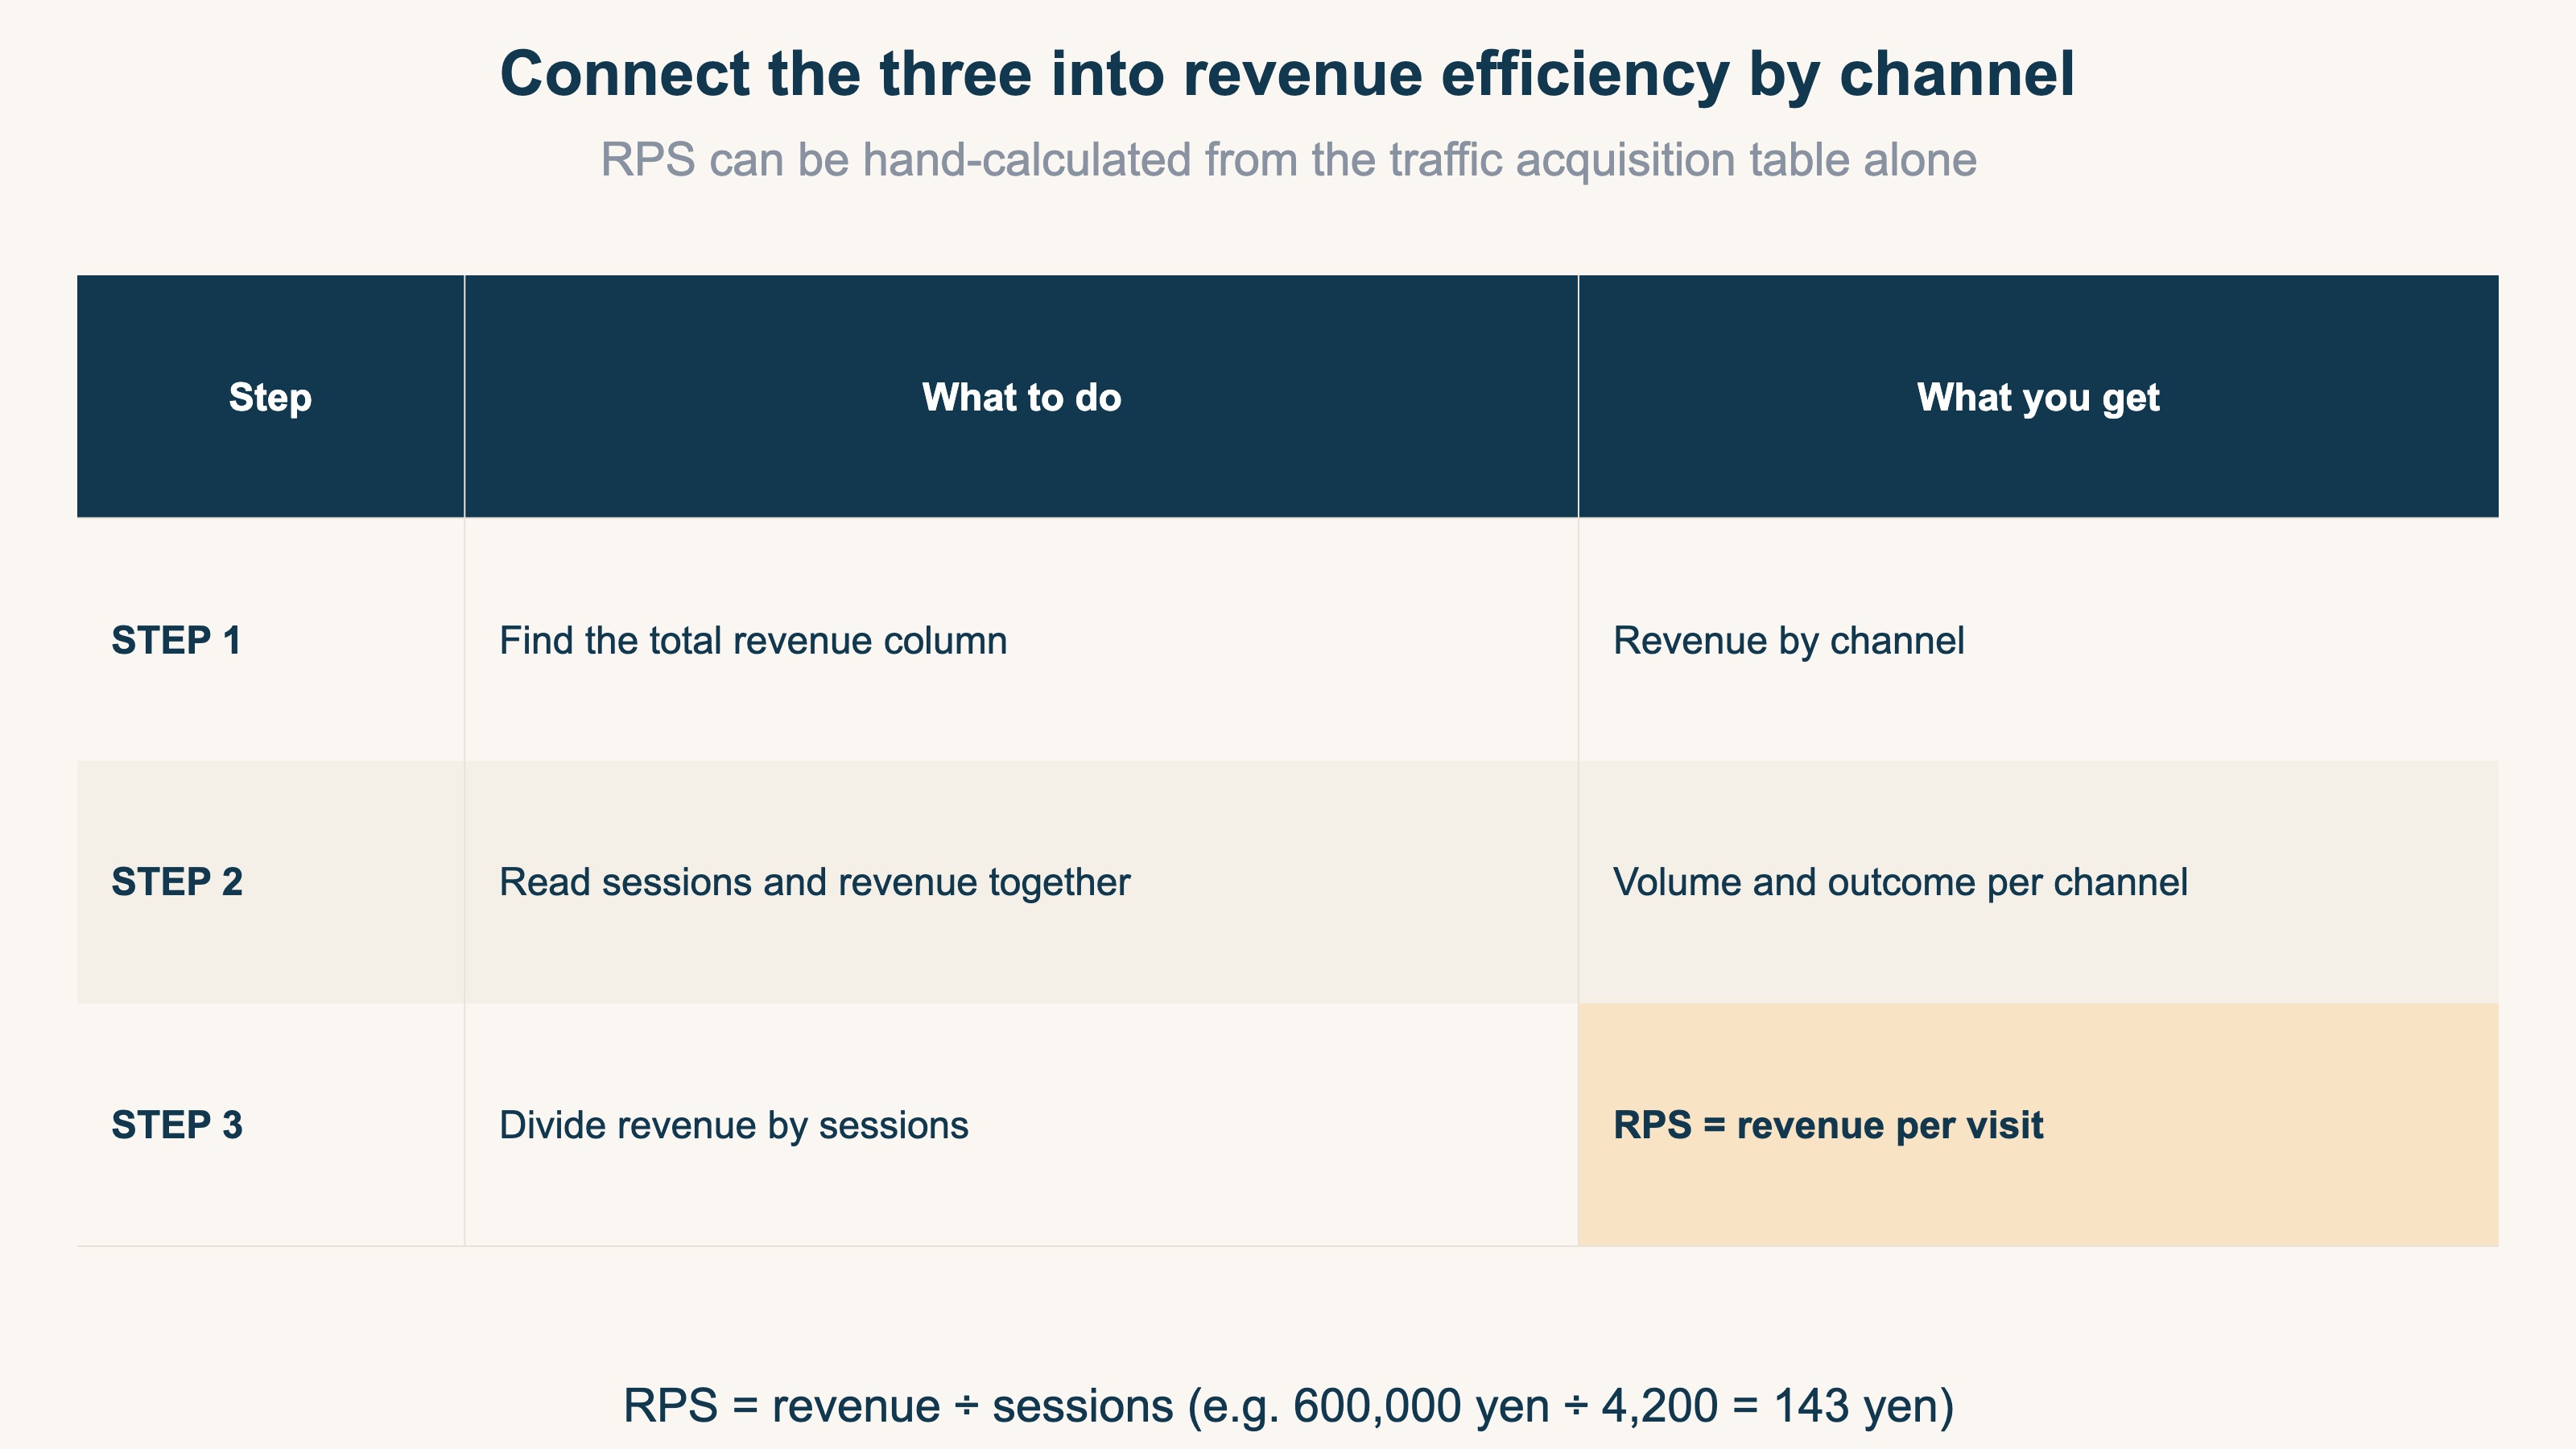
What you want to judge is, for example: between organic search and paid social, which sells more per visit? Which channel gets lots of traffic but converts weakly into revenue? To answer that, you want to line up, per channel, "revenue ÷ sessions" = RPS (revenue per session). What RPS means and how to compute it is in What is RPS: the metric for comparing ad channels, its formula, and how to get it in GA4.
The idea is a single division — not hard. The problem is that GA4's standard reports don't display this "per-channel revenue efficiency" list on one screen. There are three walls:
- Revenue efficiency isn't the star: Traffic acquisition is a session-count screen; it isn't built to show per-channel RPS side by side. You have to add the revenue column and do the division yourself
- Bots inflate sessions: When crawlers and automated hits mix in, a channel's sessions look larger than reality, and RPS (revenue ÷ sessions) falls below its true value. You want to compare on real visits only, but the standard screens make that hard to separate out
- The Direct problem strips revenue off channels: Payment-domain hops and UTM loss cause revenue that ads or search actually brought in to be absorbed into Direct. Then that channel's RPS reads lower than reality (Causes of rising GA4 "Direct / (none)" and the fix order)
The ingredients are scattered across the three reports, and the screen that connects them for an investment call doesn't come out of standard GA4. And having to redo it across channels every week means that, even though the division itself is easy, the cross-screen assembly weighs on you each time. It's fine to add a revenue column to your Traffic acquisition table once, divide, and get a feel for RPS. But running this by hand as "the foundation for weekly investment decisions" hits a structural limit.
RevenueScope solution
Bottom line: "Which channel sold how much per real visit" — the one screen you'd assemble by connecting the three reports — is what RevenueScope displays on a single screen from the start.
Loop the three reports daily, add the revenue column, and hand-build per-channel RPS while worrying about bot and Direct distortion — this "connecting" work is the number-one reason GA4 operation doesn't stick. You know what to do, but the cross-screen effort recurs every time.
RevenueScope puts what this article described — "where they came from" (sessions by channel), "what sold" (measured revenue by channel), and "which source sold efficiently" (RPS by channel) — on one screen from the start. And because the numbers exclude bots based on behavior, you compare on a real-visit basis (tallied with our own deduplicated tracking). The per-channel revenue efficiency GA4 makes hard to assemble on one screen, RevenueScope displays together the moment you open it.
For example, open the RevenueScope dashboard and you see this:
| Channel | Sessions | Revenue | RPS |
|---|---|---|---|
| Organic Search (Google) | 814 | ¥247,569 | ¥304 |
| Direct | 485 | ¥276,504 | ¥570 |
| Meta Ads | 419 | ¥55,441 | ¥132 |
| Google Ads | 302 | ¥35,327 | ¥116 |
| ChatGPT | 210 | ¥130,633 | ¥622 |
Figures from a fictional sample site (RevenueScope measurement, deduplicated; differs from GA4 by a few percent).
This one screen earns its keep when you compare side by side. Meta Ads has more sessions than Google Ads or ChatGPT, yet its RPS, at ¥132, is the lowest. ChatGPT, conversely, has few visits but sells the most per visit. "More traffic = more effective" isn't necessarily true — and that's a decision input you only see once it's lined up side by side. In GA4 terms, the state you'd reach after finishing "Traffic acquisition + revenue column + hand-calculated RPS" is your starting screen the moment you open it.
Connect your ad accounts on top of this and you can go further — into measured ROAS by channel and saturation (whether there's room to increase spend) (computed on a revenue basis, only for channels whose ad spend you've linked). For which number to move budget on, see The three types of ROAS and when to use each.
Build the "looking habit" with the three-report GA4 loop, and when it's time to connect them for an investment call, hand it to one screen. That's the realistic path to keep watching the numbers and actually move budget.
FAQ#
Frequently asked questions#
Q. Do I not need "Explore (Explorations)"?
A. Not at first. Explore is a powerful feature that lets you build tables freely, but it demands design knowledge to match. Build the "looking habit" with the three standard reports first, and only learn Explore when you need a combination the standard reports can't line up. That order is less likely to make you give up.
Q. Can't GA4 alone produce per-channel RPS?
A. It's not that it can't. Add a revenue column to Traffic acquisition and compute revenue ÷ sessions per channel, and you'll get the number on the spot. But bot contamination and the Direct problem distort the numerator and denominator, and reassembling this across channels every week is structurally heavy with the standard reports as they are. It's enough to try once and get a feel — but as a foundation for ongoing investment decisions, you need a different mechanism.
Q. Do I have to check daily? Is once a week not enough?
A. It depends on revenue scale. At a few orders a day, daily swings are noisy, so once a week is enough. What matters is less the frequency than "watching the same three in the same order." Once it's a fixed observation, you notice "this is different from usual" when something's off.
Wrap-up#
You get lost in GA4 because you try to see every menu of a general-purpose tool. What ecommerce should check daily is just three: "Traffic acquisition" (where they came from), "Monetization overview" (how much sold), and "Landing pages" (which entry worked). Build the habit of viewing these three in the same order first.
Beyond that, when you try to decide "which channel gets your next budget," you hit the wall of GA4's standard reports. Per-channel revenue efficiency, side by side on real, bot-excluded visits — that's what doesn't come out on one screen. Compute RPS by hand once to get a feel, and hand the repeated investment decisions to one screen. The moment you can see "a channel with lots of traffic but low efficiency" is the moment GA4 turns from a screen you "watch" into a tool you "decide" with.
See which ads actually drive revenue, at a glance
Free up to 5,000 sessions/month, AI analyst included. No credit card required. Up and running in 5 minutes.
References#
[1] Google Analytics Help "About sessions in Analytics" (2026)
[2] Google Analytics Help "About key events" (2026)
[3] Google Analytics Help "About GA4 events" (2026)