
"GA4 shows ¥150,000 less revenue than my Shopify admin. Which one is right?" This is a question we hear almost every month from EC operators reconciling their month-end numbers.
The short answer: GA4 normally reports less than Shopify, and you cannot make them match to the yen. The cause sits in how measurement works, so even after you fix it, the gap returns. What matters is not forcing the absolute totals to match, but using GA4 — assuming the gap — as a ruler for comparing per-channel efficiency.
Table of contents
TL;DR#
- GA4 reporting less than Shopify is normal. Checkout tracking gaps, consent-mode opt-outs, and reporting-timing differences are the main causes, with a gap of a few to low-double-digit percent being typical. GA4 is not "accurately lower" — the measurement design simply drops some data.
- Do not chase an exact match. Trying to reconcile to the yen is a swamp. Treat Shopify (or your payment system) as the source of truth for revenue, and treat GA4 as a tool for comparing trends across channels and pages.
- Decide with per-channel relative efficiency. Even when the absolute totals are off, the ranking of revenue per session (RPS) across channels is reliable in GA4. Decide your next budget by this relative efficiency, not by absolute sales volume.
1. Five reasons GA4 revenue doesn't match Shopify#
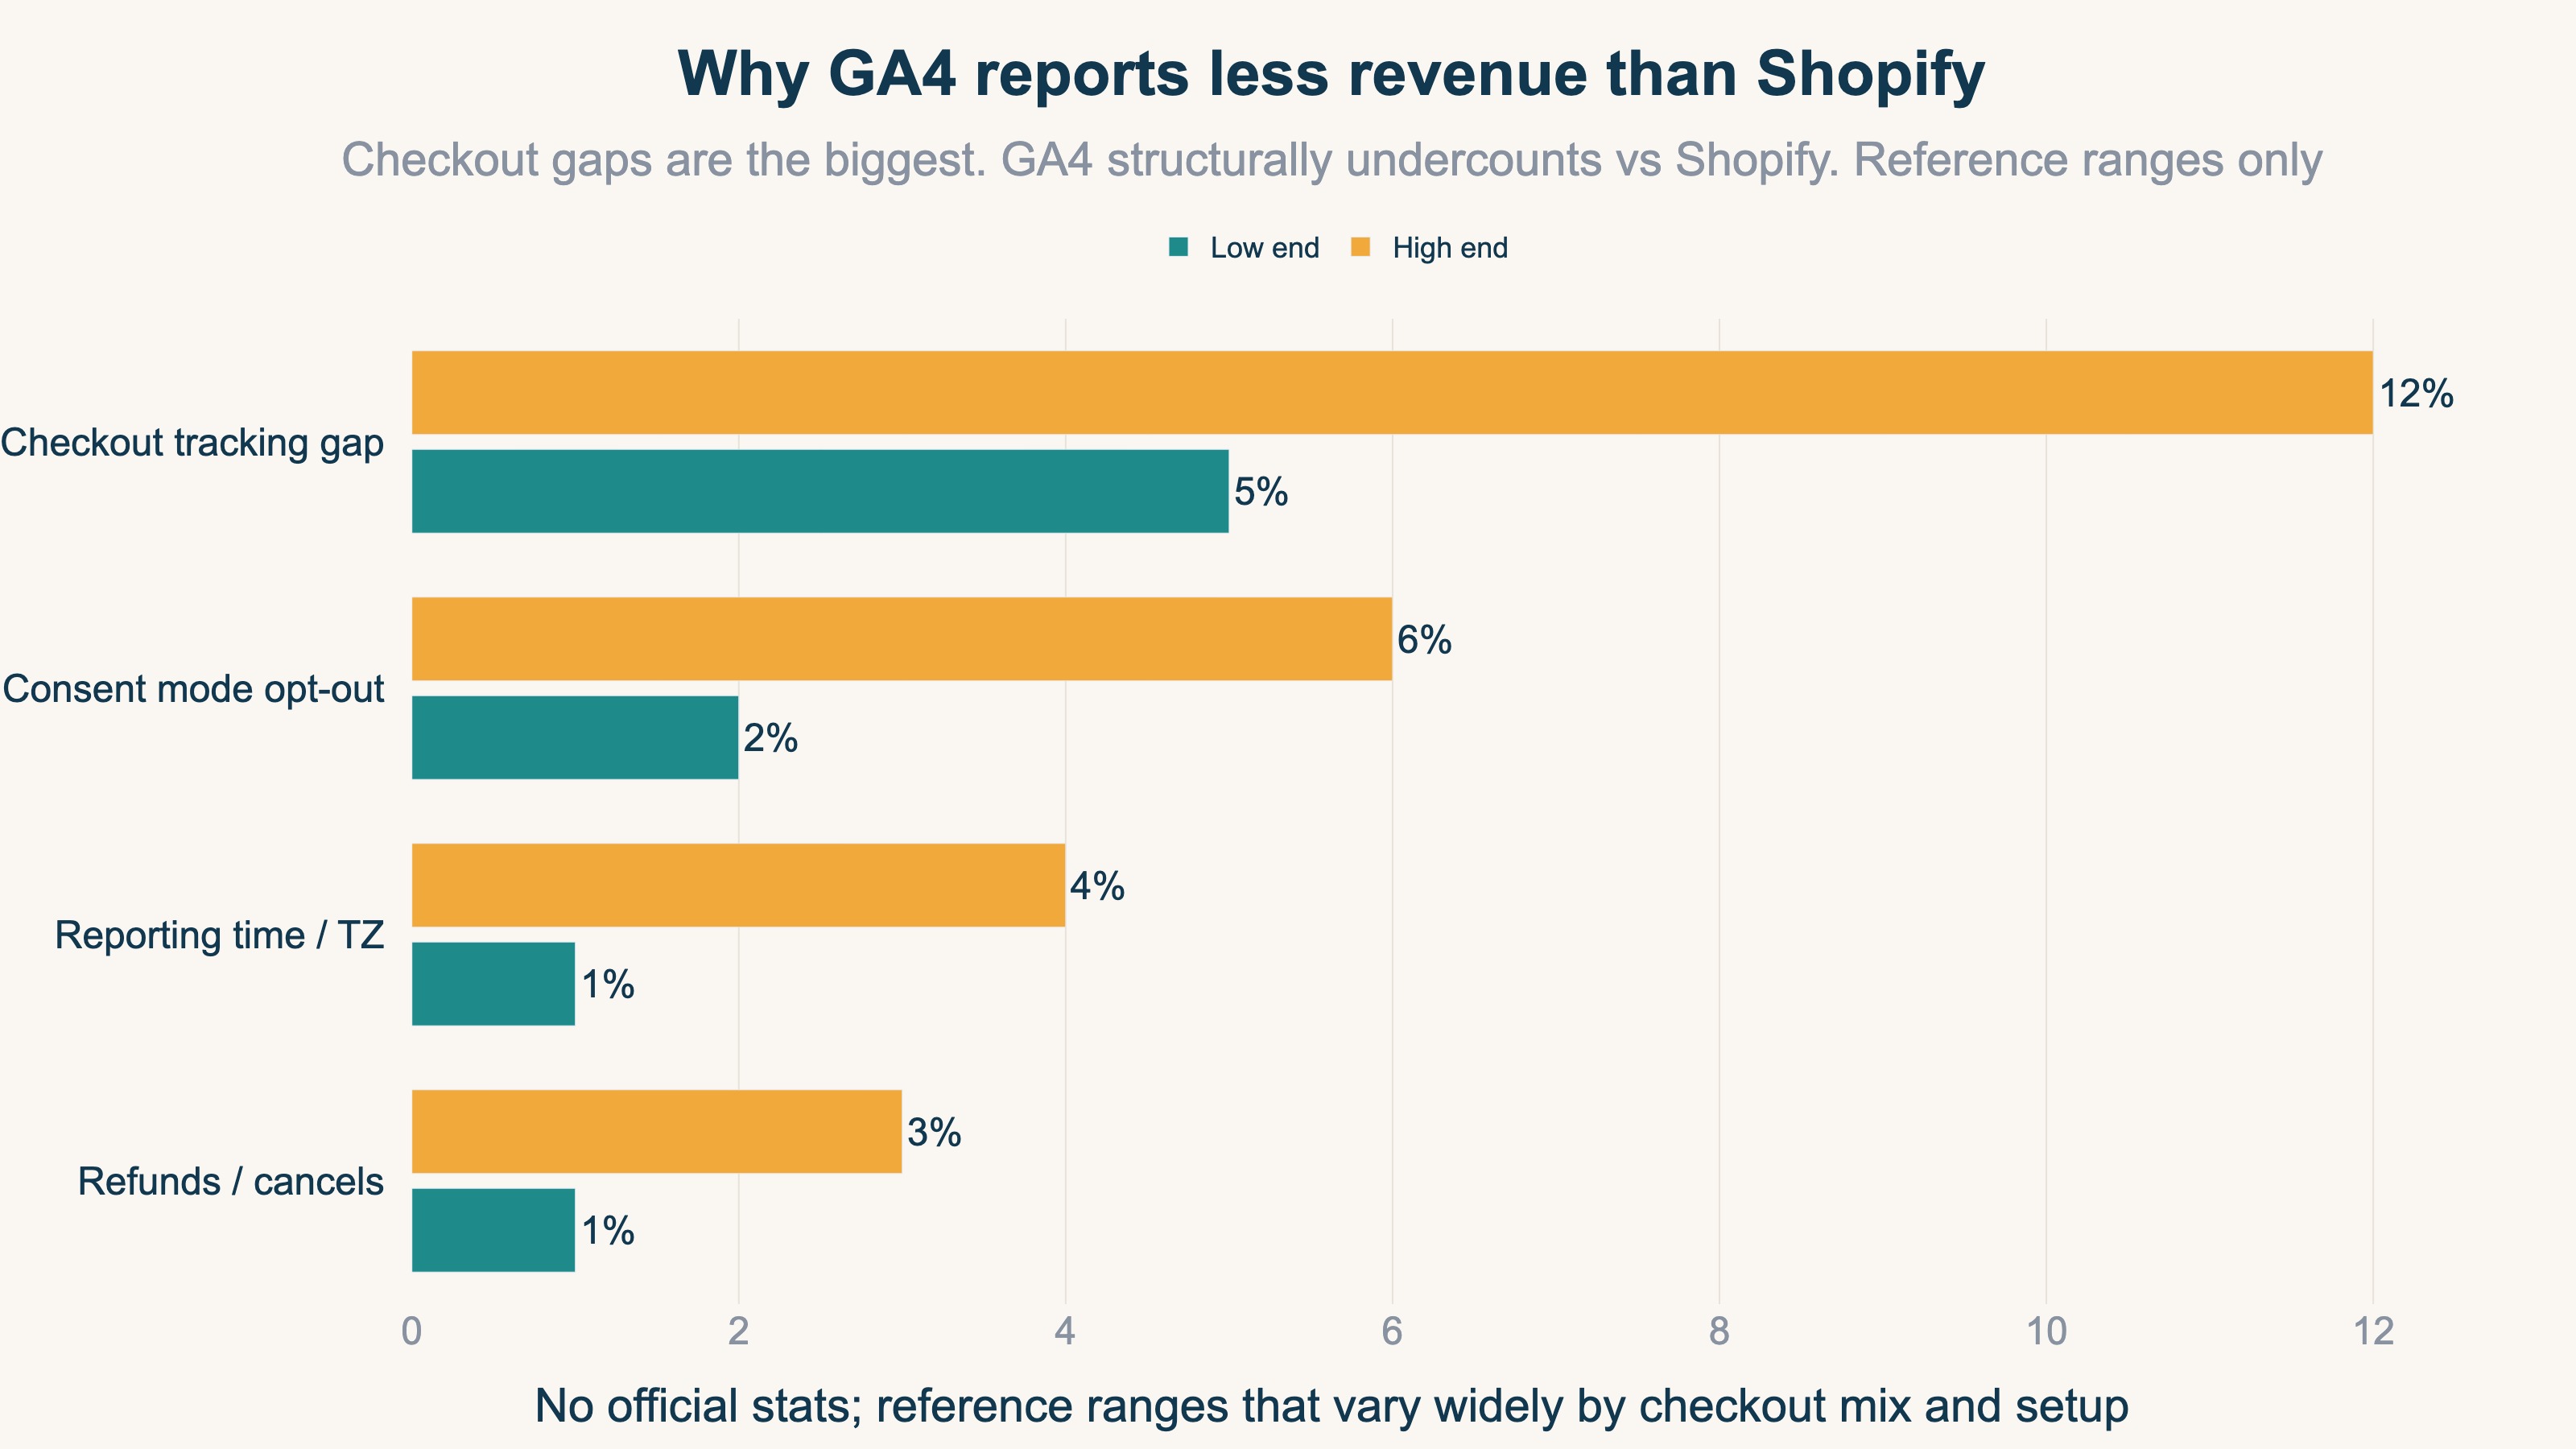
Bottom line: by design, GA4 reports less than Shopify. There are five main causes.
| Cause | What happens | Direction |
|---|---|---|
| Checkout tracking gap | Shop Pay, Apple Pay and other checkouts that skip the thank-you page, or JS-disabled/early exits, don't fire the tag | GA4 lower |
| Consent mode | Purchases from visitors who decline cookies aren't measured (or become modeled estimates) | GA4 lower |
| Reporting time / timezone | GA4 and the store split days on different timezones, so daily totals drift | Daily drift |
| Refunds / cancels | Shopify deducts refunds later; GA4's purchase event rarely reflects them | GA4 sometimes higher |
| Double counting | A duplicated tag counts one purchase twice | GA4 higher |
The biggest of these is the checkout tracking gap. Purchases that don't pass through Shopify's standard thank-you page — Shop Pay, Apple Pay, external payment links — don't fire GA4's purchase tag and drop entirely. The same happens with ad blockers and JS-disabled environments. That is why GA4 revenue runs a notch below Shopify in most stores. It is not a setup mistake; it is a gap that the measurement design inevitably produces.
2. How close should they be? Don't chase an exact match#
Bottom line: you cannot make the totals match exactly. The right answer is to set an acceptable range and stop chasing beyond it.
Trying to reconcile GA4 and Shopify to the yen turns into endless work: fix one setting and another cause re-opens the gap. Even professionals don't aim for an exact match. Instead, decide in advance how much of a gap you'll ignore.
| GA4 vs Shopify gap | State | Action |
|---|---|---|
| Within 5% | Normal | Ignore. Measurement is working fine |
| 5-15% | Somewhat large | Check one main cause (checkout path, consent mode) |
| Over 15% | Needs inspection | Check duplicate tags, missing purchase tag, period misalignment |
The key is a division of roles. Treat Shopify as the source of truth for accounting and billing. GA4, meanwhile, is a tool for reading the trend of the breakdown — by channel, by page, by source. They are numbers for different purposes, so there is no need to force one toward the other. See GA4 ecommerce setup checklist for Shopify for fixing reducible tracking gaps.
3. Why channels diverge — the attribution difference#
Bottom line: per-channel revenue diverges because the rule for "which channel gets credit for an order" differs between the two.
Looking by channel, not just the total, the gap widens further. This comes from a difference in attribution. Shopify generally credits the entire order to the last source the visitor came from. GA4's default is data-driven attribution, which splits one order across the contributing channels in fractions.
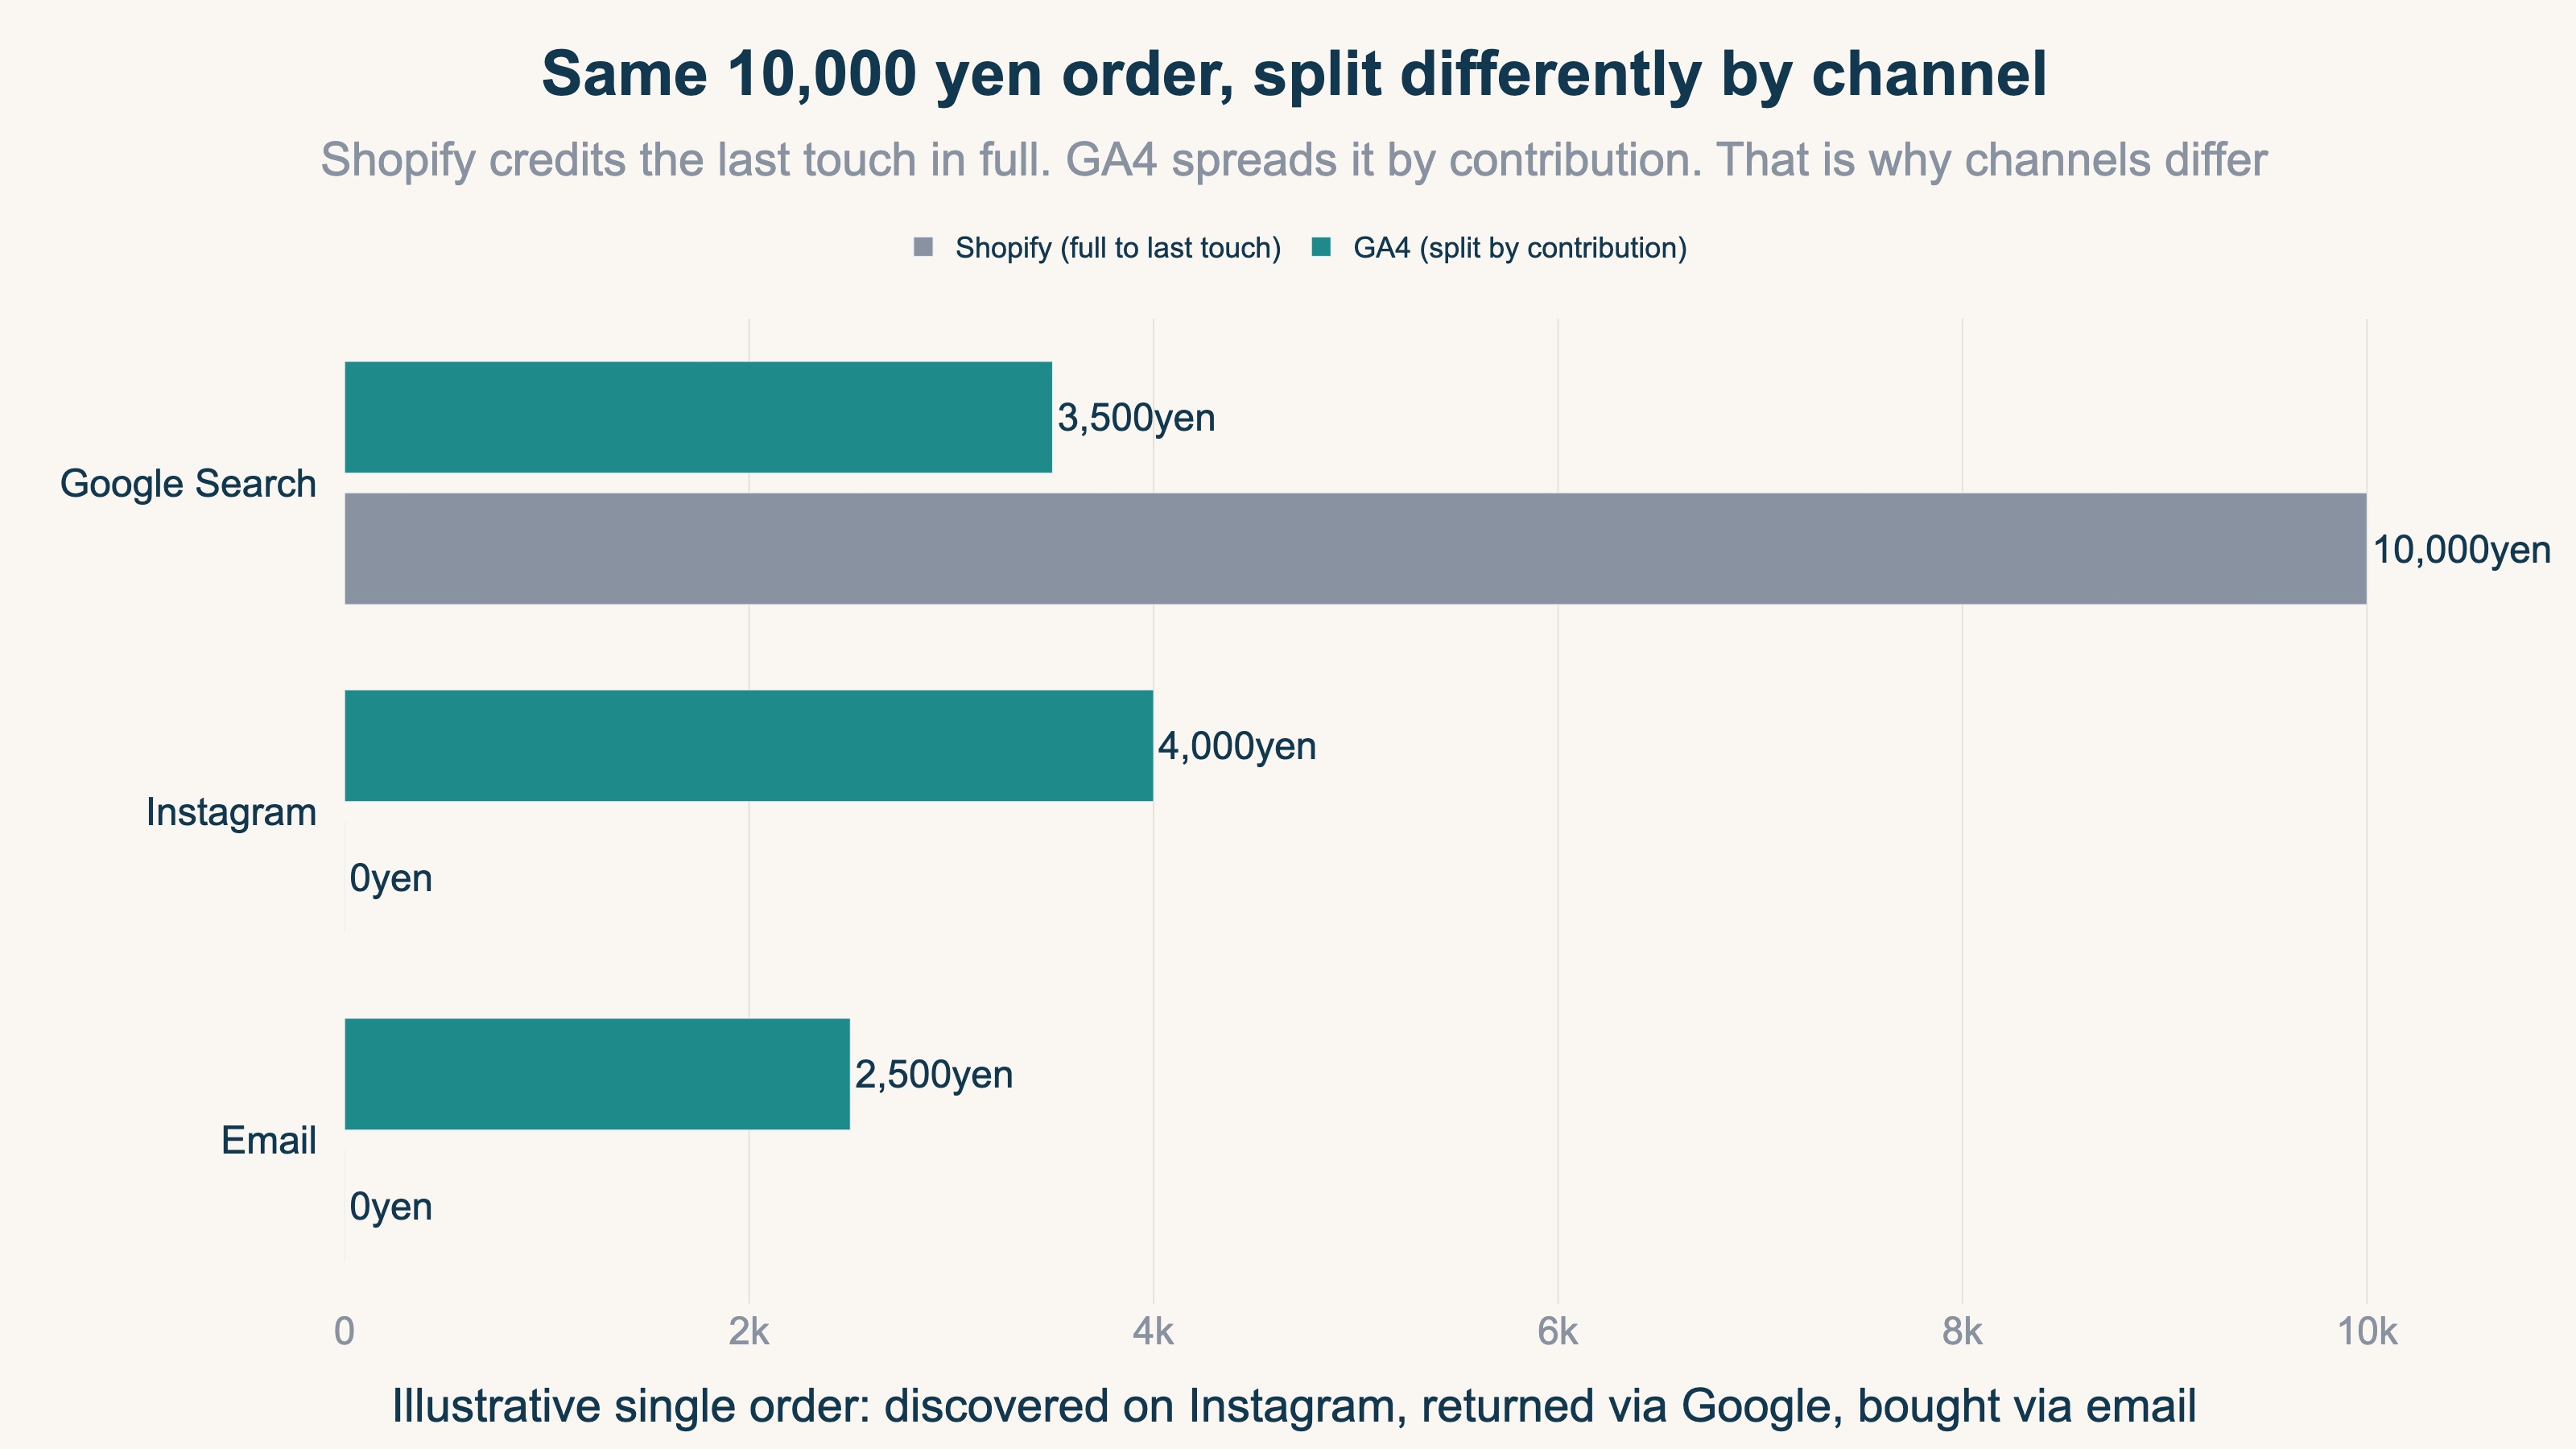
Say a ¥10,000 order followed the path "discovered via an Instagram ad → returned later via Google search → purchased from an email." Shopify credits the full ¥10,000 to the channel closest to the final touch. GA4 splits it by contribution: ¥4,000 to Instagram, ¥3,500 to Google search, ¥2,500 to email. The same single order naturally diverges when viewed by channel.
Neither is wrong. Shopify shows "where it finally sold," GA4 shows "how multiple channels contributed to that sale." So trying to match per-channel absolute amounts between the two is comparing fundamentally different kinds of numbers. We cover attribution thinking in Why moving budget on last-click alone loses money.
4. Decide budget assuming the gap — use per-channel relative efficiency#
Bottom line: even when absolute totals are off, the ranking of channel efficiency is reliable in GA4. Decide your next budget by this relative efficiency.
We've established that absolute totals won't match. So what do you rely on to move budget? The answer is per-channel relative efficiency — specifically, comparing revenue per session (RPS) across channels.
RPS's strength is that it is resistant to the absolute gap. Even if GA4 reports 10% low overall, comparing channels within that "10%-low world" leaves their efficiency ranking almost unchanged. So while the absolute total is unreliable, the relative ranking is trustworthy.
| Channel | Revenue per session (RPS) | How it reads |
|---|---|---|
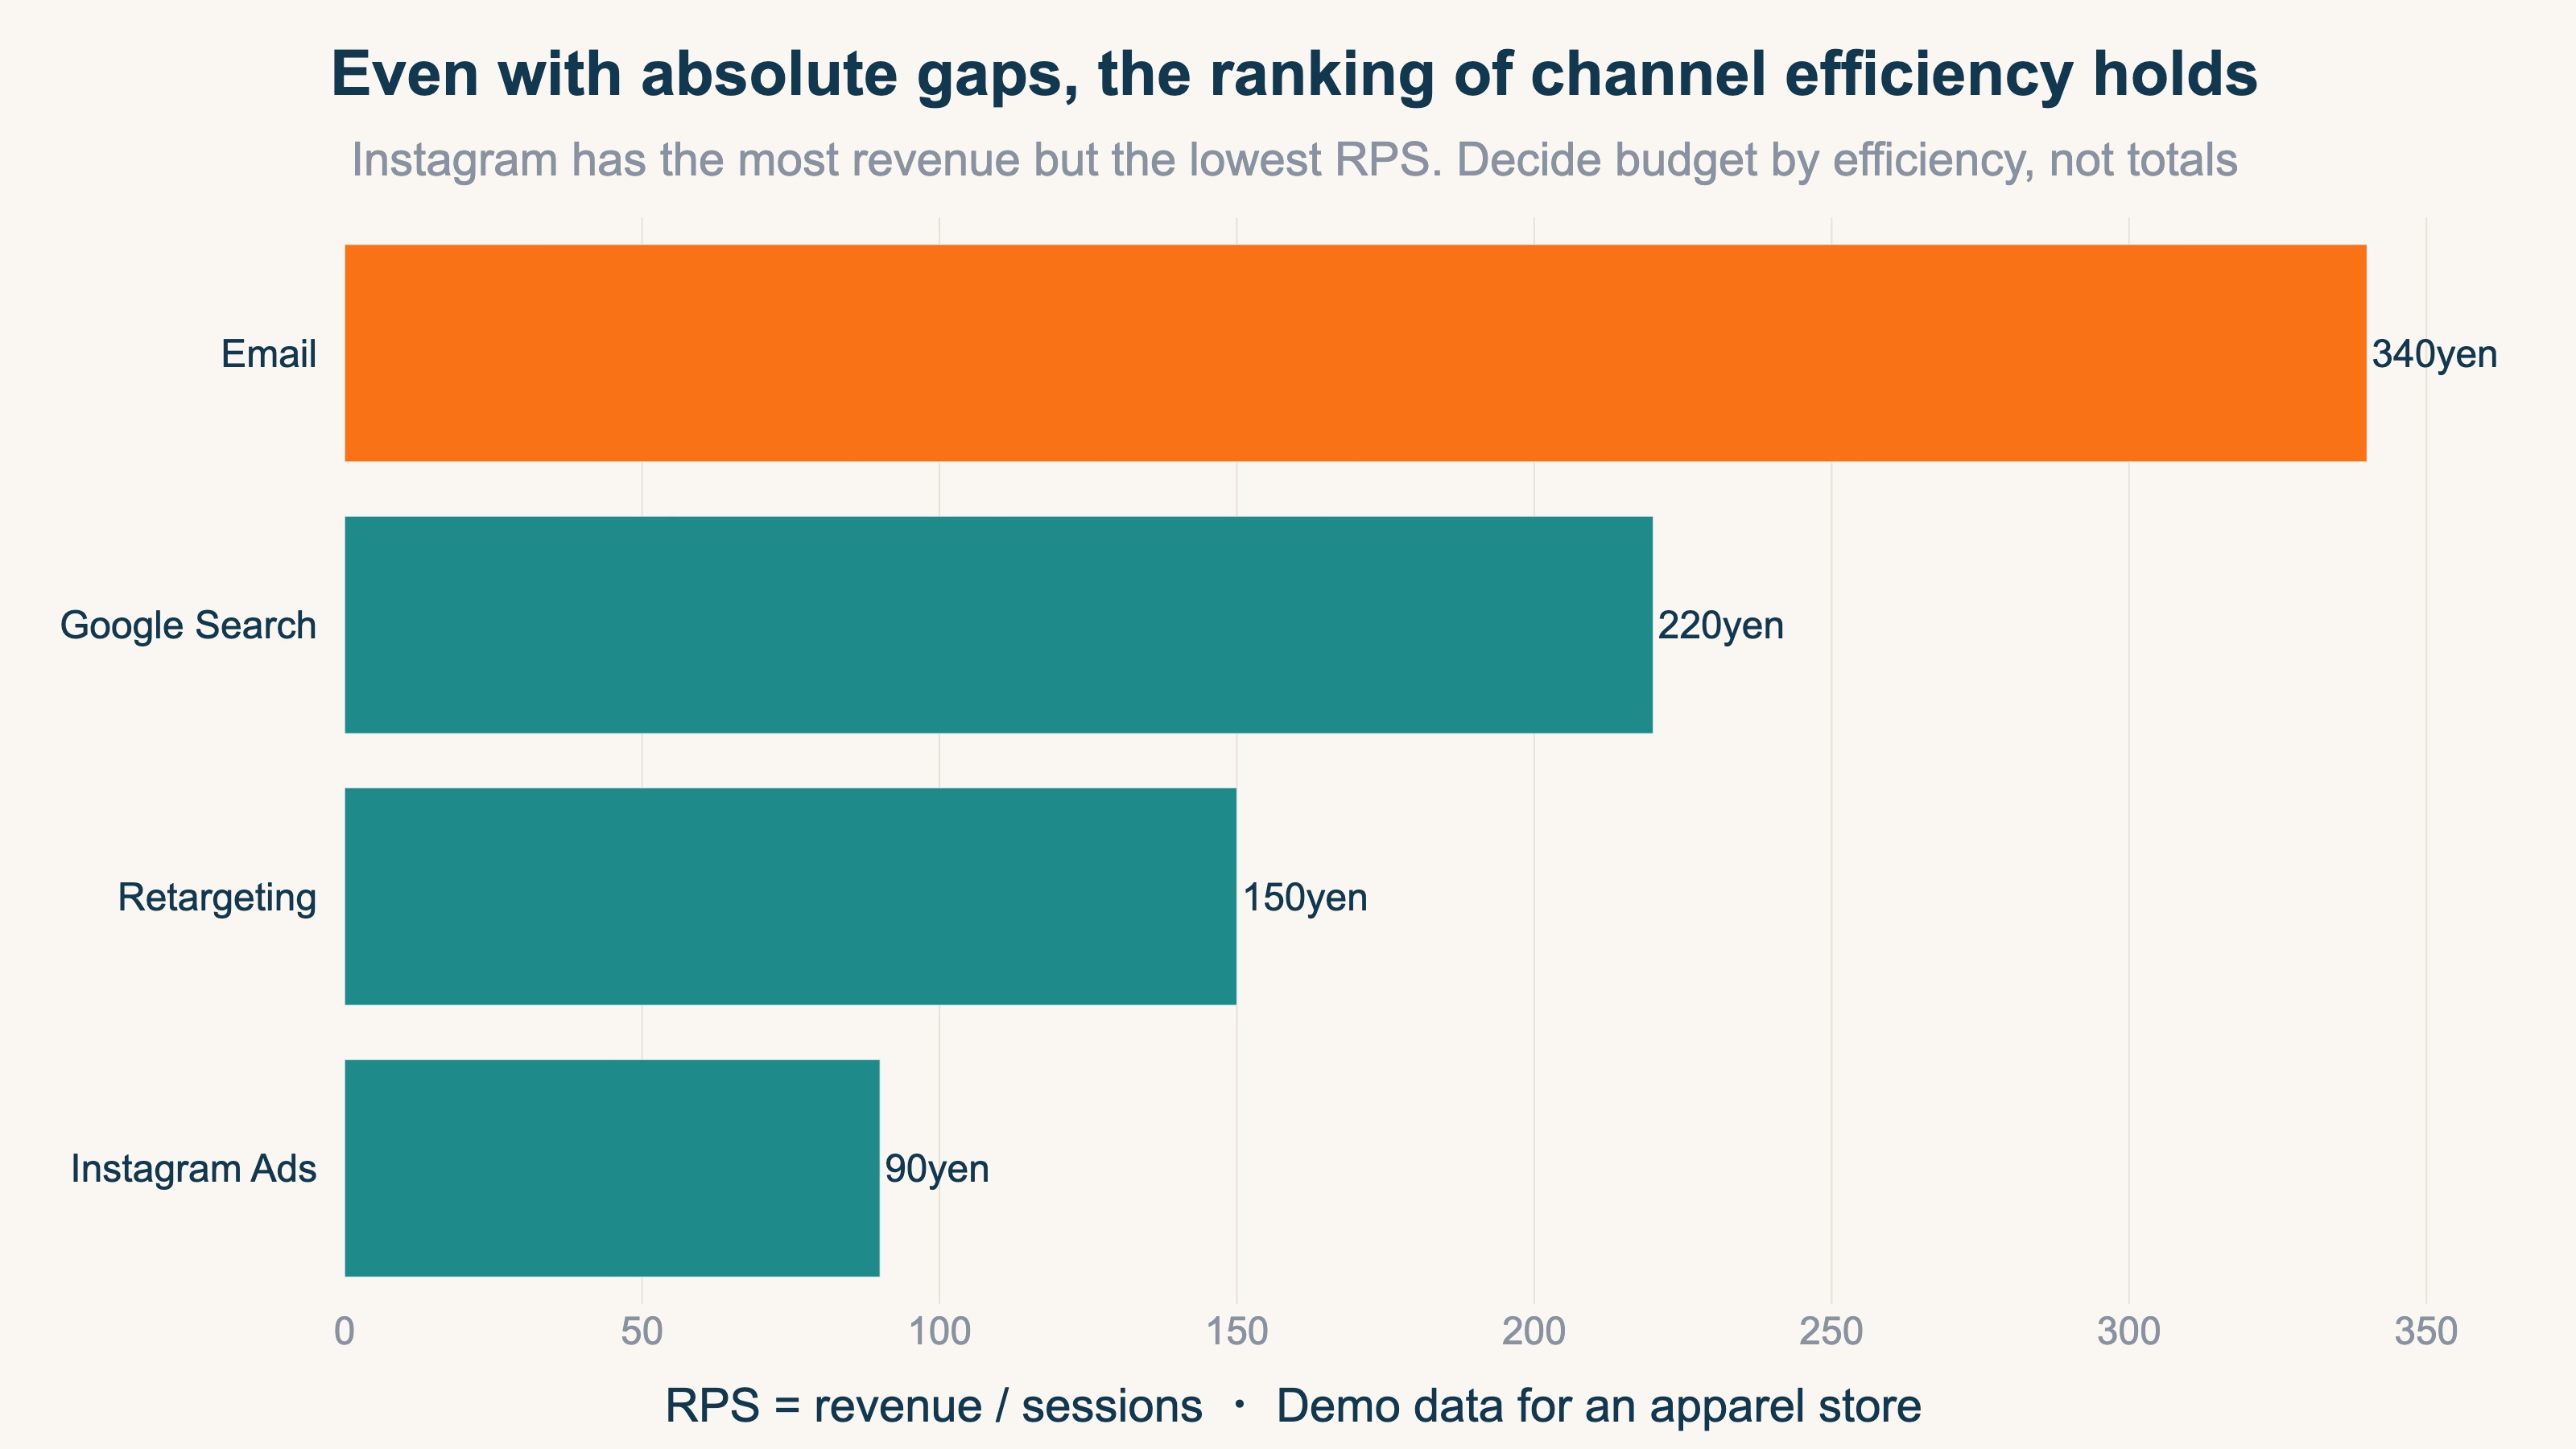
| ¥340 | Low cost, highest efficiency | |
| Google search | ¥220 | Consistently high efficiency |
| Retargeting | ¥150 | Mid-tier |
| Instagram ads | ¥90 | Large sales volume, but lowest per visit |
Instagram ads often have the largest sales "volume," so looking at Shopify's number alone tempts you to "grow it more." But per visit it is the lowest, and adding budget buys more low-efficiency visits. Decide the next move by "which channel's visits are efficient," not "which channel's sales volume is large." That is budgeting that assumes the gap. See How to calculate RPS in GA4.
RevenueScope in practice
Bottom line: Comparing per-channel relative efficiency (real revenue, RPS, AOV, purchase rate) on one screen, after excluding bots and normalizing UTM — that's a view GA4's standard reports don't produce. Showing it is what RevenueScope does.
Let's see "don't chase the absolute total; judge by per-channel relative efficiency" on an actual screen. RevenueScope organizes per-channel revenue efficiency from your GA4 and site sales data. The metrics shown are Revenue / AOV / RPS (revenue per session) / CVR. And the efficiency compared here is computed on real revenue after excluding non-human visits like bots and crawlers. GA4's standard reports aggregate with invalid traffic still mixed in, so channels with heavy bot traffic get their RPS and CVR skewed from reality — excluding bots first is what lets you rank channels correctly.
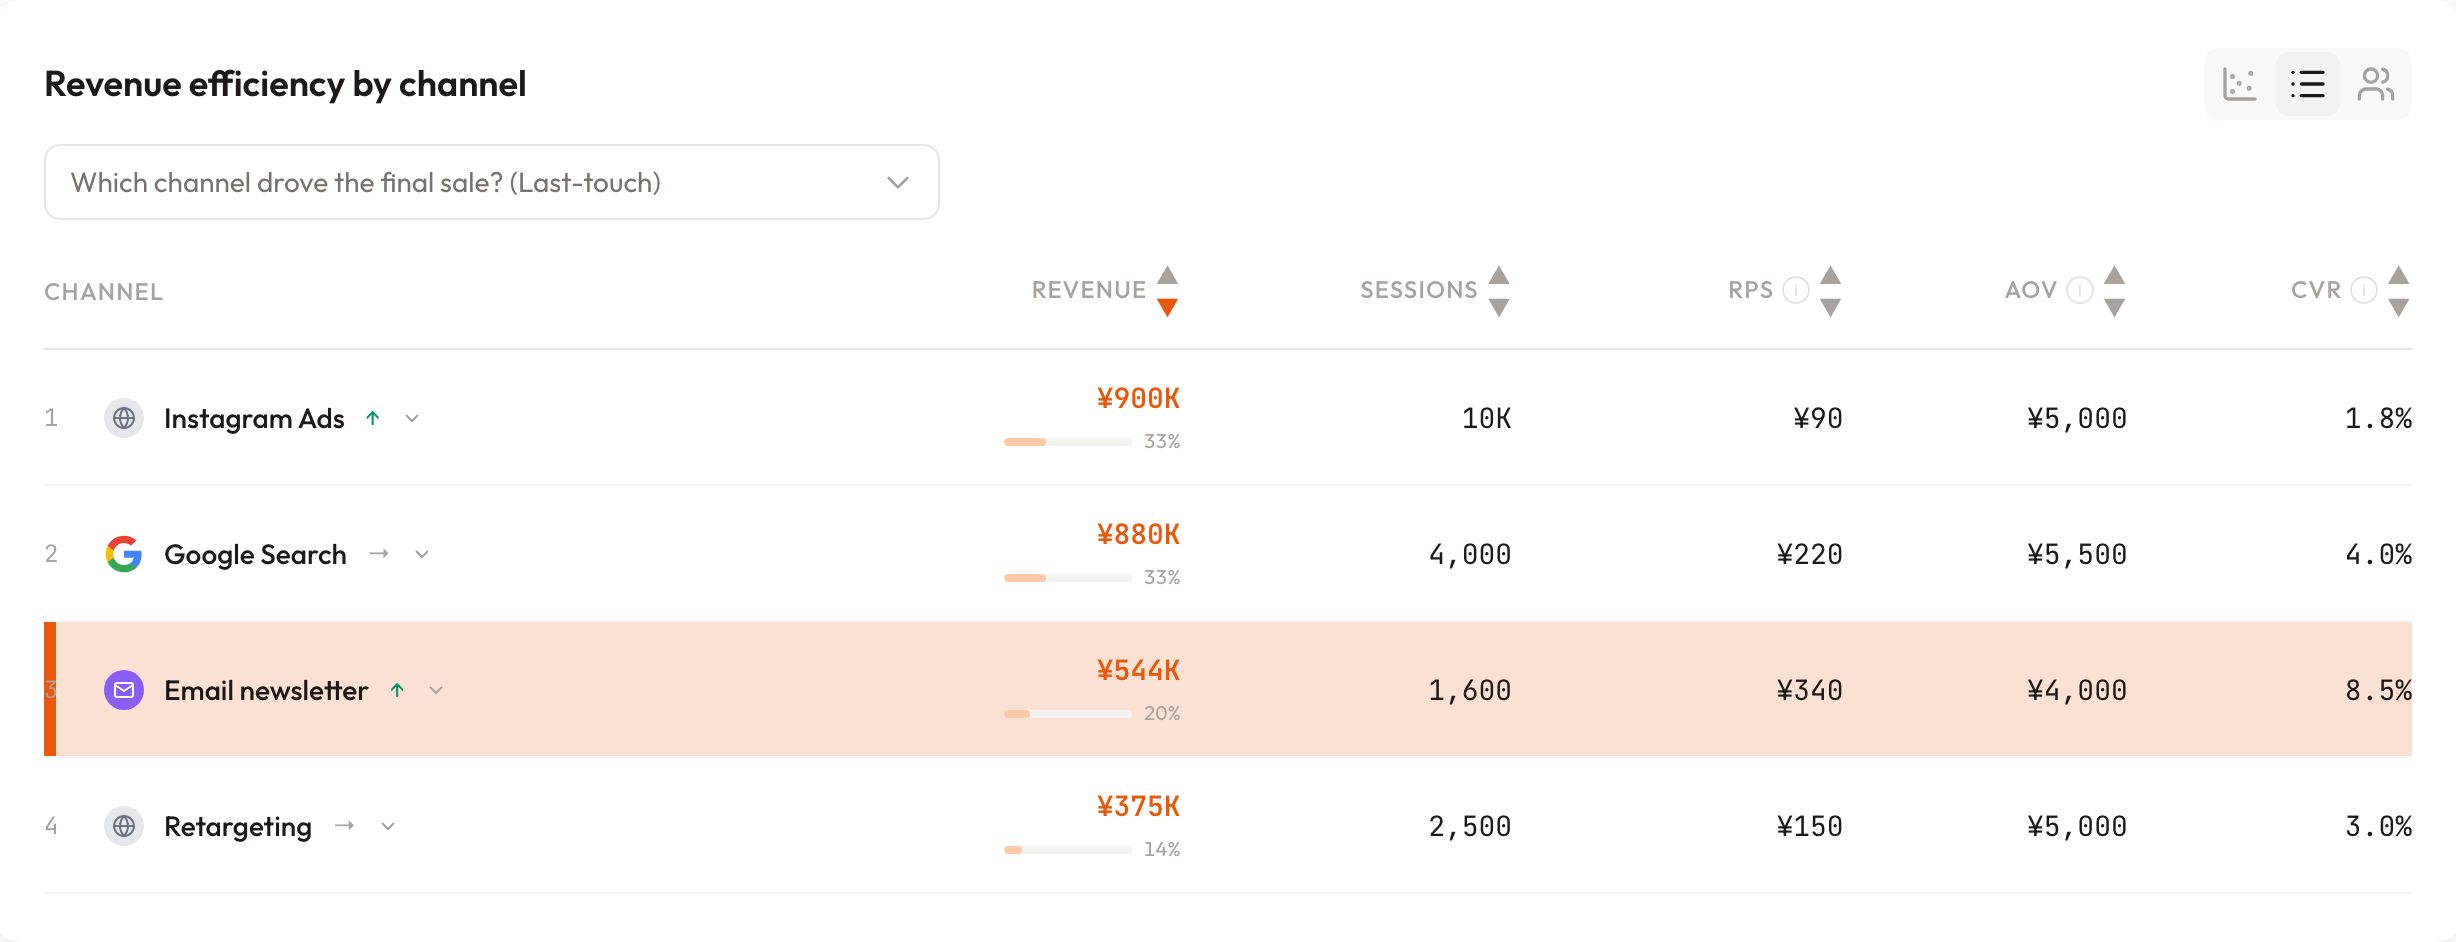
Reading this screen (demo data for an apparel store), two things stand out. First, email's RPS of ¥340 is the highest, while Instagram ads has the largest revenue but the lowest RPS at ¥90 — a reversal. Second, Instagram's conversion rate (CVR) is also low, so the visit quality itself is weak.
The next move is clear: pause the increase to Instagram and shift the next budget to the top-efficiency email channel and the consistently strong Google search. Because we're looking at relative comparison across channels, the judgment holds even if GA4's absolute total is somewhat off from Shopify. The time you spent worrying about an exact match becomes time spent comparing efficiency.
RevenueScope visualizes, in one tag and five minutes, the relative comparison of "which channel generates revenue at what efficiency." Split the roles — Shopify for the absolute accounting figures, RevenueScope for comparing channel efficiency — and the time you spent worrying about an exact match turns straight into deciding your next budget.
FAQ#
Q. Which revenue is correct, GA4 or Shopify?
A. For accounting and billing, Shopify (or your payment system) is the source of truth. GA4 inevitably has tracking gaps and reports less. Treat GA4 as a tool for reading trends by channel and page.
Q. Is GA4 being lower than Shopify a setup mistake?
A. Usually not. Checkouts that skip the thank-you page (Shop Pay, Apple Pay) and consent-mode opt-outs make GA4 structurally lower. Only inspect for missing or duplicated tags when the gap exceeds 15%.
Q. How close is "close enough"?
A. Within 5% is normal, and you don't need to chase beyond it. Don't aim for an exact match; judge by per-channel relative efficiency. See also Shopify x GA4 revenue analysis in 4 steps.
Summary#
GA4 revenue doesn't match Shopify because of how measurement itself works — checkout tracking gaps, consent mode, reporting timing, and attribution differences. So don't chase an exact match; treat within 5% as normal. Use Shopify as the source of truth for revenue, and split GA4's role to "a ruler for comparing per-channel trends." Then decide the next budget not by absolute totals but by per-channel revenue per session (RPS) — relative efficiency. Judge with the numbers that hold, without being thrown by the gap. That is the smart way to work with GA4 and Shopify together.
Related topics are also covered on /en/news.
- Shopify x GA4: the metrics that matter — revenue analysis in 4 steps
- GA4 ecommerce setup checklist in 30 minutes — Shopify edition
- Causes and fixes for rising (direct)/(none) in GA4
- Why moving budget on last-click alone loses money
- RPS (Revenue Per Session) — formula, examples, and how to get it in GA4
See which ads actually drive revenue, at a glance
Free up to 5,000 sessions/month, AI analyst included. No credit card required. Up and running in 5 minutes.
References#
[1] Google Analytics Help "Measure ecommerce (GA4)" 2024
[2] Google Analytics Help "About data-driven attribution" 2024
[3] Google Analytics Help "[GA4] Direct traffic" 2026
[4] Google Analytics Help "Metrics comparison: GA4 vs Universal Analytics" 2024
[5] Google Analytics Help "Consent mode on websites and mobile apps" 2024