Open a store on STORES and peek at the admin, and you'll see visits, today's revenue, and your most-viewed product pages lined up. But the moment you try to learn "who, among ads, social, and search, is producing the most revenue," the clues suddenly thin out. You can see the number of visits, but how those visits connected to revenue doesn't come out clearly by channel.
This article walks through what STORES shows by default, what GA4 (Google Analytics) ecommerce tracking adds, and the wall that still remains, in order. On top of that, it sketches the exit: comparing channels by revenue per visit (RPS = how much, on average, one visit from that channel sold) instead of visit count. If you'd like to compare the revenue-analytics features of each service side by side, see Comparing revenue analytics features across ecommerce cart SaaS too.
Table of contents
Key takeaways#
- What you can see in the STORES admin goes up to visits, page views, and a rough breakdown of traffic sources. Which channel truly produced revenue (per-channel revenue efficiency) never takes center stage in the standard view
- Add GA4 ecommerce tracking and you reach traffic source, but revenue gets split across Direct and (not set), and bots dirty the numbers. Visit count is visible, but its effect on revenue stays hard to see
- What matters is comparing channels by revenue per visit (RPS), not by visit count. Setup is the starting line; the real question is whether you can decide "which channel to act on next" by revenue
1. What STORES analytics shows, and what it hides#
Bottom line: what STORES shows by default goes up to visits, page views, and a rough breakdown of traffic sources. "How much the people from each channel sold" never takes center stage in the standard view.
STORES has analytics too. The range varies by plan, but you can check visits, page views, a rough source breakdown, and the purchase rate[1]. On a higher plan, the revenue tallies get a bit more detailed. So it's not that "you can see nothing."
It's just that what's easy to see is "counts." How many came, how many pages were viewed, how many orders. What's hard to see is "efficiency." Which of search and social sells more per visit; which of the newsletter and an aggregator site is worth the effort. This kind of per-channel revenue efficiency doesn't come to the front in the standard screens.
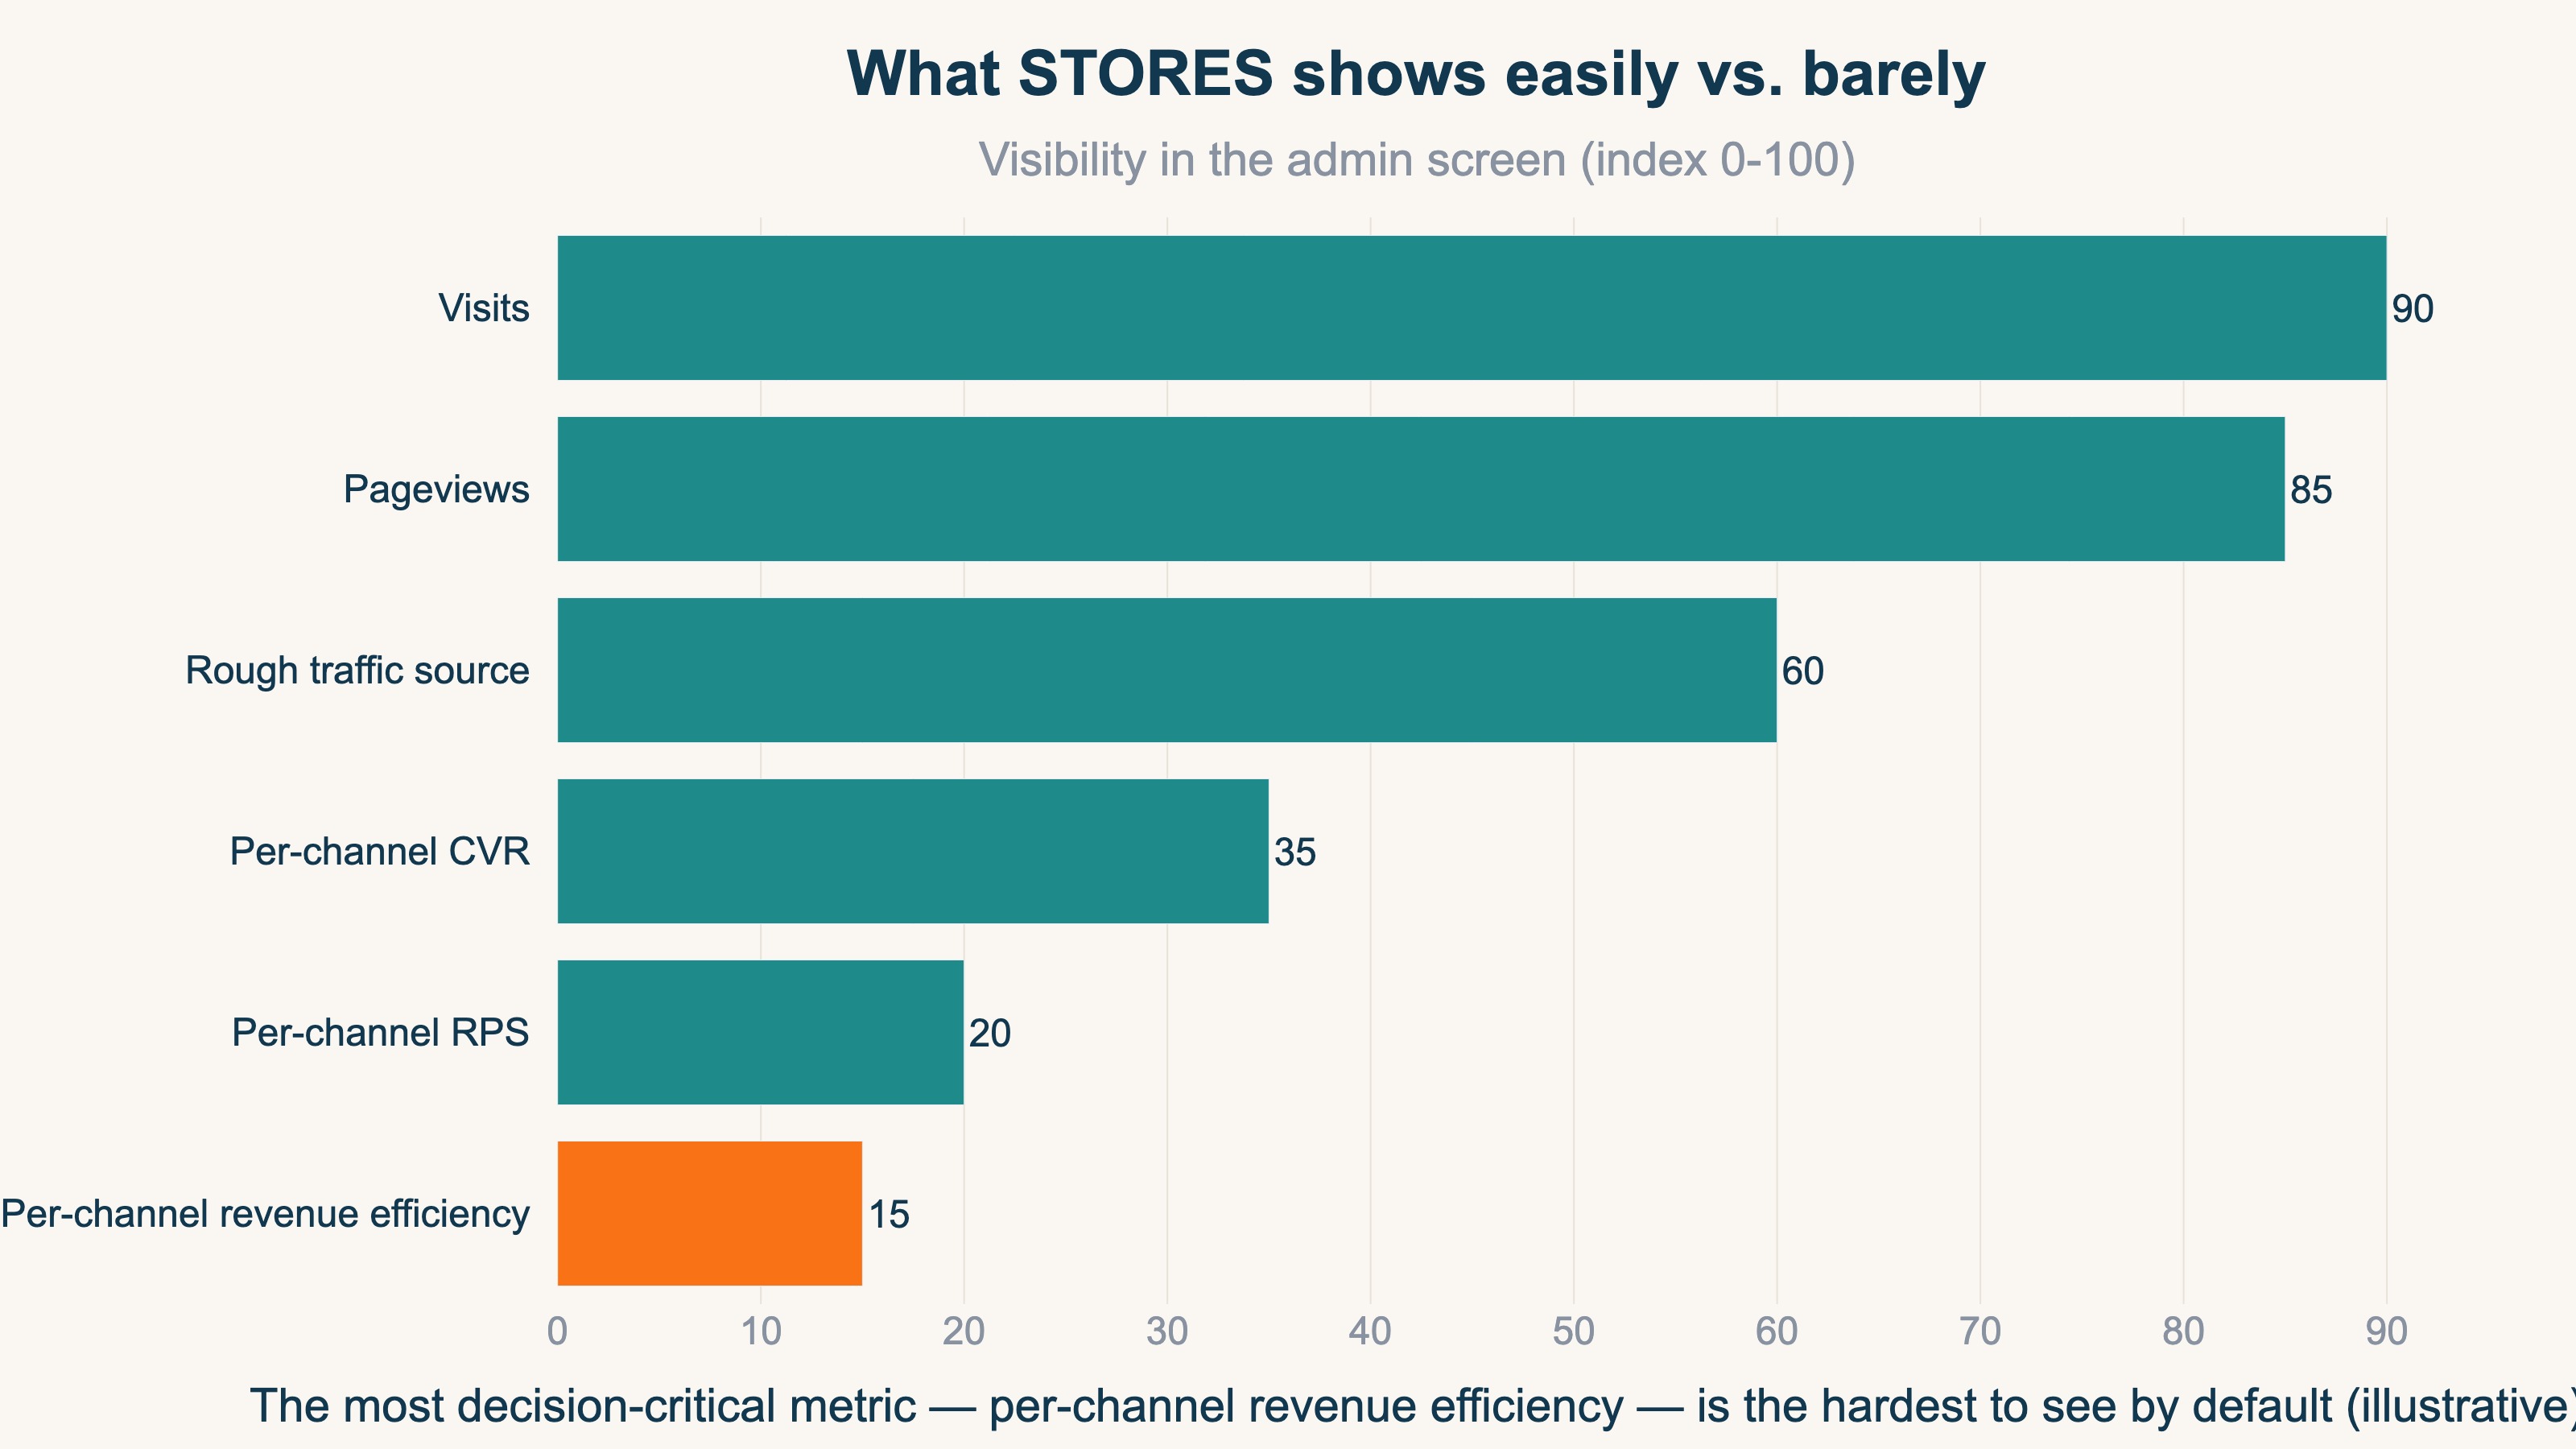
The figure below lines up the metrics that are easy to see in STORES against the ones that are hard to see. Visits and page views look large, while per-channel revenue efficiency is hidden in the back. The very numbers that matter most for the next move are the hardest to find in the standard view.
If you'd like to nail down which tool shows how far before anything else, How to choose an ecommerce analytics tool is a useful reference.
2. Why it feels like revenue is invisible: visit count and revenue efficiency are different#
Bottom line: the reason it feels like "revenue is invisible" is that visit count is visible while how it connected to revenue (revenue efficiency) is not. Count and efficiency are different things.
"There's traffic, but no sense of revenue." The truth behind this is that the number of visits and revenue efficiency are mixed together. The channel with the most traffic isn't necessarily the one selling most efficiently. Some channels bring a lot but buy little; others bring only a little yet buy well.
Here, what most standard analytics adopts is the view of "give credit only to the last-clicked channel." It seems clear at first, but the channel that created demand earlier gets ignored entirely. When someone learns about you through a video or an article, then comes back days later and buys via search, the credit goes only to search, and the first spark scores zero.
This misleads judgment. Look only at visit count and cut a channel as "this one isn't selling," and you may stop the very channel that was creating demand. Sometime later, the revenue of another channel can fall too. Take the number of visits at face value and you can end up shaving your own revenue.
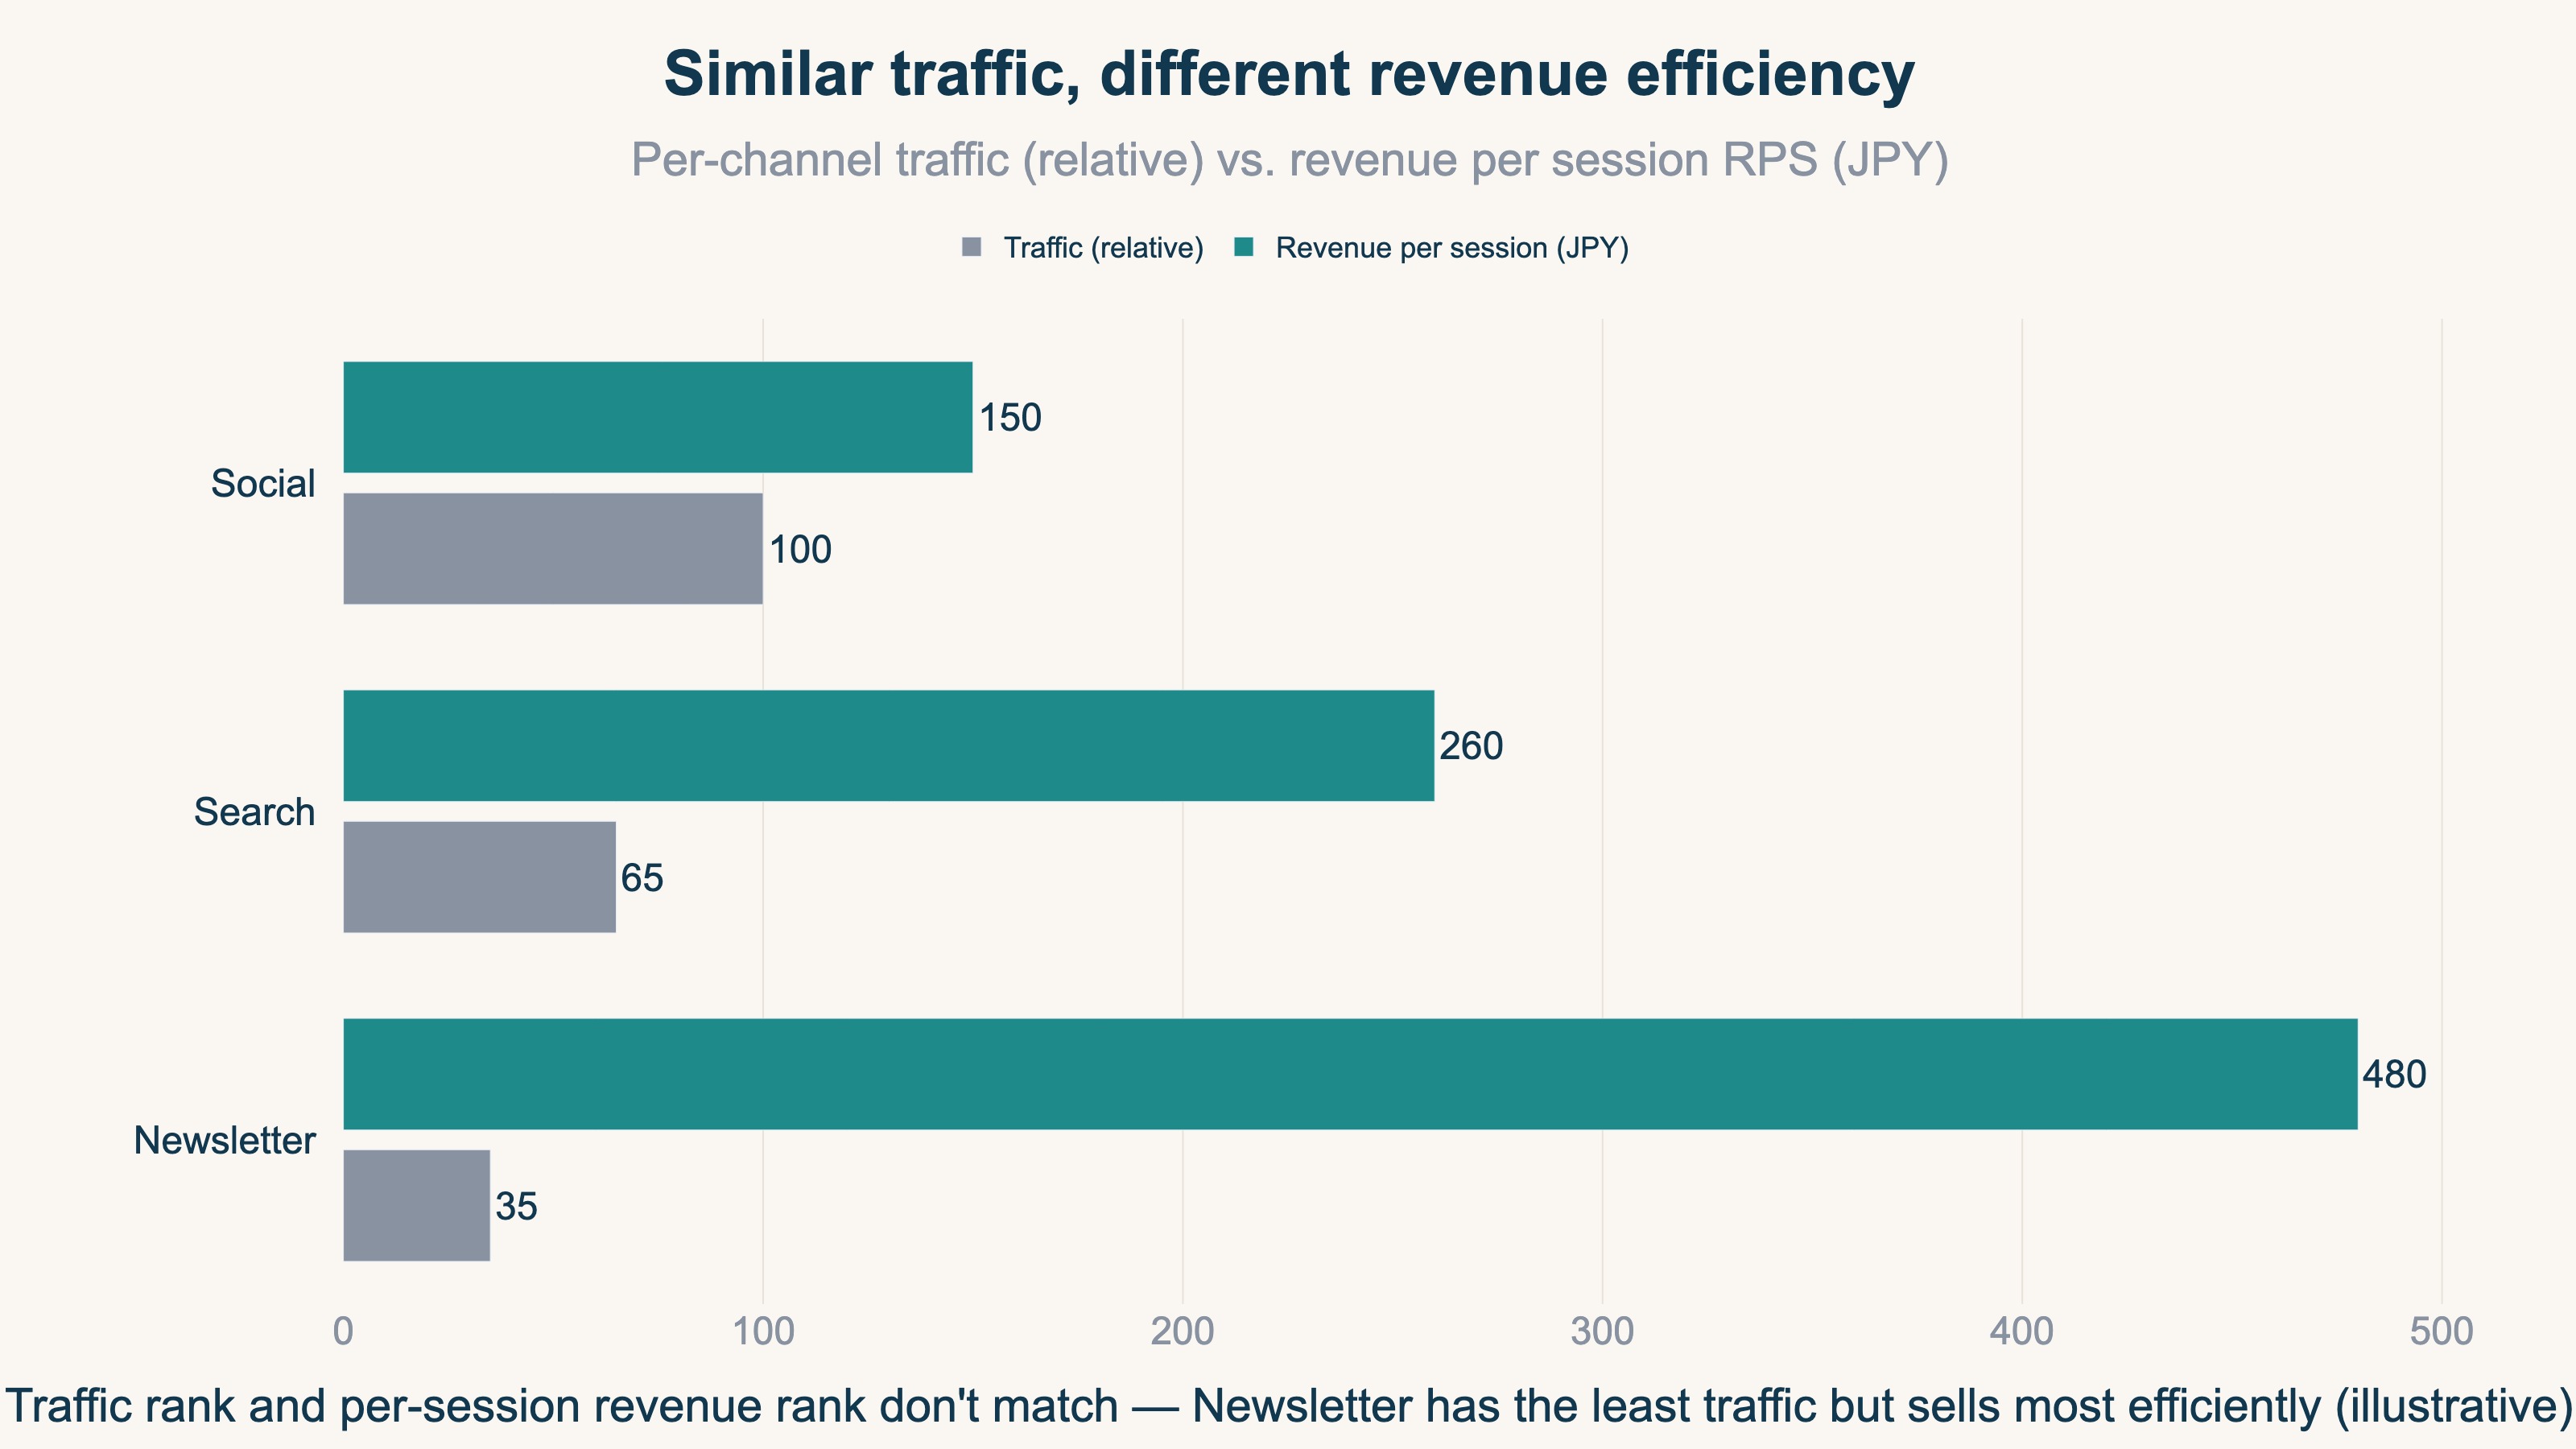
The figure below is an example where, even at similar visit counts, revenue per visit (RPS) differs completely by channel. The order of the bars for visit count and the order of the bars for revenue efficiency don't match. The revenue efficiency of channels that don't rely on ads is also touched on in The revenue efficiency of non-ad channels.
3. What GA4 ecommerce adds, and the wall that remains beyond it#
Bottom line: if STORES feels lacking, GA4 ecommerce tracking widens the view down to traffic source. But beyond that, a wall remains that standard tools struggle to clear.
When the contents of your traffic feel thin, adding GA4 ecommerce tracking is the standard move. Set it up to measure purchases and the visible range widens — source-by-source breakdowns, per-page behavior, the path to purchase[2]. There are also reports that line traffic up by channel[3]. The idea is to add a setup that "tells GA4 about the event of a purchase."
But even when you get this far, a wall remains.
The first: per-channel "revenue efficiency" doesn't become the protagonist of standard reports. Even if you can see totals for traffic and revenue, there's no standard screen that lines up "how much sold per visit" across channels.
The second: the source gets split. When the checkout page moves to a separate domain, for instance, the origin gets dropped, and Direct and "(not set)" swell[4]. Setup can reduce it somewhat, but buried revenue tends to stay of unknown origin. This problem is also covered in When Shopify referrers are all (not set).
The third: dirty numbers. When bots (automated, program-driven access) step on pages, visits get padded, and it gets harder to tell what a real customer is. Revenue amounts can also diverge between GA4 and the cart, which is laid out in Why revenue differs between GA4 and your cart.
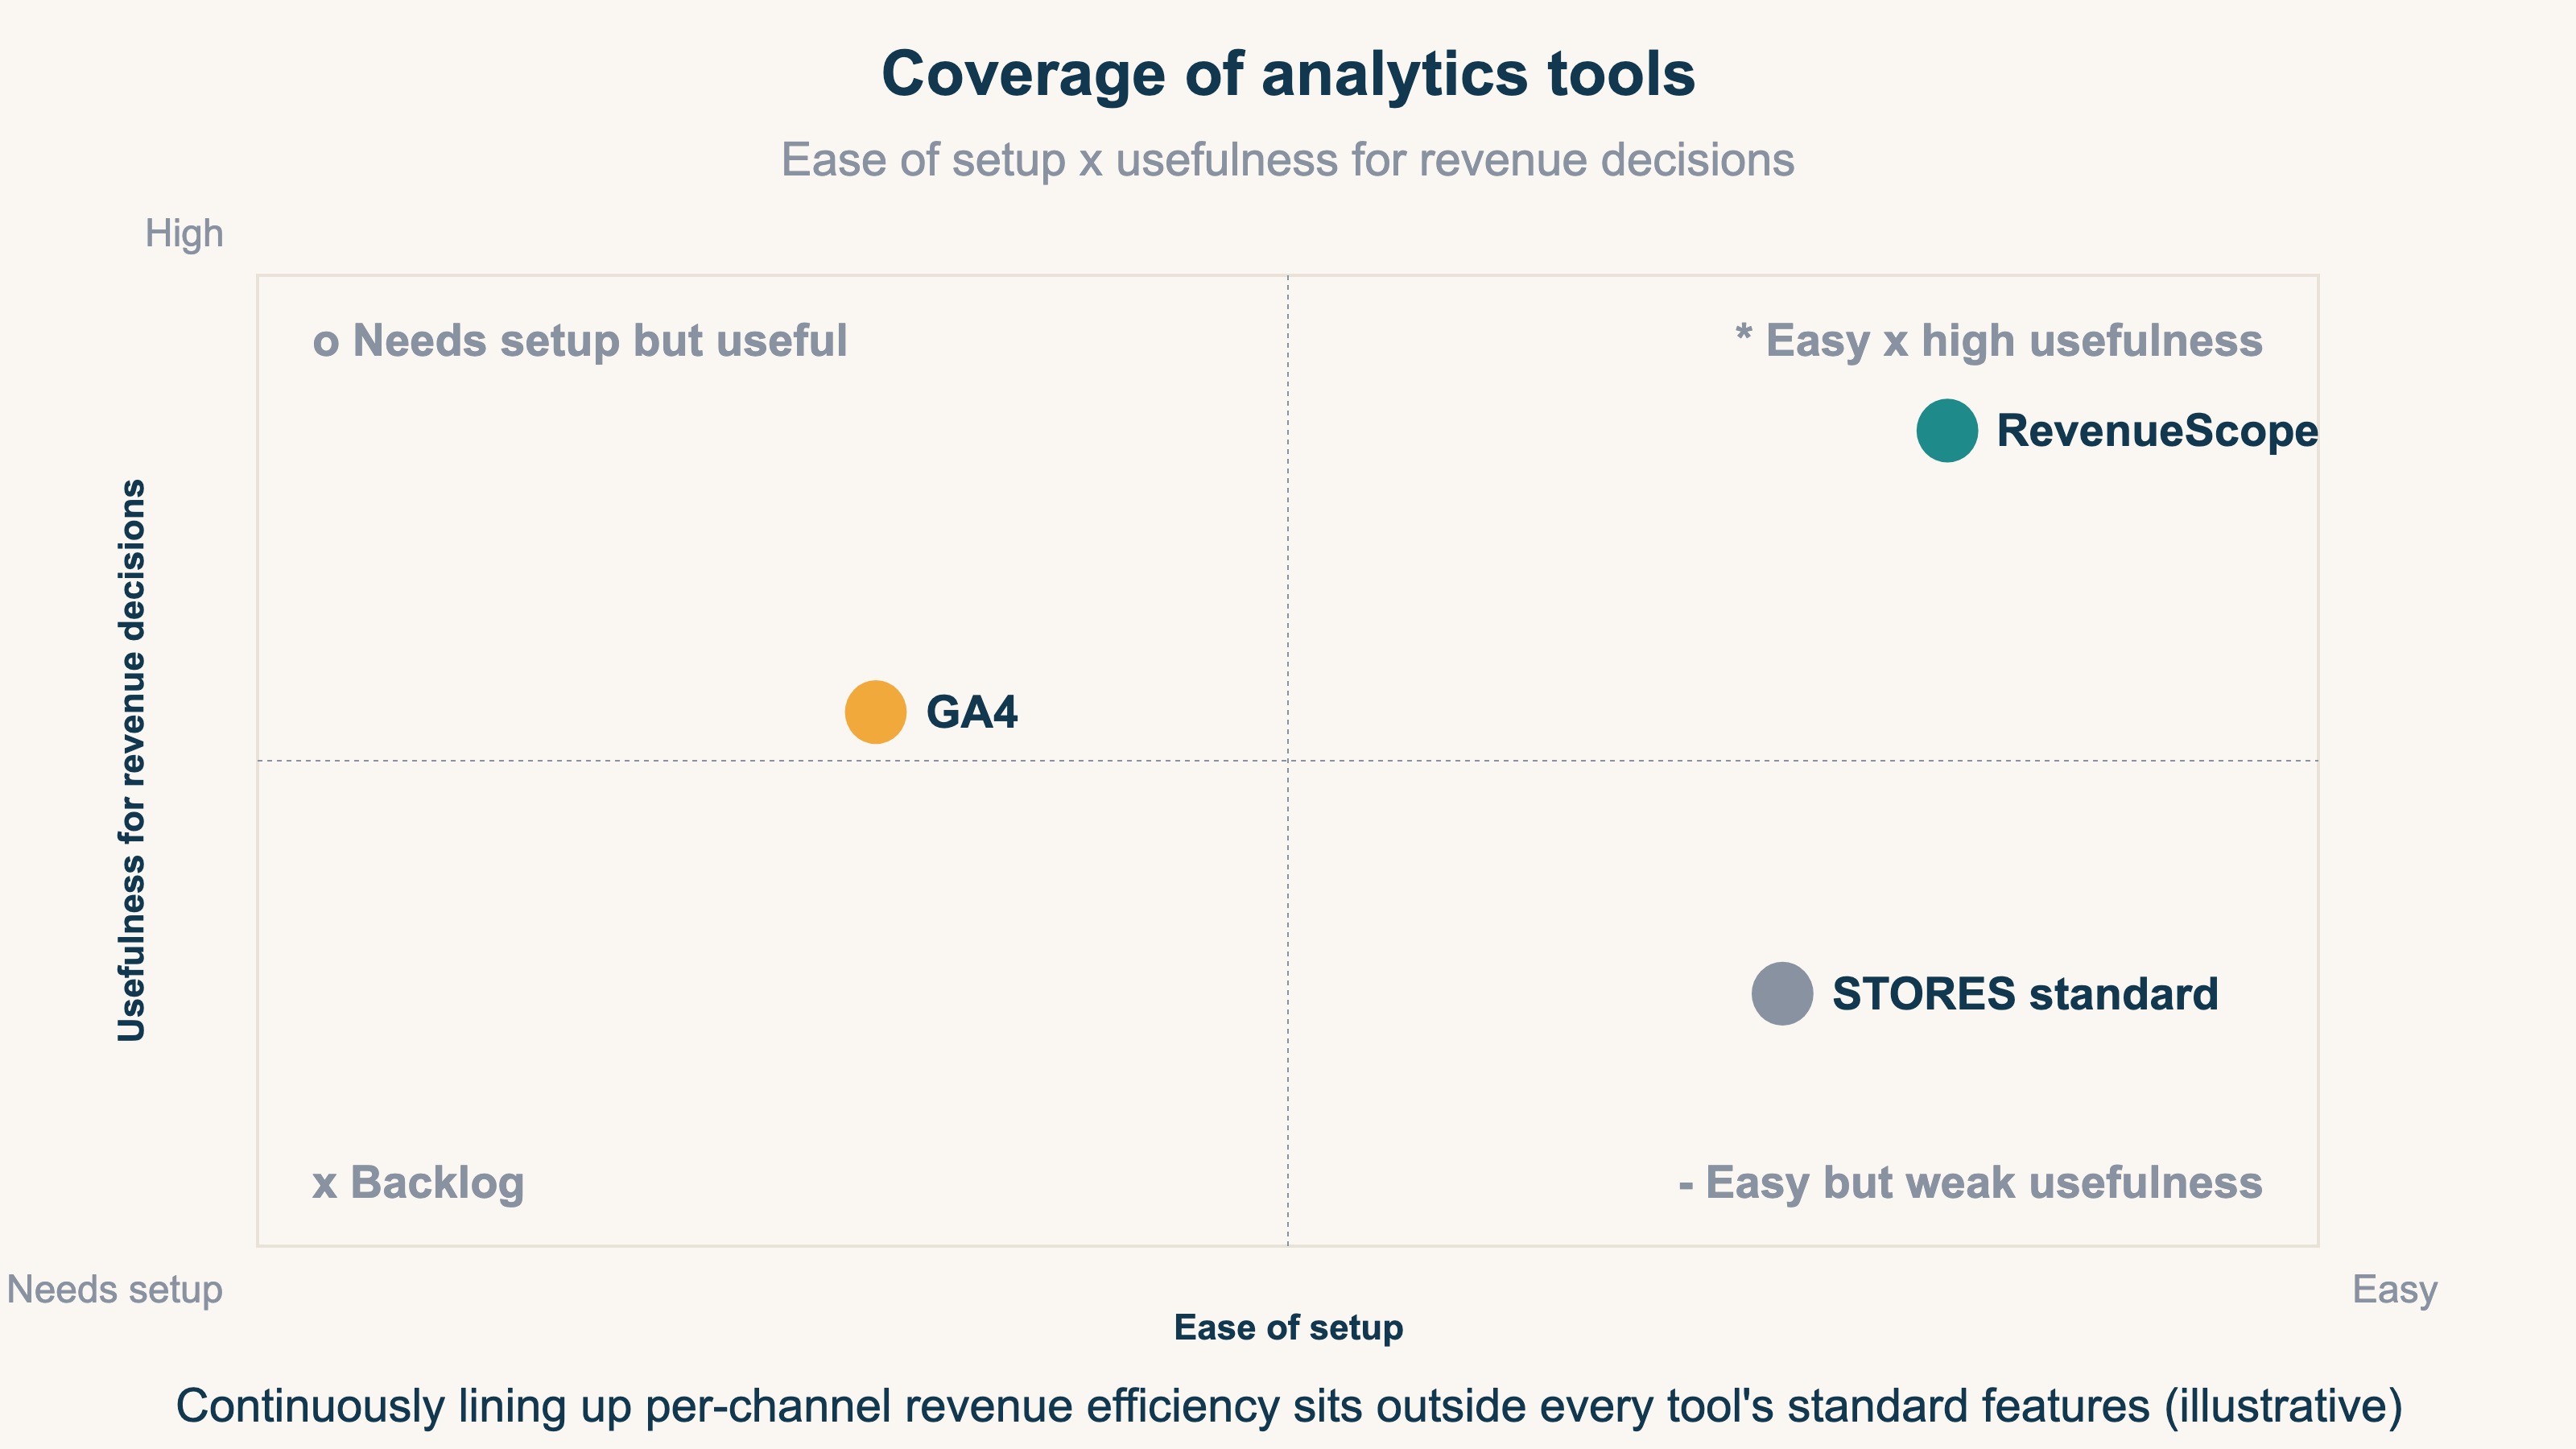
The figure above is a map of where STORES standard, GA4, and a revenue-first dedicated tool sit on "ease of setup" and "usefulness for revenue decisions." Standard is easy but weak for revenue decisions; GA4 is broad but takes know-how to master. Continuously lining up and watching per-channel revenue efficiency sits outside standard features in both.
When the numbers scatter and you can't see the real profit on one screen, some people end up building it themselves in a spreadsheet. The idea is simple. What's hard is the work of removing bots and lining up visit count, revenue per visit, and revenue by channel to compare — every month.
RevenueScope solution
Chase the origin of revenue in STORES or GA4 and two walls remain. One is that, however hard you work the setup, "per-channel revenue efficiency" doesn't become the protagonist of the standard view. The other is that the work of removing bots and lining up visit count, revenue efficiency, and revenue by channel to compare is heavy as a monthly manual task.
RevenueScope takes this comparison off your hands. It splits traffic by channel and, with bots removed, lets you line up visit count, revenue per visit (RPS), and revenue on a single screen (the display is demo data). You can confirm, on the same screen, how much the people from each source sold.
| Channel | Visits | Revenue per visit (RPS) | Revenue |
|---|---|---|---|
| Email newsletter | 6,000 | ¥480 | ¥2,880,000 |
| Search | 28,000 | ¥260 | ¥7,280,000 |
| Social | 21,000 | ¥150 | ¥3,150,000 |
| Unknown source | — | — | ¥1,400,000 |
There are two things to read in this table. One is that the most visits come from search, yet by revenue per visit the newsletter sells most efficiently. Rank by the number of visits and you overlook the efficient channel. The other is that it shows the "unknown source" row without fudging it. Because revenue whose origin can't be identified is kept rather than erased, you can see the reality that the source is split. On top of that, you can switch from the view that credits only the last click to one that also allocates to the first spark or the steps along the way, and compare the same revenue from a different angle.
Let me make one thing clear. What RevenueScope takes off your hands goes up to preparing the material for the decision. It doesn't fix the STORES setup itself for you; it receives data via general-purpose tools like GA4. It doesn't calculate gross margin, profit after returns, or inventory. The one who decides which channel to finally act on is you.
FAQ#
Q. Can you do no revenue analysis at all with STORES standard?
That's not the case. It depends on the plan, but you can see visits, page views, a rough source breakdown, and order and revenue tallies. What's hard to see is "per-channel revenue efficiency" — that is, how much, per visit, the people from each channel sold. Keeping in mind the gap that counts are visible while efficiency doesn't come to the front will keep you from getting lost.
Q. If I add GA4, will I know which channel is producing revenue?
It widens the view up to source-by-source traffic and revenue totals. But there's no standard screen that lines up "revenue per visit" by channel to compare, and the source splits across Direct and (not set). Bots can dirty the numbers too. The visible range widens, but deciding the next move by revenue efficiency takes one more bit of work.
Q. In the end, which number do I look at to decide the next channel?
Don't decide by visit count alone. Even with a lot of traffic, if revenue per visit (RPS) is low, effort won't easily raise efficiency. By channel, line up visit count, revenue per visit, and revenue with bots removed, and look for the channels selling efficiently. The idea is simple, but keeping it up every month as channels grow is heavy work.
Summary#
What you can see in the STORES admin goes up to visits, page views, and a rough breakdown of traffic sources. Per-channel revenue efficiency — "which channel truly produced revenue" — never takes center stage in the standard view. Even after GA4 ecommerce tracking widens the view down to traffic source, revenue efficiency still isn't the protagonist of the standard view, the source splits across Direct and (not set), and bots dirty the numbers. Working the setup matters, but it's the starting line.
The real question is whether you can compare channels by revenue per visit (RPS) rather than visit count, and decide "where to act next" by revenue. Judge by the last click or by sheer traffic volume alone, and you can stop the channel that was creating demand, and end up shaving your own revenue instead. Make it so you can line up the source by revenue efficiency, and you can choose the next move with your own numbers, not a hunch.
See which ads actually drive revenue, at a glance
Free up to 5,000 sessions/month, AI analyst included. No credit card required. Up and running in 5 minutes.