"I installed an analytics tool, but I still can't tell which numbers to look at to judge revenue." If you run an EC store, you hear this a lot.
There are plenty of tools, but the hard part of choosing isn't the number of features. It is what you want to know. What most EC owners want to know is "which channel is actually generating revenue" — in other words, a revenue decision.
Here is the conclusion up front. You choose an analytics tool by what you want to see. If you want to judge revenue in EC, the shortcut is to choose by "how quickly it gets you to the revenue numbers," not by feature count.
This article sorts the main analytics tools from the angle of "choosing by revenue." We line up GA4, free trackers, open source, and revenue-focused dashboards along selection axes.
Contents
TL;DR#
The conclusion first.
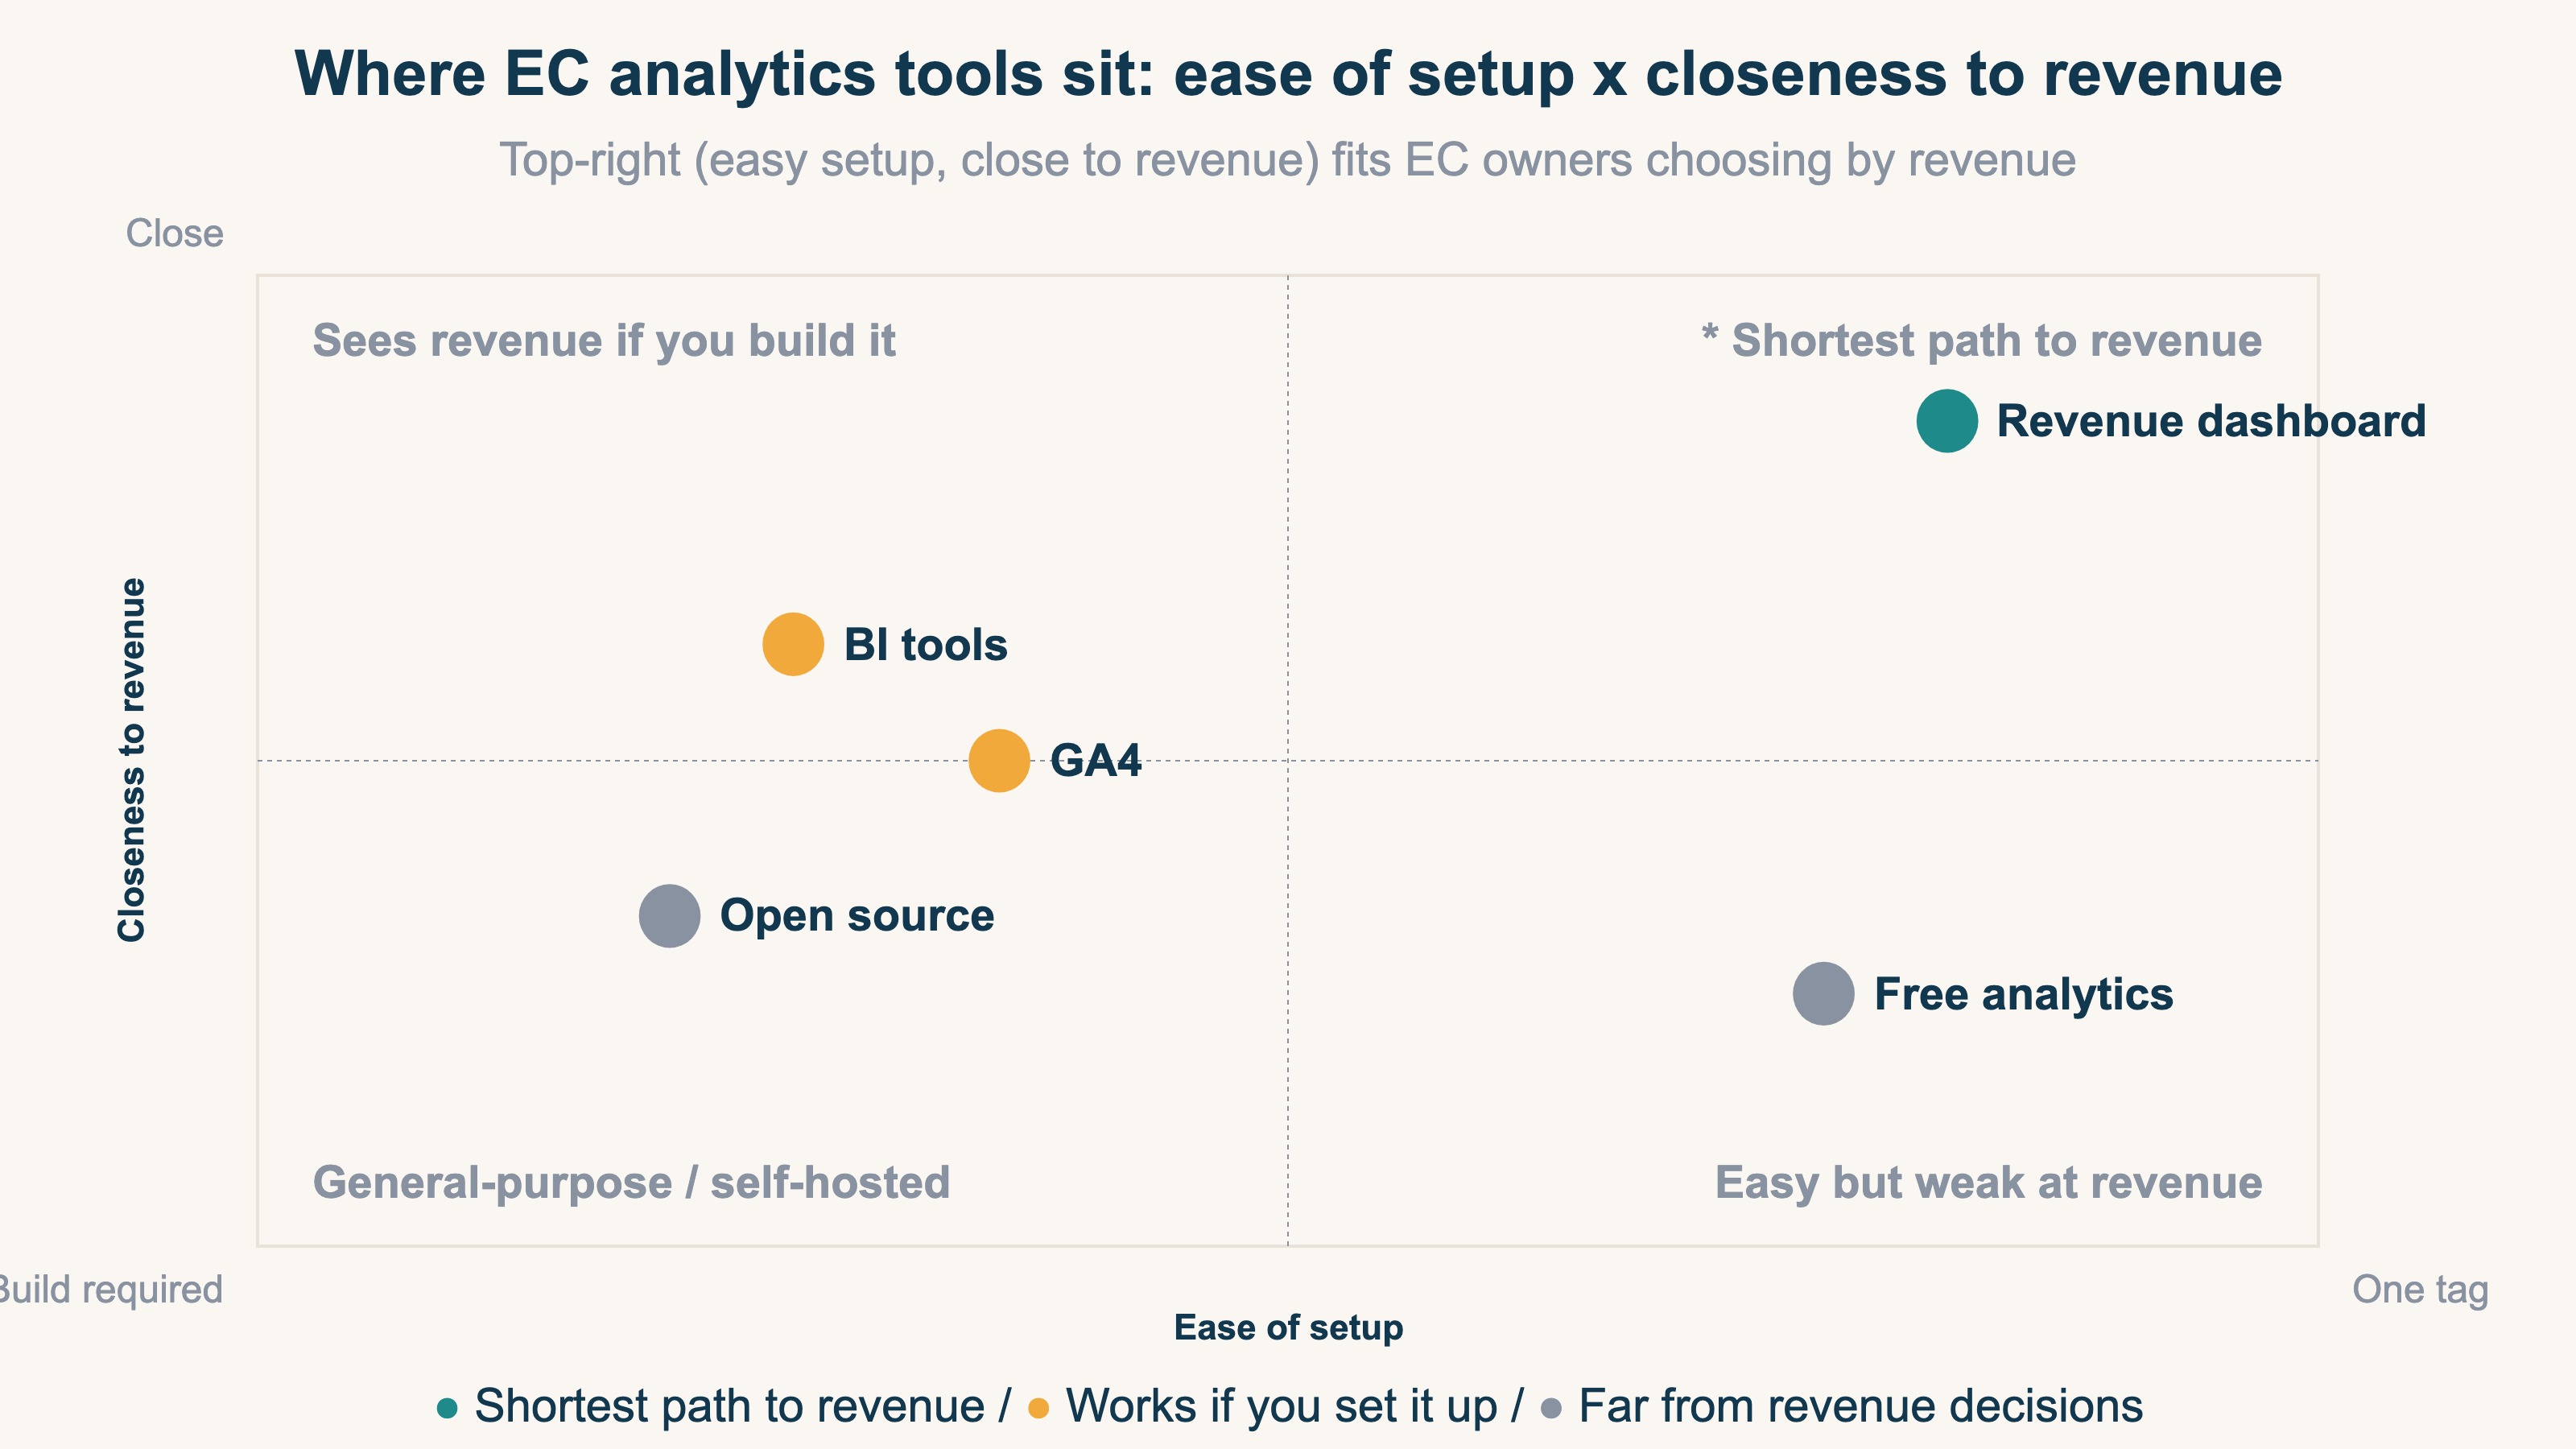
- Analytics tools split broadly into "general-purpose web analytics" and "revenue-focused dashboards"
- What EC owners want to know is usually "which channel generates revenue." Keeping that lined up by channel, bot-excluded, on one screen is structurally hard with a general-purpose tool
- The criterion is not feature count but "how quickly it gets you to a revenue decision" — judged on setup effort, clarity of metrics, and EC focus
1. What an analytics tool is for#
Conclusion: choose by the "numbers you want to see." For most EC owners, the goal is a revenue decision.
Analytics tools split, roughly, into two types.
One is general-purpose web analytics. GA4 and free trackers fall here. They let you see PV (page views), traffic sources, and user behavior in detail. They are feature-rich, but built for an analyst.
The other is a revenue-focused dashboard. It shows revenue, average order value, and purchase rate by channel, ready to read from the start. It fits the ad decisions EC owners make.
What matters in EC is not "are there many visits." It is "are those visits generating revenue." For the same visit count, whether it turns into revenue varies widely by channel.
2. Comparing the main tools by selection axis#
Conclusion: instead of listing features, four axes make the differences clear.
The four axes to look at:
- Setup effort (one tag, or a build required)
- Clarity of metrics (shown in EC terms)
- Focus on EC revenue
- Cost
Lined up along these axes, the main types look like this.
| Tool type | Setup effort | Revenue decision | Cost |
|---|---|---|---|
| GA4 (general, free) | Needs e-commerce measurement setup | Report building required | Free |
| Free trackers | Easy | Weak at EC revenue analysis | Free |
| Open source (Matomo, PostHog, etc.) | Self-hosted build and ops | Depends on customization | Build/ops cost |
| BI tools (Looker Studio, etc.) | Connect to GA4 and build | Depends on design skill | Free and up |
| Revenue-focused dashboard | One tag, 5 minutes | Revenue metrics shown from the start | Free plan available |
GA4 is free and powerful, but seeing EC revenue requires "e-commerce measurement" setup and assembling reports. Free trackers are easy but weaker at channel-level revenue analysis. Open source offers high flexibility, but build and operations take effort. None is good or bad — what matters is the fit to your goal.
3. A checklist for EC owners who choose by revenue#
Conclusion: if the goal is a revenue decision, choose on these four points.
- Can you install it with one tag (start without a build)?
- Can you compare revenue, average order value, and purchase rate by channel on the same screen?
- Do the numbers come out clean, with bots excluded?
- Can you try it for free?
The one most often overlooked is RPS (revenue per session). RPS is revenue per visit, and it bundles both acquisition efficiency and order value into a single number.
RPS = Revenue / Sessions
The formula itself is simple. The hard part isn't the arithmetic — it is keeping this lined up by channel, every month. Try to do the same in GA4 and three things become structural walls.
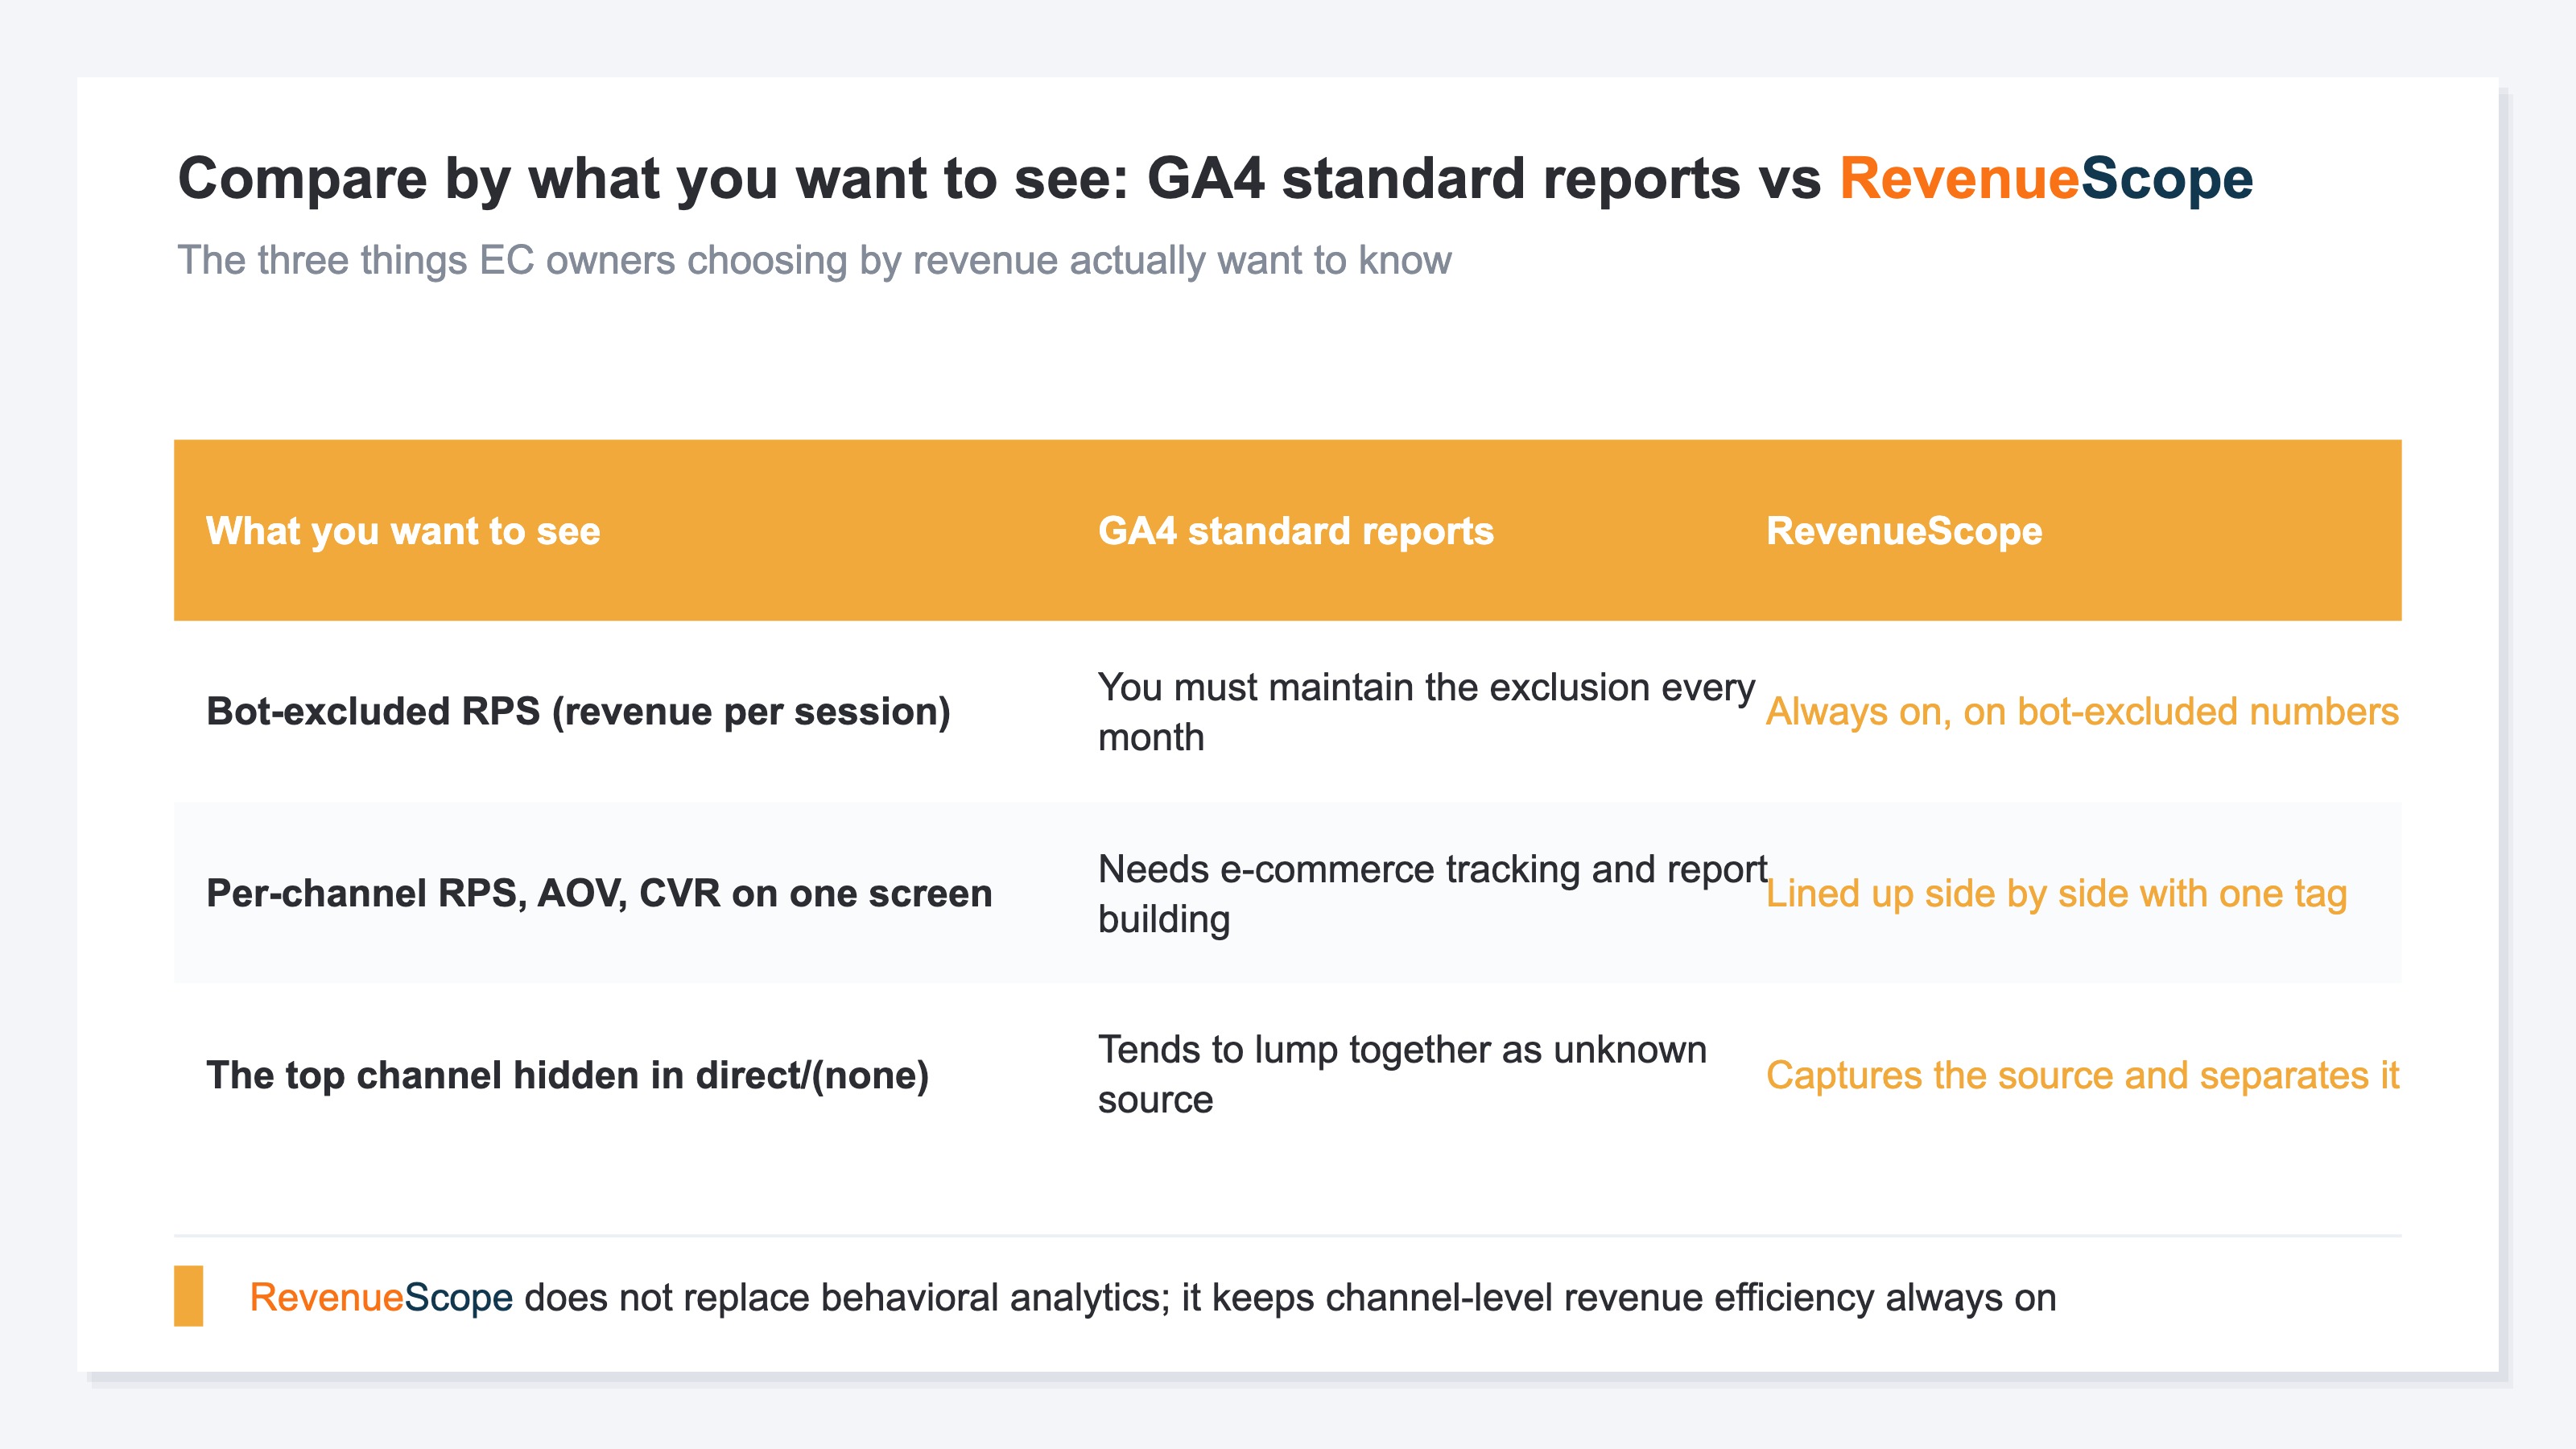
- The numbers aren't bot-excluded: standard reports divide by sessions that include bots and invalid traffic, so RPS can come out lower than reality. You have to keep the exclusion in place every month.
- Channel-level revenue efficiency doesn't line up on one screen: to compare RPS, order value, and purchase rate side by side per channel, you need e-commerce measurement setup and report building. The standard views don't line them up.
- The top channel hides in direct / (none): sessions whose source can't be captured get lumped into "direct" or "(none)," and the channel actually generating the most revenue can disappear from view.
The average purchase rate in EC is said to be around 2-3% [2]. Even a channel with a low purchase rate can grow revenue if its order value is high — and vice versa. That is exactly why the dividing line becomes whether you can keep comparing purchase rate, order value, and revenue by channel, with bots excluded, on the same screen. For the basics of RPS, see What is RPS: the metric, formula, and how to get it in GA4.
RevenueScope's solution
Conclusion: RevenueScope gives you, with one tag, an always-on, bot-excluded, channel-level view of the revenue efficiency (Revenue / AOV / RPS / CVR / Sessions) that GA4's standard reports don't line up on one screen.
The three walls from the previous section — bot exclusion, lining up channels side by side, and separating out direct / (none) — are none of them "hard to figure out." They are the kind of thing that is structurally heavy to keep aligned every month. That is exactly what RevenueScope shoulders as an always-on view.
RevenueScope is a lightweight, revenue-focused dashboard you can use by adding just one tag to GA4. By channel, it lines up five KPIs — the four core metrics Revenue, AOV (average order value), RPS (revenue per session), and CVR (purchase rate), plus Sessions — with bots excluded, on the same screen.
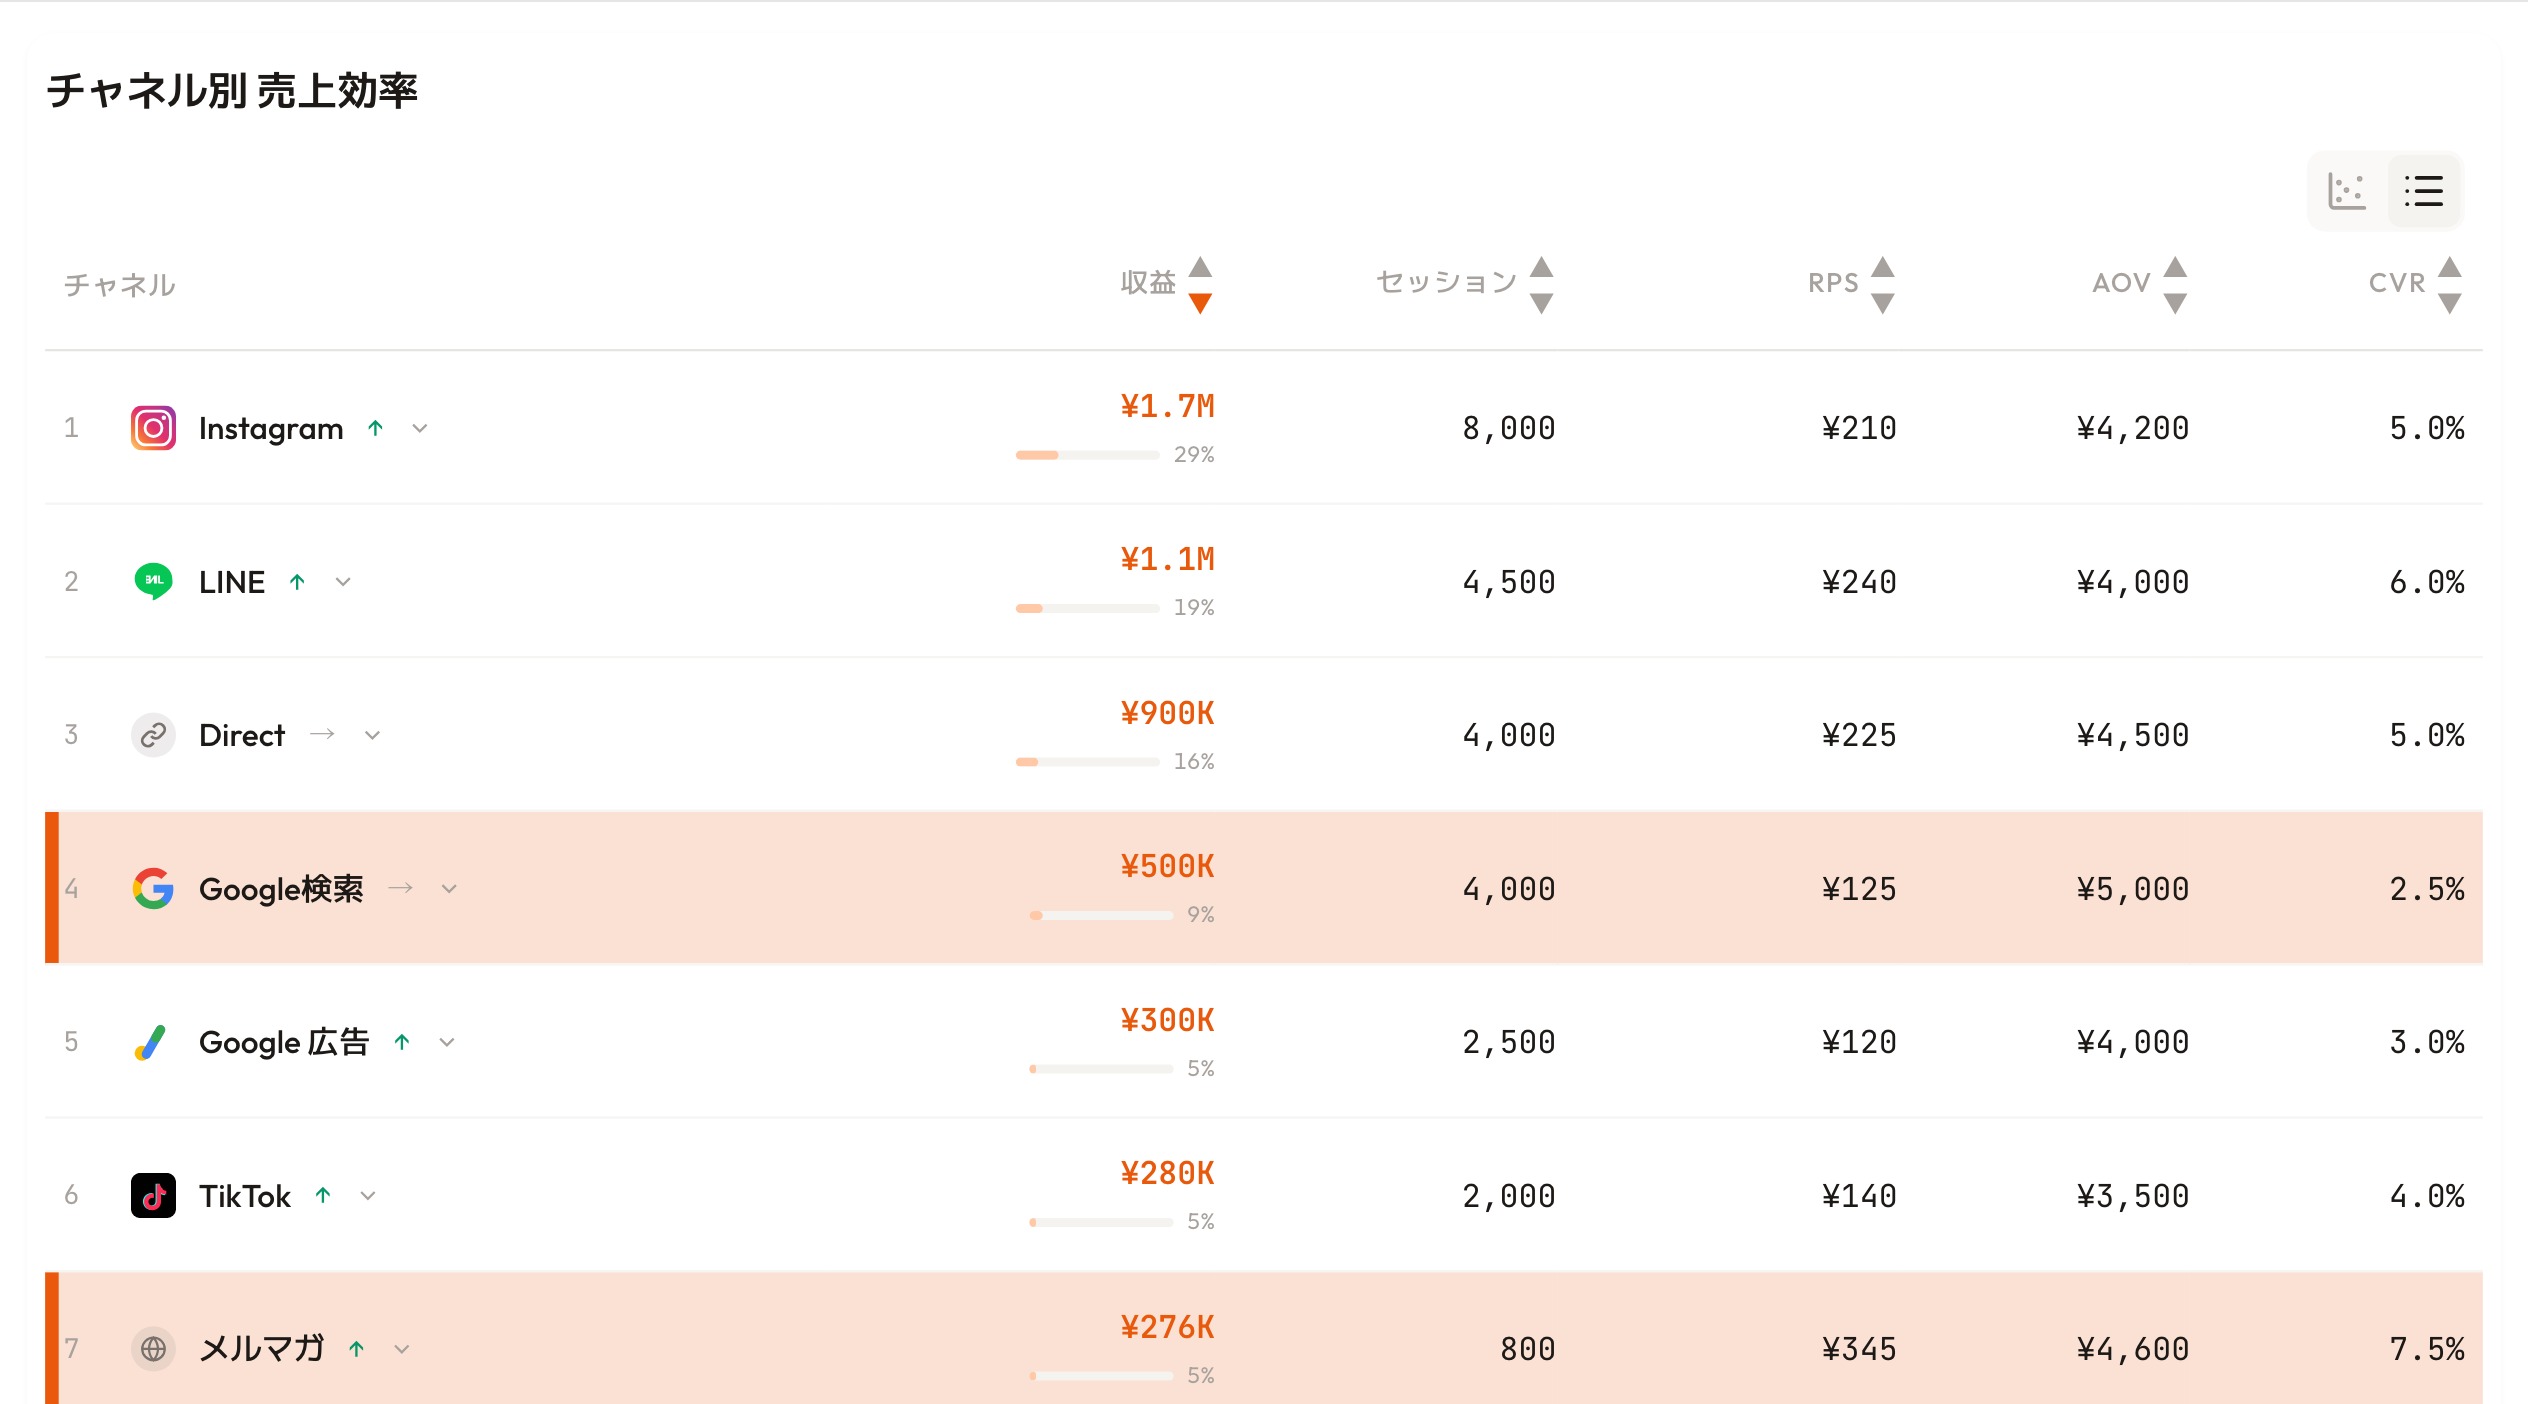
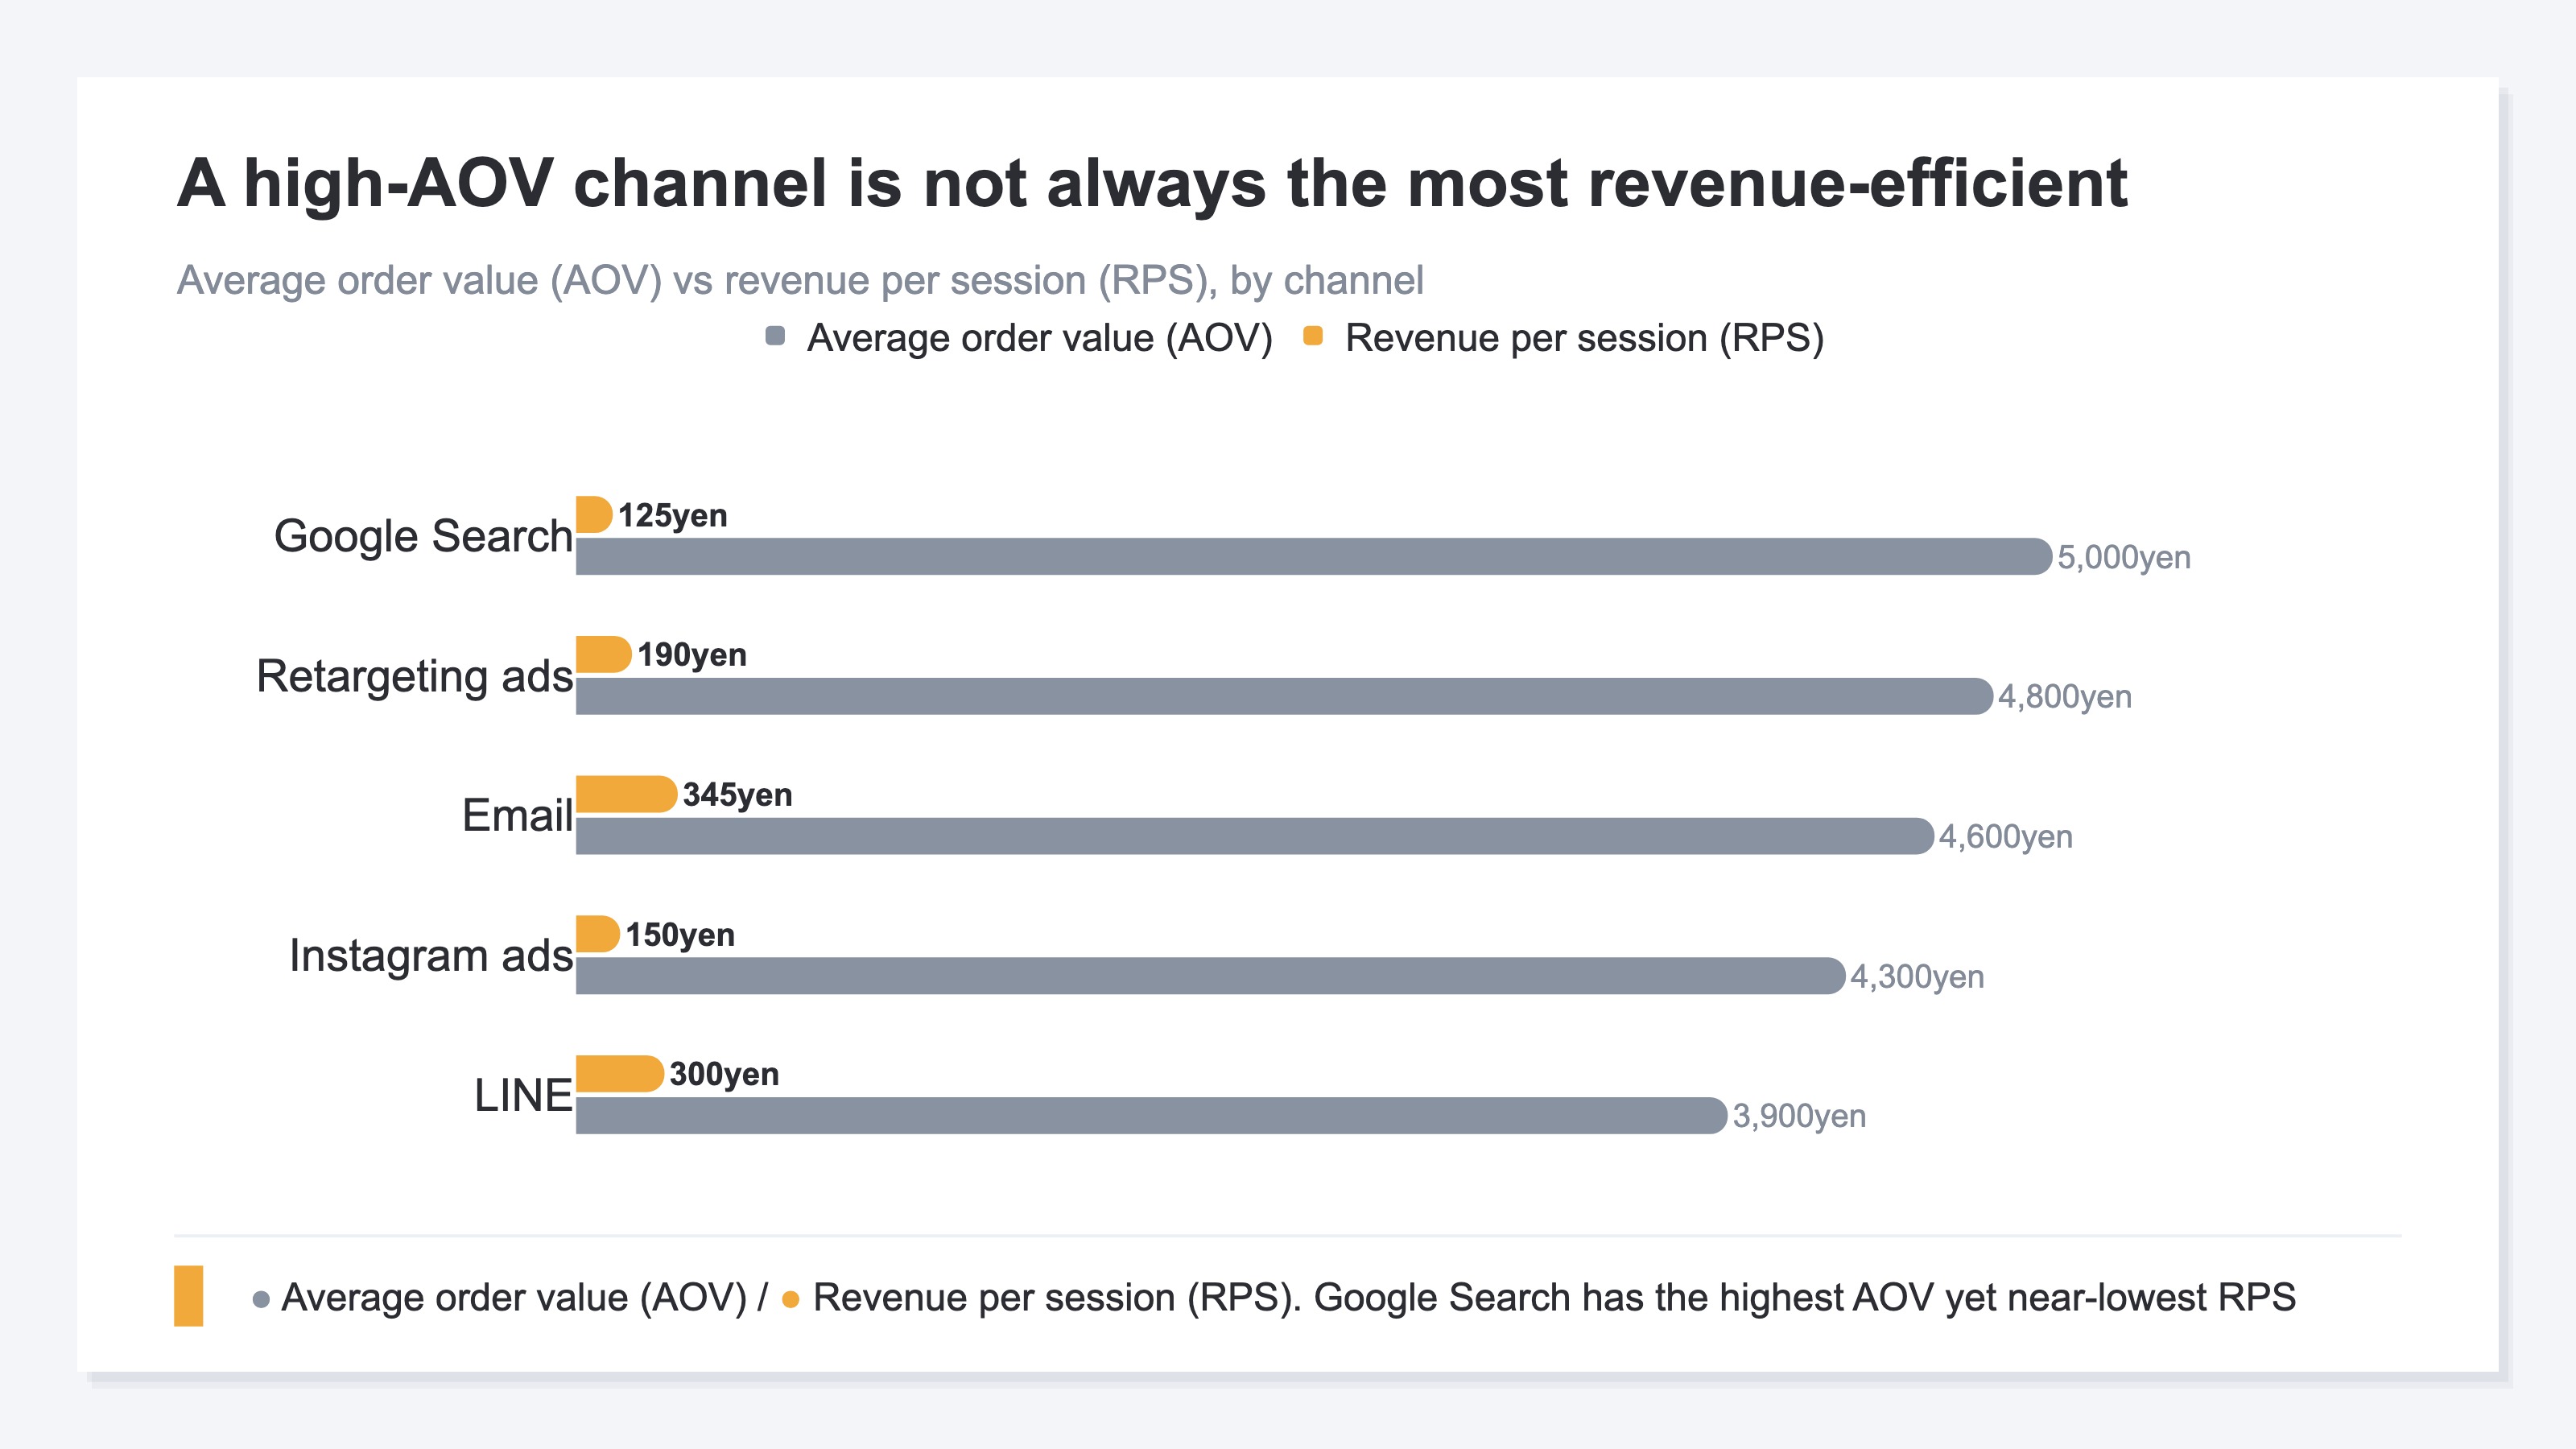
RevenueScope dashboard (demo data shown). Revenue, RPS, AOV, and CVR line up on one screen by channel.
In the screen above, Google search has the highest AOV (5,000 yen) but a low RPS of 125 yen, while the email newsletter has a mid AOV (4,600 yen) yet, thanks to a high purchase rate, the top RPS at 345 yen. The reversal — "highest AOV doesn't mean best revenue efficiency" — is clear at a glance once the channels are lined up side by side on one screen. The monthly job of re-aligning that same table with bots excluded is replaced by an always-on view, set up with one tag.
RevenueScope is not a replacement for GA4 — it complements it. Detailed user-behavior analysis with GA4, daily channel-level revenue-efficiency decisions with RevenueScope: split the roles that way. What RevenueScope specializes in is the five revenue-based KPIs (Revenue / AOV / RPS / CVR / Sessions) — seeing, by channel, whether traffic is turning into revenue.
FAQ#
Q. Isn't GA4 alone enough?
GA4 is the main tool for analyzing user behavior, and there is no need to drop it. But keeping "channel-level revenue efficiency, bot-excluded, lined up on the same screen every month" is outside the scope of GA4's standard reports. Behavior analysis with GA4, daily revenue decisions with a dashboard built for it — splitting the roles is the realistic approach.
Q. Are free analytics tools enough?
For grasping visit counts, yes. But many are weak at channel-level revenue analysis, which can leave revenue decisions wanting.
Q. What about open-source tools?
Privacy and customization are strong, but build and operations take resources. It comes down to whether you have a development team in-house.
Conclusion#
There are many analytics tools, but the criterion for choosing is simple. Three points.
- Choose by "the numbers you want to see," not by feature count
- For most EC owners, the goal is a revenue decision. But keeping channel-level, bot-excluded revenue efficiency lined up on one screen is structurally hard with a general-purpose tool's standard features
- "One tag, and you keep channel-level revenue metrics bot-excluded and aligned" is the criterion when choosing by revenue
When the feature count overwhelms you, return to "what do I want to know." To grow revenue in EC, choose the tool that gets you to the revenue numbers fastest.
See which ads actually drive revenue, at a glance
Free up to 5,000 sessions/month, AI analyst included. No credit card required. Up and running in 5 minutes.
References#
- [1] Google Analytics Help "Ecommerce in Google Analytics" Help 2026
- [2] Statista "Online shopper conversion rate worldwide by industry" Statista 2024
- [3] Matomo "Matomo Analytics" matomo.org 2026
- [4] PostHog "Product analytics" posthog.com 2026
- [5] RevenueScope "RPS (revenue per session): definition and formula" /en/news/rps-revenue-per-session-guide 2026