
"There's decent traffic, but I can't tell which channel is actually generating revenue." If you run an online store, this is a familiar problem.
Your admin shows visitor counts and PV, but how much revenue that traffic became is often invisible. Often what should have come from ads gets labelled as "Direct" (traffic recorded as if the person came straight to the site), so you can't identify the source. When the source disappears, you misjudge which channel deserves budget.
This article compares four online store services widely used in Japan — BASE, STORES, Shopify, and Color Me Shop — on "how far you can see, by default, where your sales come from," based on each company's official information.
Contents
TL;DR#
The conclusion first.
- Many online stores show "traffic counts" but not "revenue by channel"
- When a checkout moves to another domain, the referrer is lost and shows up as "Direct" in analytics — which throws off channel judgment
- Even among online stores, how far you can see revenue efficiency by channel varies a lot: BASE shows only traffic shares, while Shopify, Color Me Shop, and STORES show revenue by source (STORES reaches net revenue by source on the free plan too)
- What you really want is "how much each channel sells per visit (RPS)." More traffic does not mean higher revenue efficiency
1. Why online stores struggle to show revenue by channel#
Conclusion: many services handle "traffic" and "revenue" on separate screens, so revenue by channel is hard to connect.
There are two main reasons.
First, traffic analysis and revenue analysis are split. Access analytics shows "how many came from where"; revenue analysis shows "what sold for how much." When these live on separate screens, "which channel generated how much revenue" isn't visible at a glance.
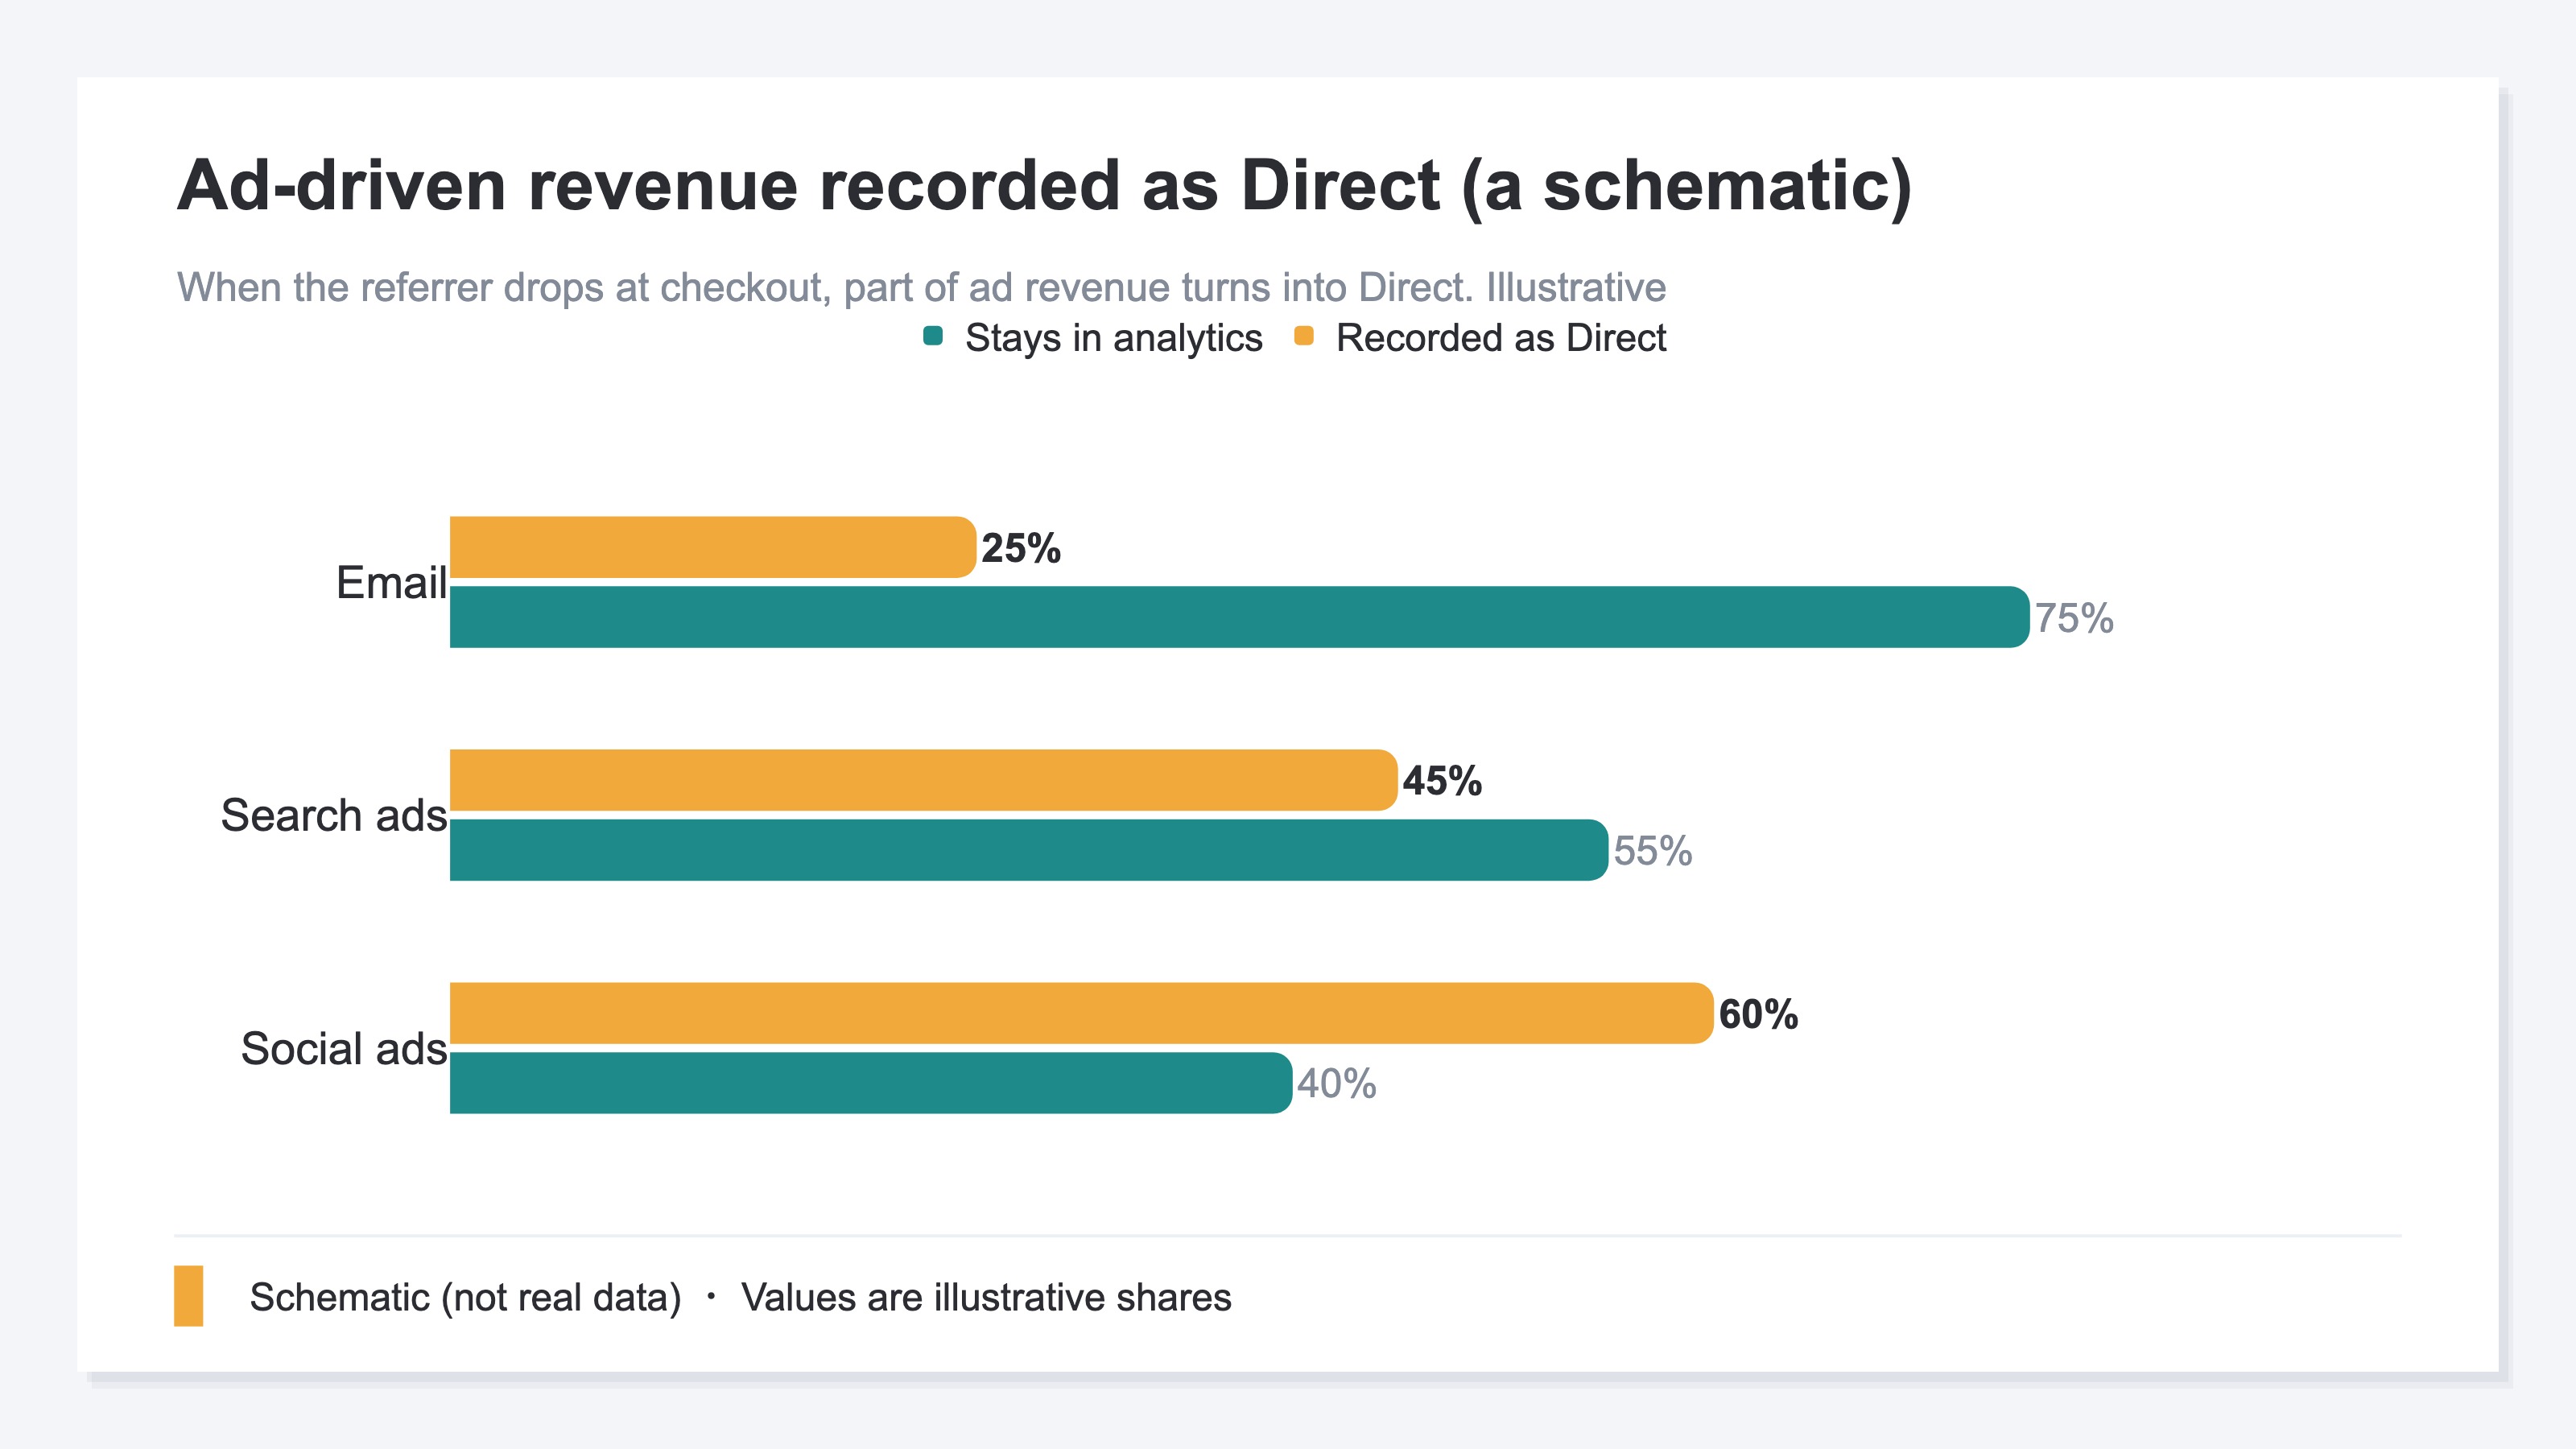
Second, loss of the referrer at checkout (turning into Direct). When moving from the cart to payment, some services switch to a different domain. The original source (search or ads) isn't carried over, and analytics records it as "Direct." Purchases fall into Direct because the referral params get dropped.
When these two combine, this happens: ad-driven sales turn into Direct, so a channel that is actually working looks like it produced nothing. Meanwhile a channel that merely got the last click is overvalued. The result is budget sent to the wrong channel. The risk of deciding on the final touch alone is covered in Why moving budget on last-click alone costs you.
There are ways to mitigate it. Setting up "cross-domain measurement" so the referrer carries over even when checkout moves to another domain, and "referral exclusions" to drop your own domain as a source, both reduce Direct inflation. But each needs initial setup plus a review every time a domain or tag changes. The causes and fix order for rising Direct are in The 5 causes of rising GA4 "Direct/(none)" and how to fix them.
2. Comparing 4 online stores on channel analytics#
Conclusion: three lenses make the differences clear.
The three lenses to check:
- Does it show traffic channels by default (and at what granularity)?
- Is it resistant to turning into Direct at checkout?
- Can you see revenue efficiency by channel?
Comparing the four services on these lenses:
| Service | Traffic channel visibility | Direct-resistance at checkout | Revenue by channel |
|---|---|---|---|
| BASE | Search/Direct/SNS — 3 buckets, share only [1] | Splits easily unless configured | Not shown (sales channel split only) [1] |
| STORES | Source-level analysis (free plan too) [2] | Splits easily unless configured | Net revenue by source [2] |
| Shopify | Referrer source + the specific domain [3] | Tends to turn into Direct with GA4 | Revenue by referrer in standard reports [4] |
| Color Me Shop | Source + search keyword (standard on paid plans) [5] | Strong — captures even in-cart logs itself [5] | Revenue by source [5] |
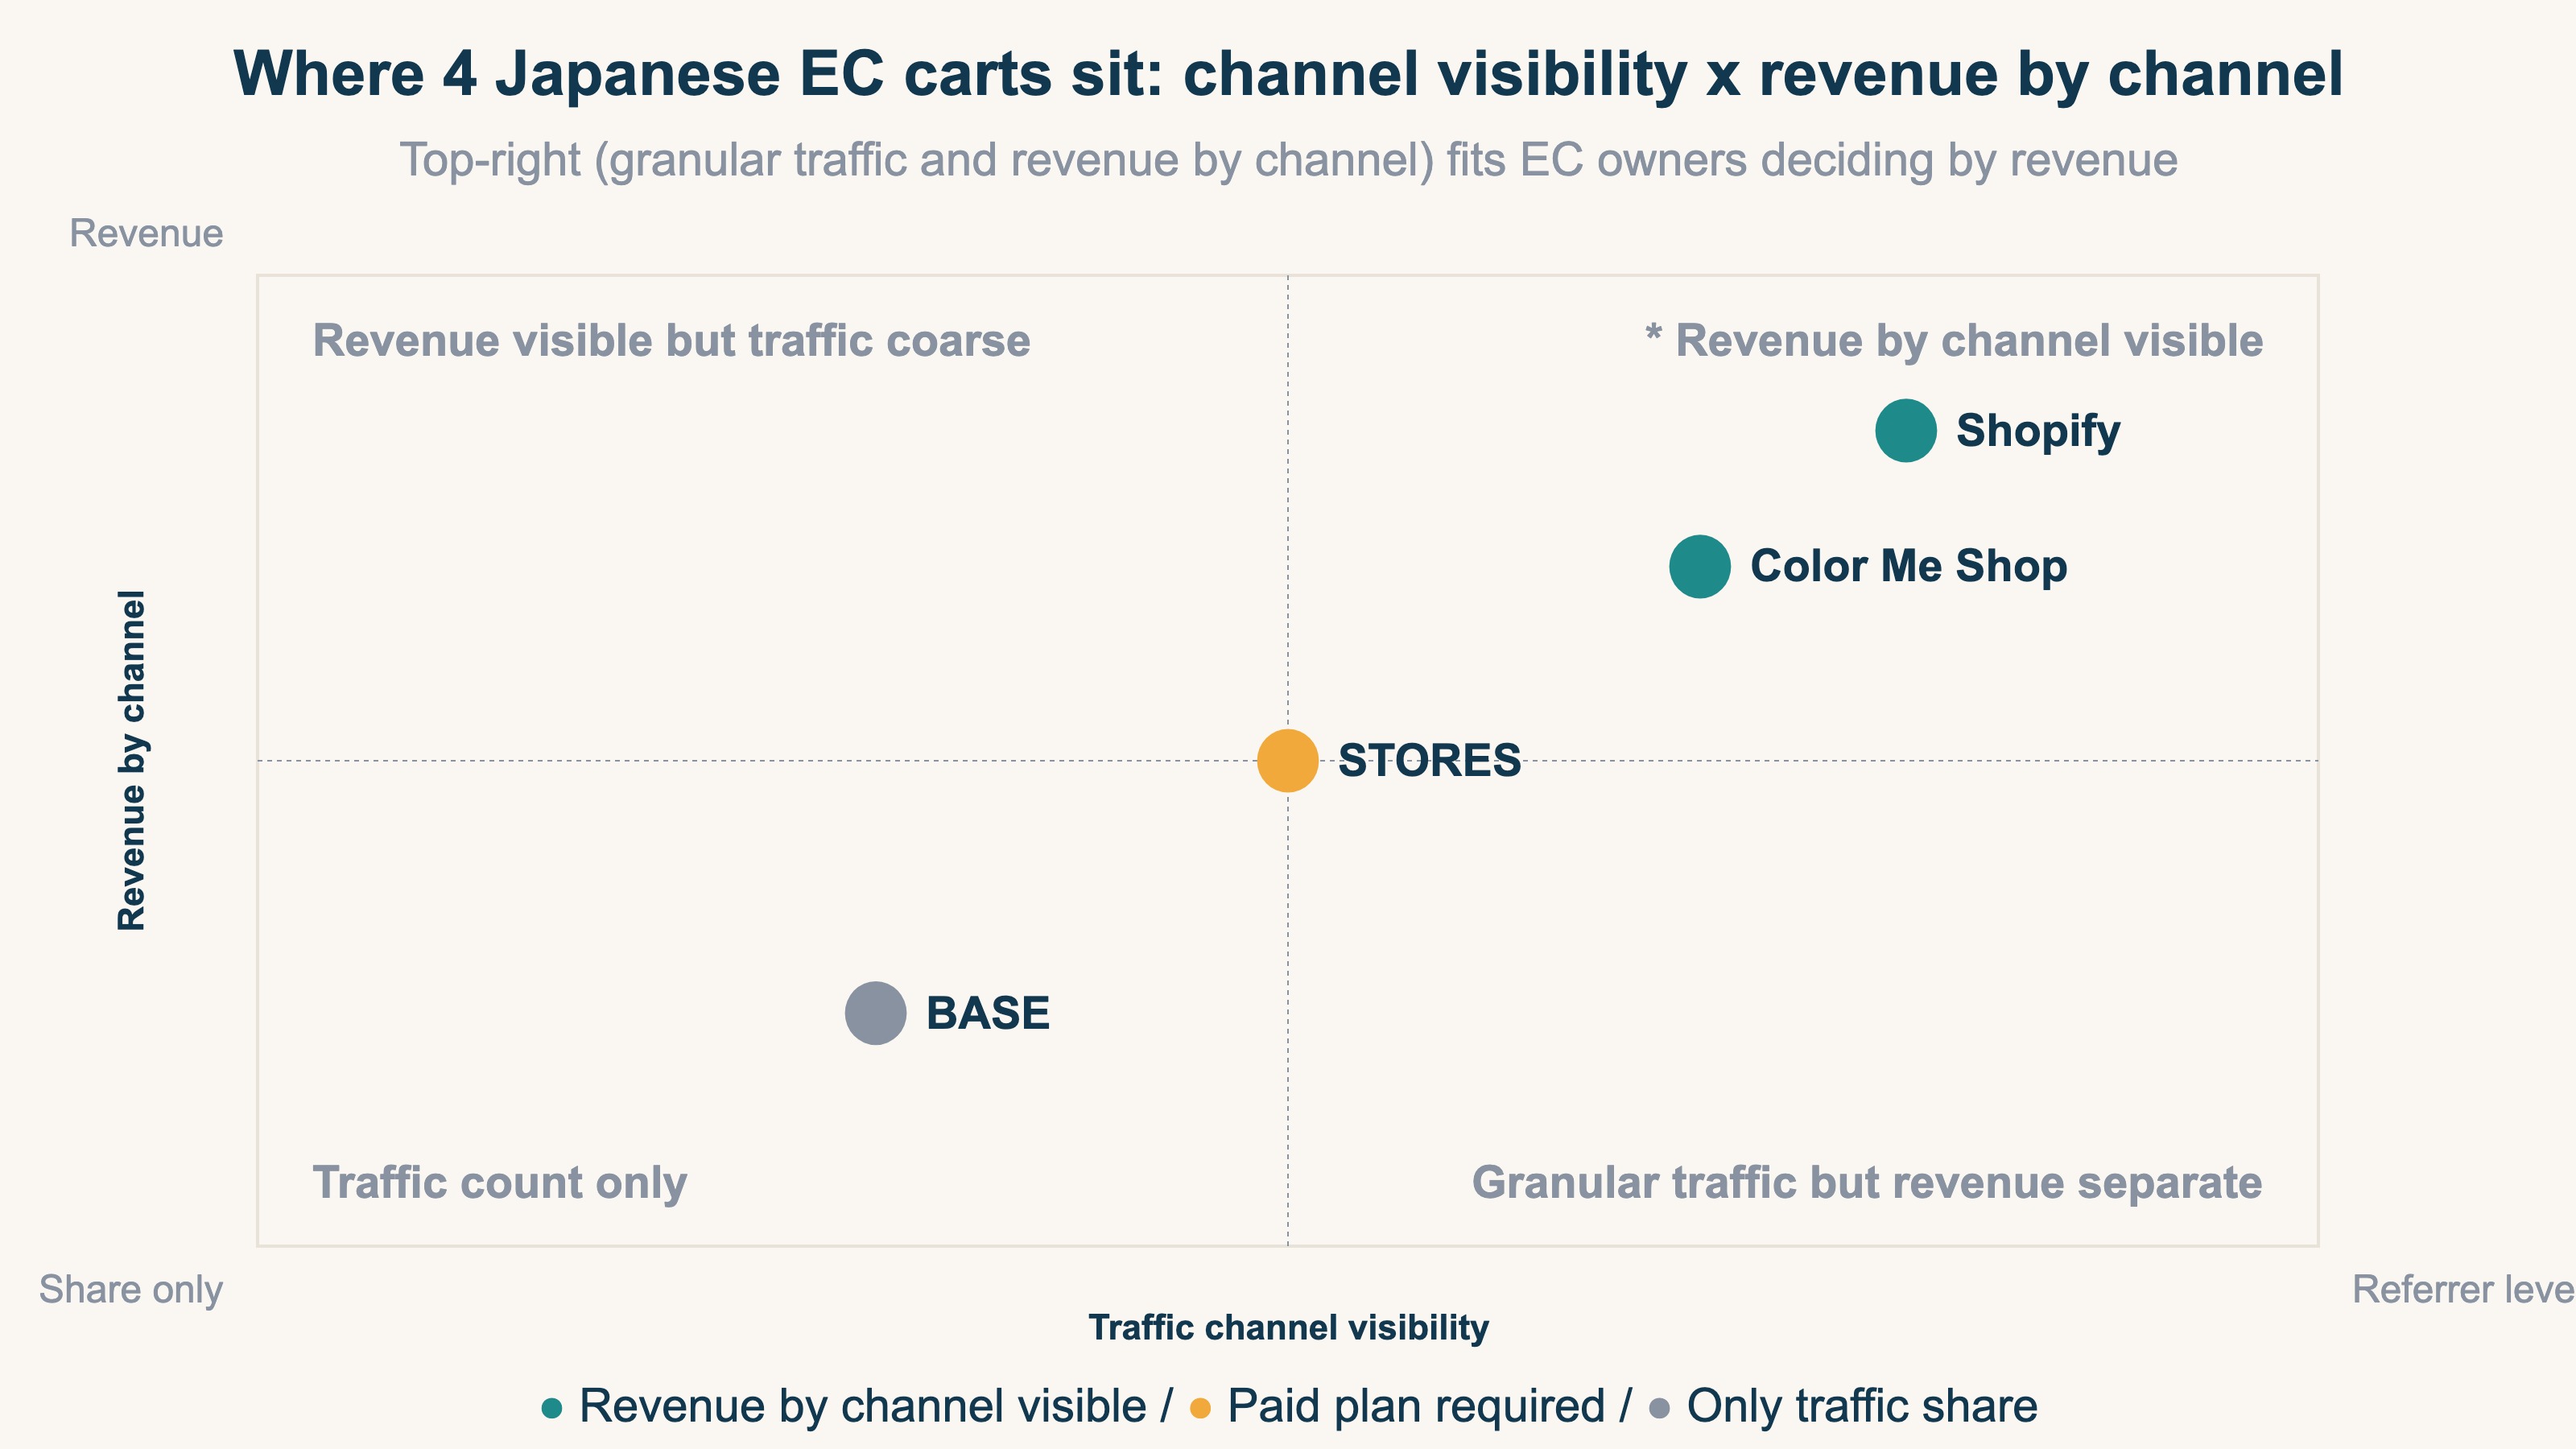
There is no universal "best" — it's about fit with what you want to see. Whether "traffic counts are enough" or "I want revenue by channel" changes which service, or which add-on tool, you need. From here, we read each of the four, plan differences included.
BASE: traffic only as a share across 3 buckets#
BASE is free to start and also offers paid plans. On any plan, though, the traffic sources shown in the "Data" screen go only as far as a share across three buckets — search engine / direct / SNS. It doesn't break referrers down finely, and it doesn't show revenue by channel. Revenue is split only by sales channel ("Web / PAY ID app") [1]. The simplicity is a real strength, but to see revenue by channel you need another route. Concrete ways to see BASE revenue by channel are in How to see BASE revenue by channel.
STORES: net revenue by source, on the free plan too#
STORES lets you see traffic-source-level visits and orders under "Data analysis (shop analytics)." And by source it shows visits, visitors, orders, purchase rate, and net revenue too. This works on both the free plan and the Standard plan — there's no feature difference between them [2]. Even if you start on the free plan, revenue analysis by source does appear on screen. The caveats for tracking "where sales came from" in STORES are in Reading revenue sources in STORES analytics.
Shopify: revenue by referrer in standard reports#
Shopify's strength is standard reports. Beyond "sessions by referrer," it shows "sales by referrer" by default. Sources split into Direct / Search / Email / Social and down to the specific domain [3][4]. One caveat, though: the docs state that the acquisition report shows visitors only — not sales or order counts [3], so misreading the report means mistaking traffic for revenue. And when you add GA4, the checkout runs through a different domain and purchases easily turn into Direct — a point many operators hit. "Visible in the store admin" and "lost in GA4" coexist, so treat them separately. How to fix referrers showing as (none) is covered in Why Shopify referrers show as (none), and how to fix it.
Color Me Shop: tracks into the cart and resists Direct#
Color Me Shop's proprietary "Access Plus" tool (standard on paid plans) is the strength. You can see revenue by source (referring site) and cart progression rates. Because it captures even in-cart (SSL page) access logs itself — which others struggle to collect — it's resistant to turning into Direct at checkout [5].
In short: revenue by source reaches you by default with Shopify, Color Me Shop, and STORES; BASE shows traffic shares only. Checking whether each tends to turn into Direct with GA4 also helps you avoid the later "the ads look like they aren't working" trap.
3. See revenue efficiency by channel in one view#
Conclusion: what you really want is "how much revenue each channel generates per visit."
When comparing channels, looking only at total revenue favors high-traffic channels. That's where RPS (revenue per session) helps.
RPS = Revenue / Sessions
RPS rolls order value and purchase rate into one number. A high order value with a low purchase rate lowers RPS; a mid order value with a high purchase rate raises it. So "more traffic" doesn't mean "a better channel." For the basics of RPS, see What is RPS: the metric, formula, and how to get it in GA4.
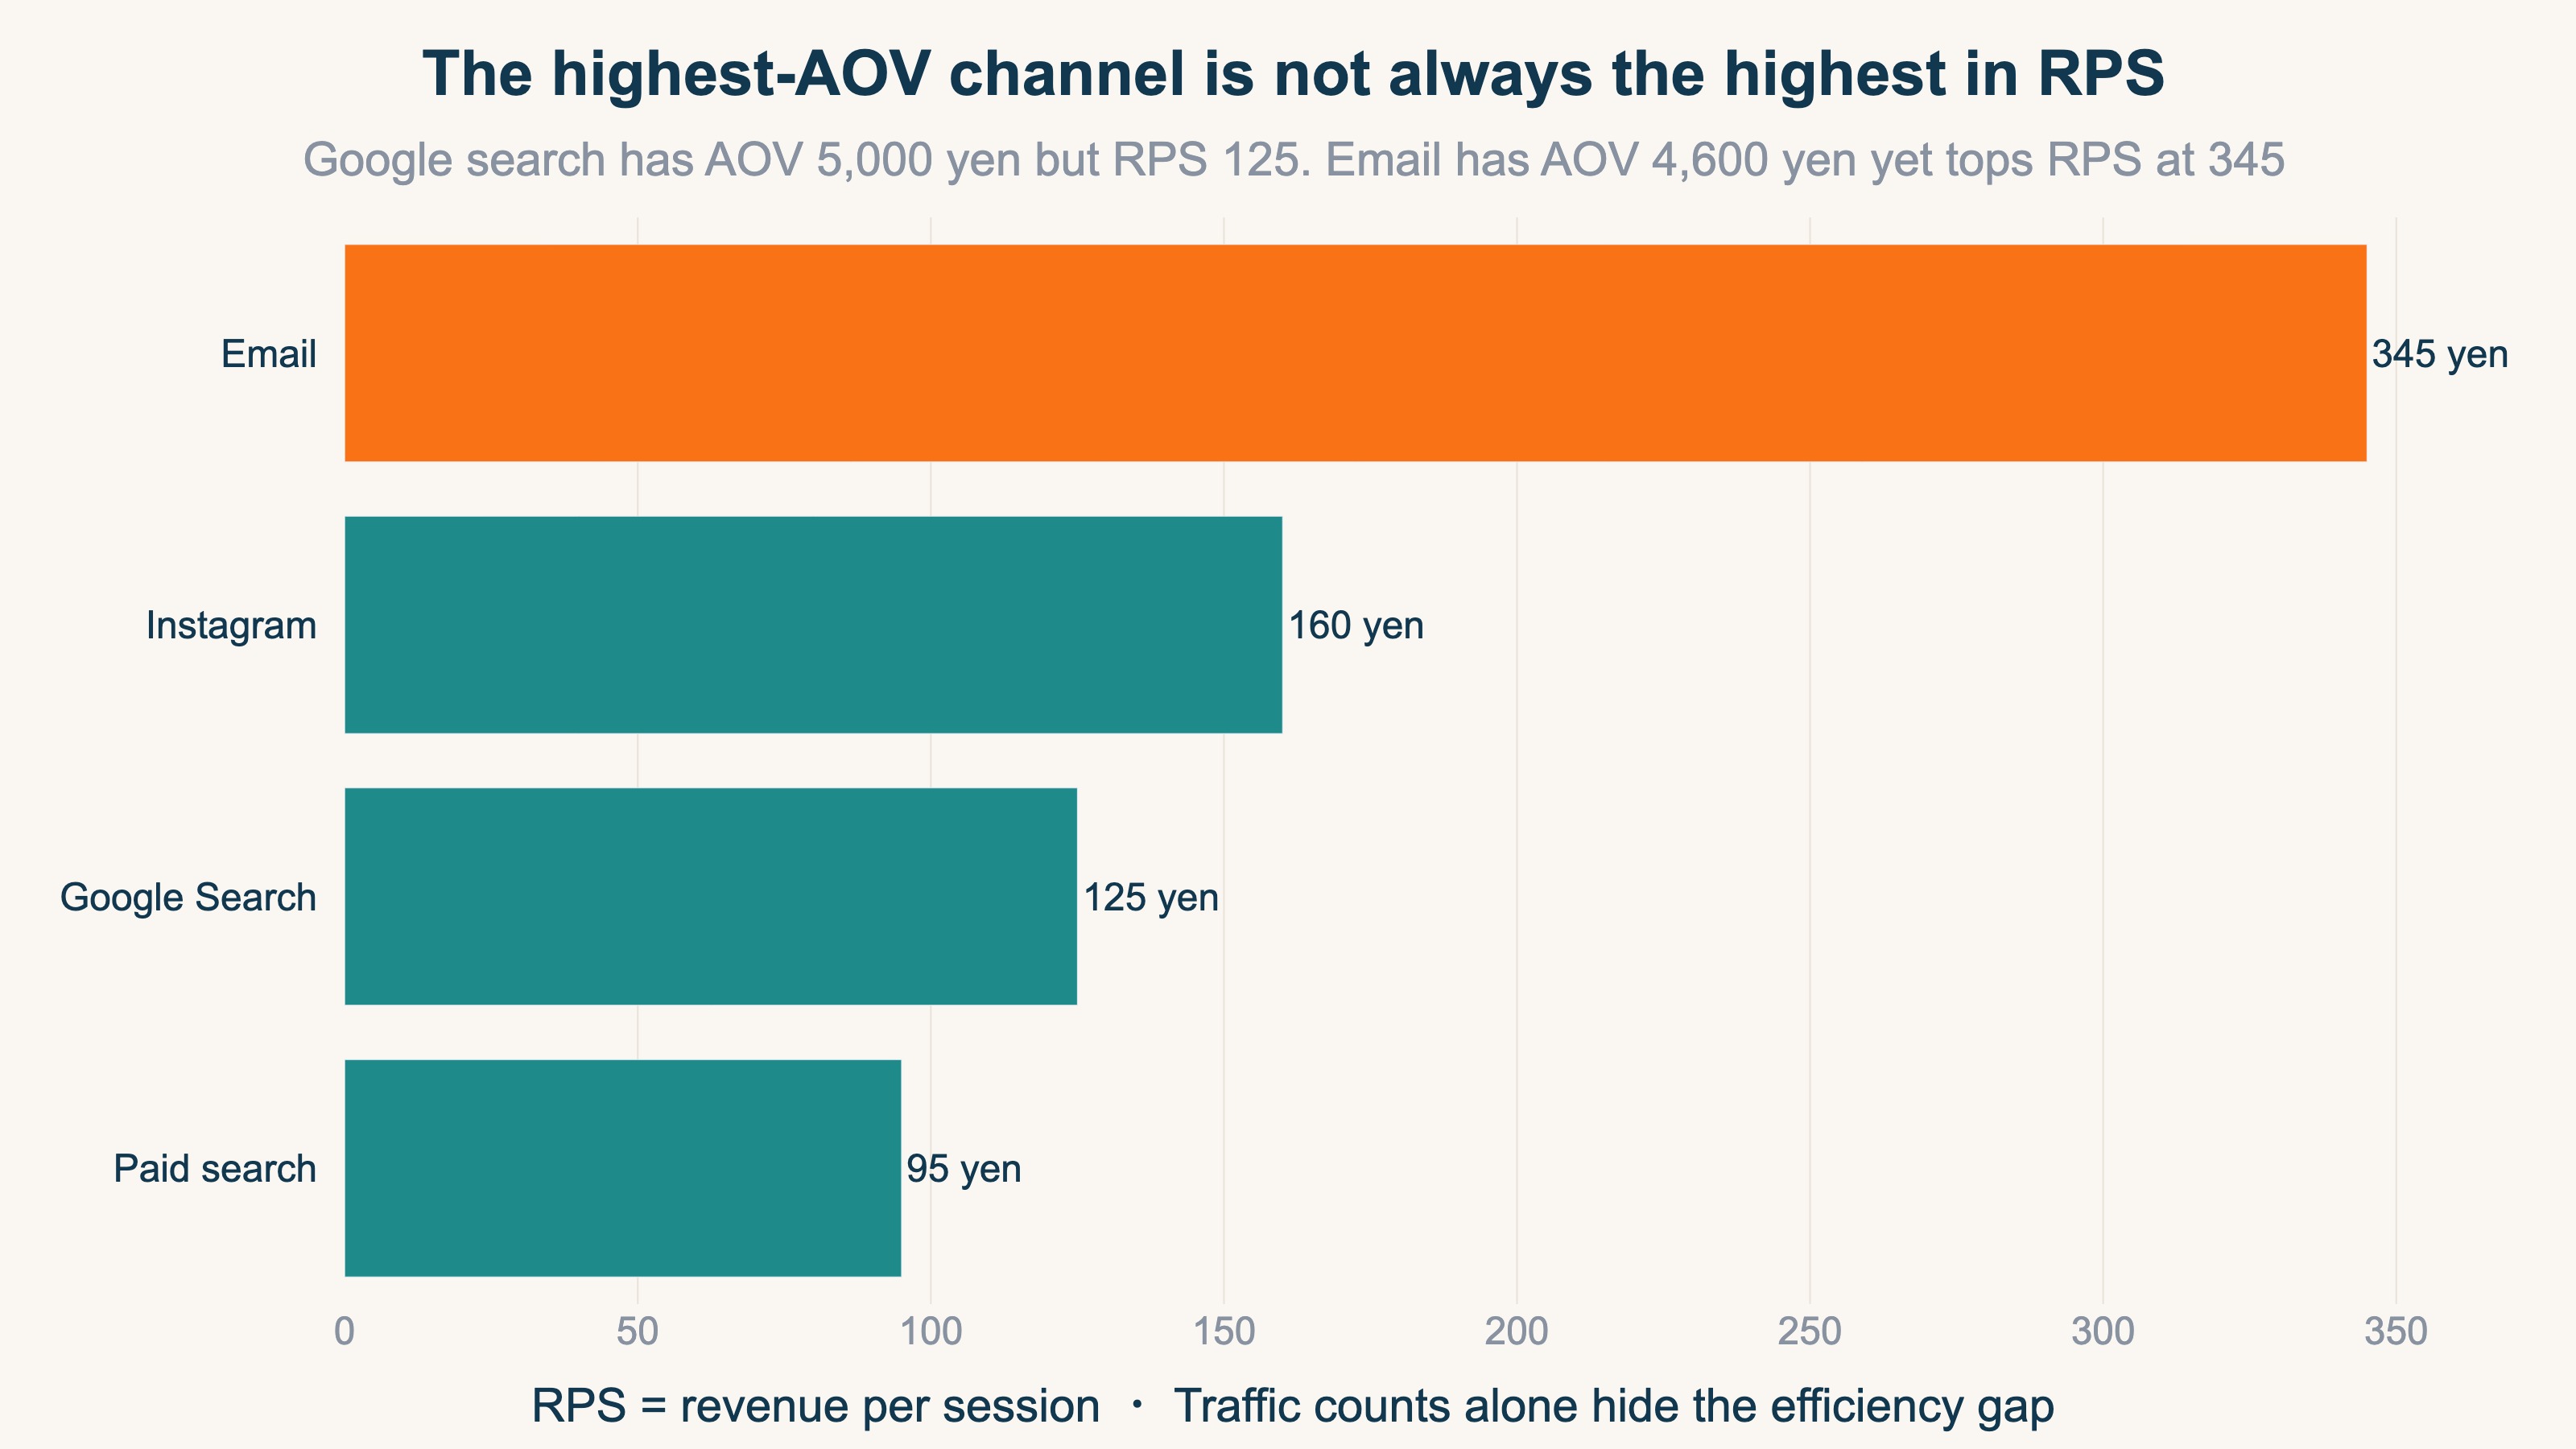
The figure above compares RPS by channel on a sample fiction site. In one view you can see that more traffic doesn't mean higher revenue efficiency. With standard features alone, seeing this across channels — on one consistent basis — takes effort. That's exactly why "revenue efficiency by channel in one view" decides your speed of judgment.
RevenueScope's solution
Services differ in what they show, and the referrer can disappear at checkout. For someone who wants to know "which channel generates revenue" right now, it's a detour. Untangle it, and you often surface the channel that was really working — and can shift budget accordingly.
RevenueScope is a lightweight, revenue-focused dashboard you can use by adding a single tag to GA4. Regardless of the store, it lines up sessions, revenue, and RPS (revenue per session) by channel on one consistent basis. On top of that, you can switch the attribution model (which touchpoint gets the credit) to compare revenue attribution that Direct tends to distort. Last-click, first-click, linear, and time-decay switch in one click, and any revenue tied to no channel shows as an "Unattributed" row rather than being hidden.
Ask "which channel is driving my revenue?" and RevenueScope returns this (numbers are from a sample fiction site):
| Channel | Sessions | Revenue (yen) | RPS (yen) |
|---|---|---|---|
| Direct | 230 | 137,253 | 596 |
| Google Search | 381 | 128,459 | 337 |
| Gemini | 35 | 33,188 | 948 |
| Google Ads | 167 | 27,839 | 166 |
| Meta | 191 | 15,633 | 81 |
| Claude | 10 | 12,088 | 1,208 |
In this table, Meta has high traffic at 191 sessions, yet the lowest RPS at 81 yen (revenue 15,633 yen). Meanwhile Gemini and Claude, with just 35 and 10 sessions, post RPS of 948 and 1,208 yen. Looking at traffic counts alone, you'd mistake Meta for a winner. Even without expertise, you can decide to "shift the budget leaning on Meta toward higher-efficiency channels."
For channels with connected ad spend (Google Ads / Meta), measured ROAS (revenue relative to ad spend) and saturation appear on the same screen. In this sample, Meta carried heavy ad spend at ROAS 1.88 and 73% saturation, so its low revenue efficiency also showed on the ad side. ROAS is calculated only for channels with connected ad spend (Path B).
RevenueScope's job is the daily revenue-by-channel decision. Detailed user-behavior analysis stays with GA4, and channel-level revenue decisions run on RevenueScope — a complementary fit.
FAQ#
Q. Aren't a store's standard analytics enough?
Often they're enough for traffic counts. But if you want "revenue by channel," some services require another route.
Q. Why do ad-driven sales become "Direct"?
Because when the checkout moves to a different domain, the original source isn't carried over. Cross-domain measurement and referral exclusions can improve it, but the setup and later upkeep take effort.
Q. If I'm choosing an online store now, which is best?
If you want to see revenue by channel yourself, Shopify, Color Me Shop, and STORES reach revenue by source by default (STORES on the free plan too); if grasping traffic shares is enough and you want to start simply, BASE. Ultimately, choose on the assumption that you'll fill any gaps with another tool. For how to weigh the options, see Choosing an EC analytics tool.
Conclusion#
At a glance, online store channel analytics all look like "analytics included," but the substance differs a lot. Whether you can see not just "traffic counts" but "revenue by channel" on one consistent basis decides your speed of budget judgment. Do the store's standard features suffice, or do you fill the gaps with another tool? Coming back to "what do I want to know" is the shortcut.
See which ads actually drive revenue, at a glance
Free up to 5,000 sessions/month, AI analyst included. No credit card required. Up and running in 5 minutes.