"Can my cart actually track purchases?" It is a common worry when choosing a shopping cart.
Most cart comparisons end at one question: "does it support dataLayer or GTM" — the support yes/no. Whether you can send a purchase event is, of course, an important entry point. But the real difference lies beyond it. Can you split the data you captured into revenue efficiency by channel and decide where to invest next? That is where carts diverge. In this article, we map the purchase-tracking support and setup effort of five main carts, then carry you through to the revenue call that lives beyond the setup.
Table of Contents
TL;DR#
Here are the takeaways up front.
- Carts are usually compared by "can it measure purchases via dataLayer or GTM," but support is only the entry — never the whole story
- Across five main carts, support and setup effort vary widely: easier carts give less analytical freedom, while freer carts take more to build
- Even "freely analyze" only means you can capture raw events. It does not mean revenue efficiency by channel comes out automatically
- The real difference shows after you can measure. Split the same revenue by channel and the efficiency reverses — the channel with the most traffic is not always the most profitable
- This side-by-side of channel-level revenue efficiency (RPS) is structurally absent from GA4's standard reports and from cart defaults
1. What dataLayer support actually means#
Bottom line: the dataLayer is "a box that hands what happened on your site to your measurement tools." GTM is the mechanism that reads that box and sends it on.
EC measurement needs to send events — "viewed a product," "added to cart," "purchased" — as numbers. A dataLayer is the box you first drop the details into (amount, product name, quantity). GTM (Google Tag Manager) is the mechanism that reads that box and sends it to GA4 or your ad platforms [1].
"Supports dataLayer" roughly means "purchase and other events get dropped into this box in a fixed format." When the box is in order, the GTM side of the setup gets easier. On a cart with no box, you start by picking up events yourself and placing them in the box.
The thing to remember is that support is an entry-point question: can you, or can't you. Even once you can send events, how you read those numbers is a separate problem. Let's first compare how much the main carts differ at the entry.
2. Comparing purchase tracking across five carts#
Bottom line: support and setup effort differ greatly by cart, and there is no single right answer.
Here are five carts common in Japan, laid out by how they send purchase events and how much setup they take.
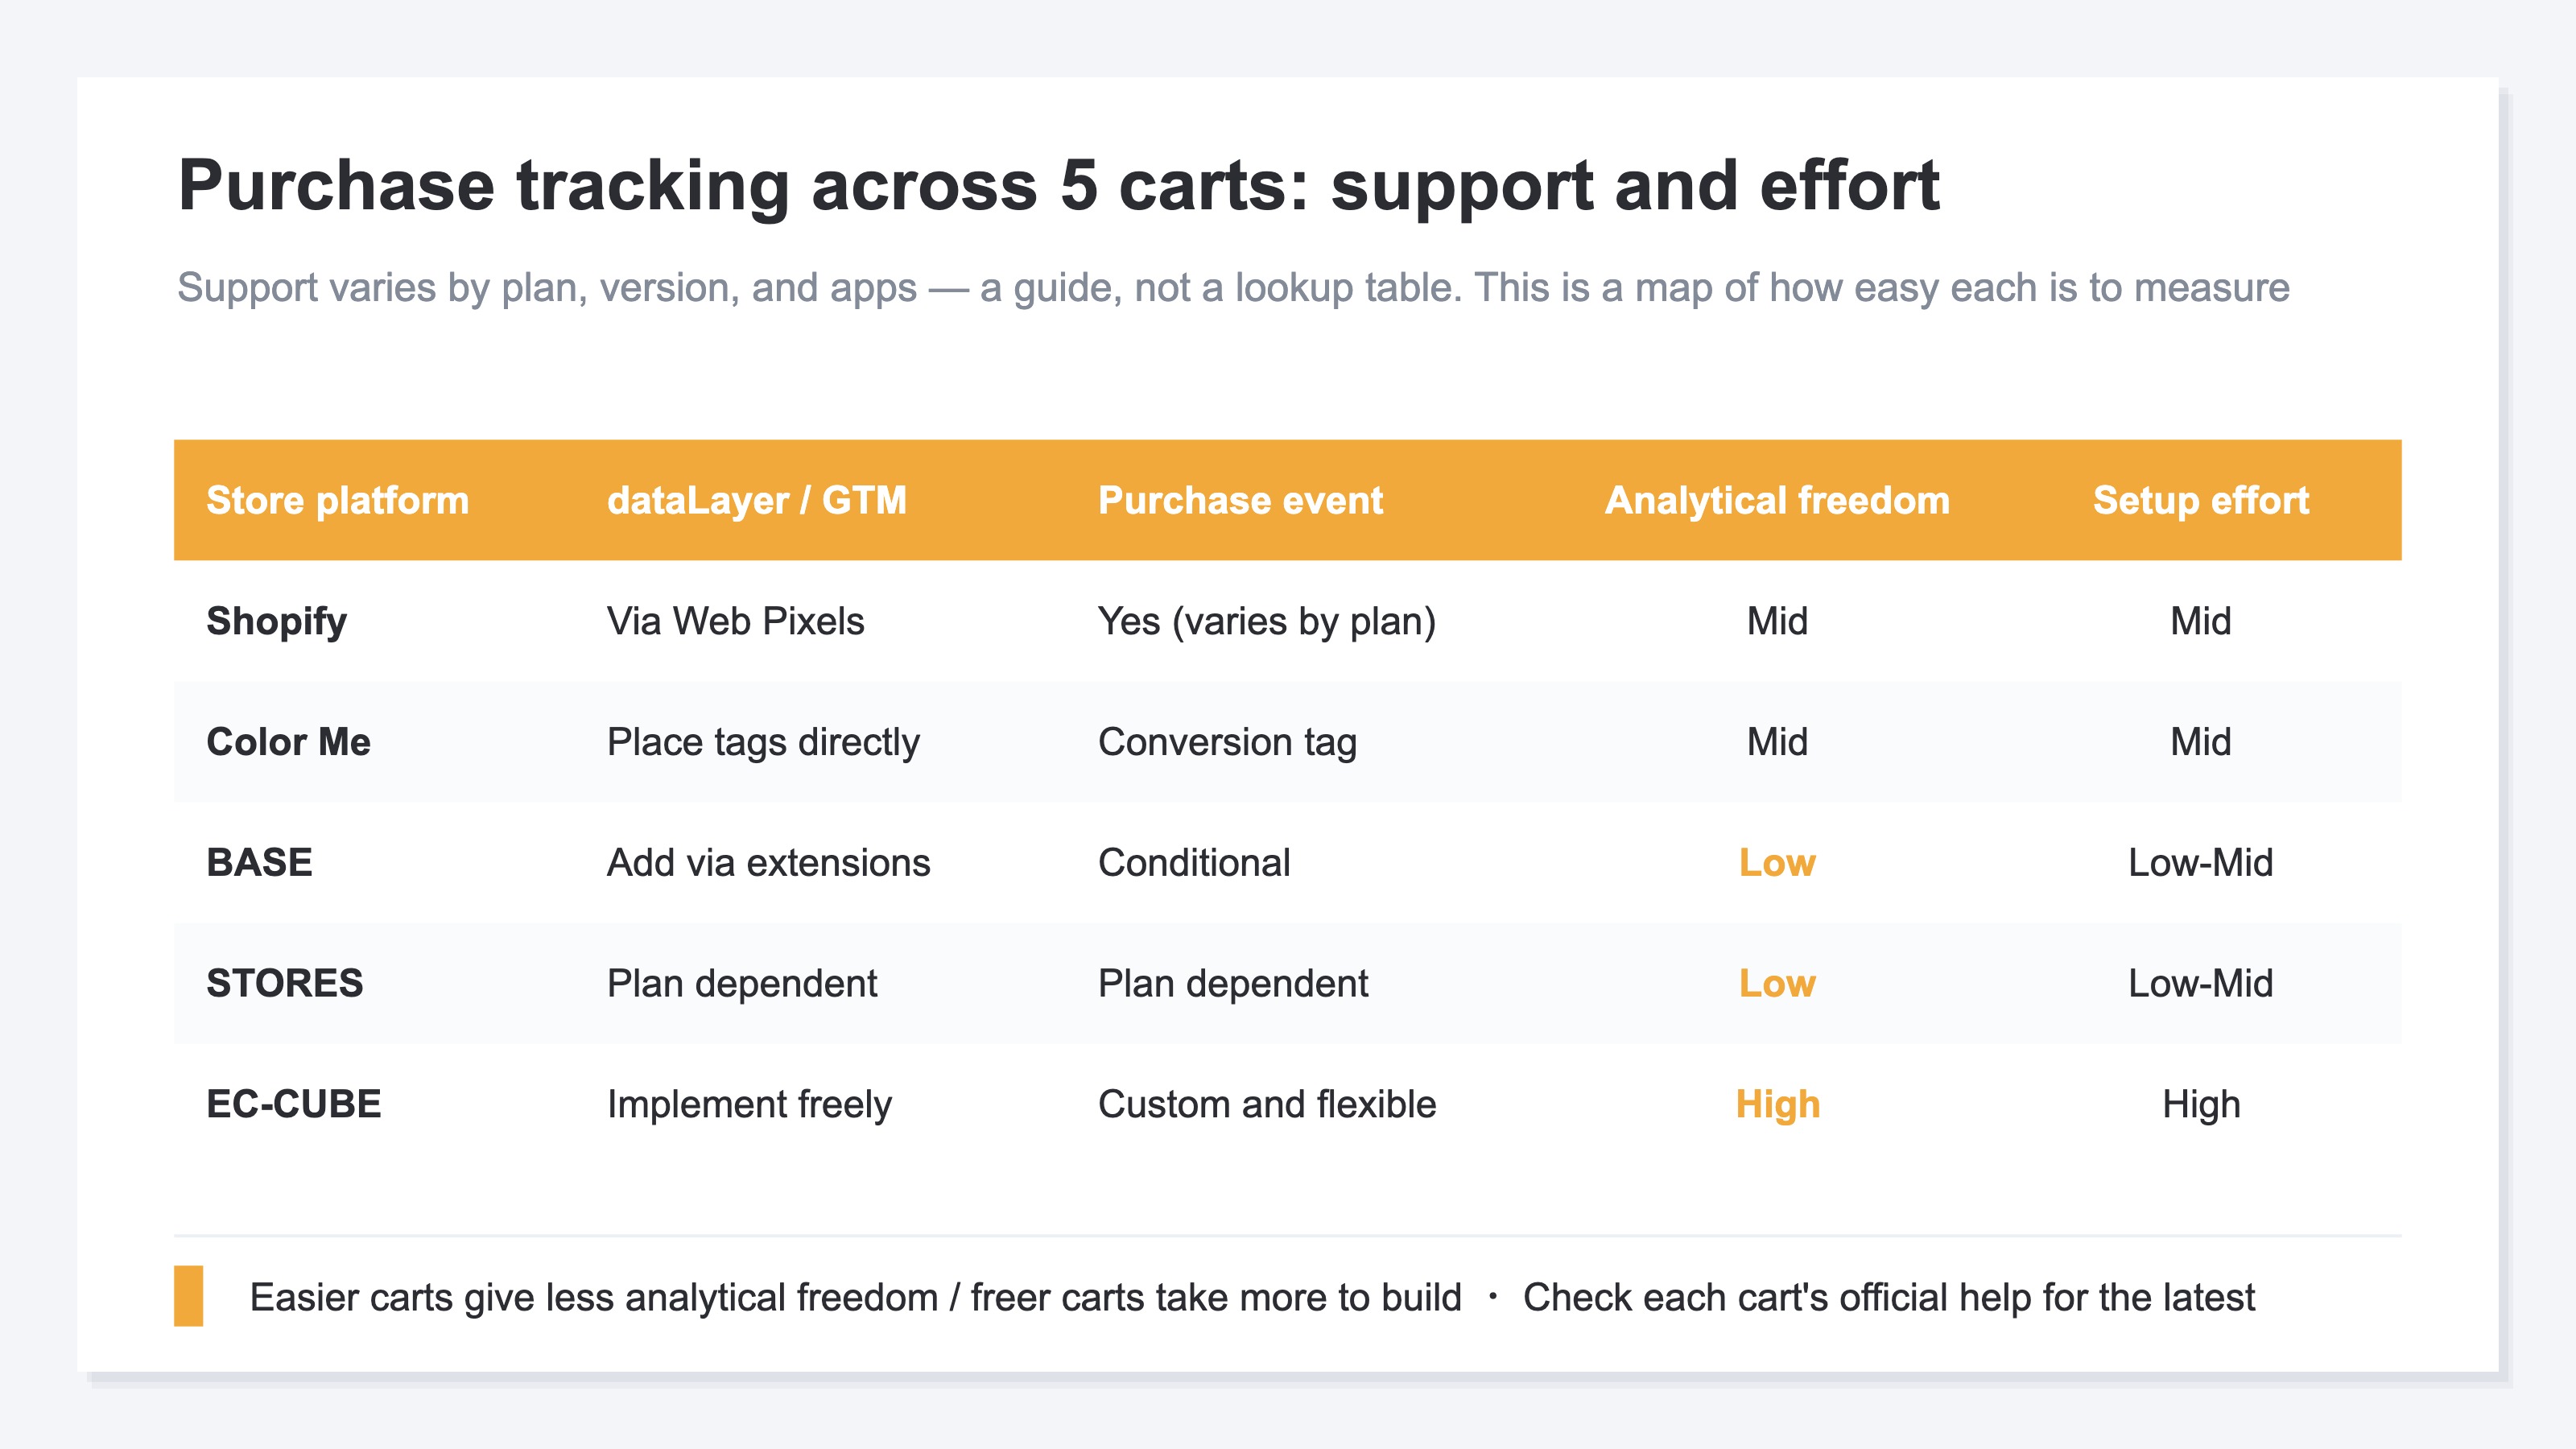
Carts roughly fall into three types.
The first is the built-in type. Shopify adds measurement through Web Pixels (Customer Events) [3]. Color Me lets you place tags directly in its admin [5]. Because you ride a fixed approach, you rarely stumble at the entry.
The second is the easy-but-limited type. BASE adds measurement via extensions [4], and STORES varies by plan. They start quickly, but the data you can send and the analytical freedom are limited.
The third is the free-but-heavy type. EC-CUBE lets you touch the source, so you can drop events into the box in any shape. In exchange, the setup needs developer hands, and the effort is large.
One caution: support varies by plan, version, and the apps you install. Read this table as a map of "which is easier to measure," not as a lookup table of the right answer. The safest move is to confirm the latest support in each cart's official help.
3. Ease of setup vs analytical freedom#
Bottom line: almost no cart reaches the top-right — "quick to use and free to analyze."
Beyond support, plot the five carts on two axes — "ease of setup" and "analytical freedom" — and a pattern appears.
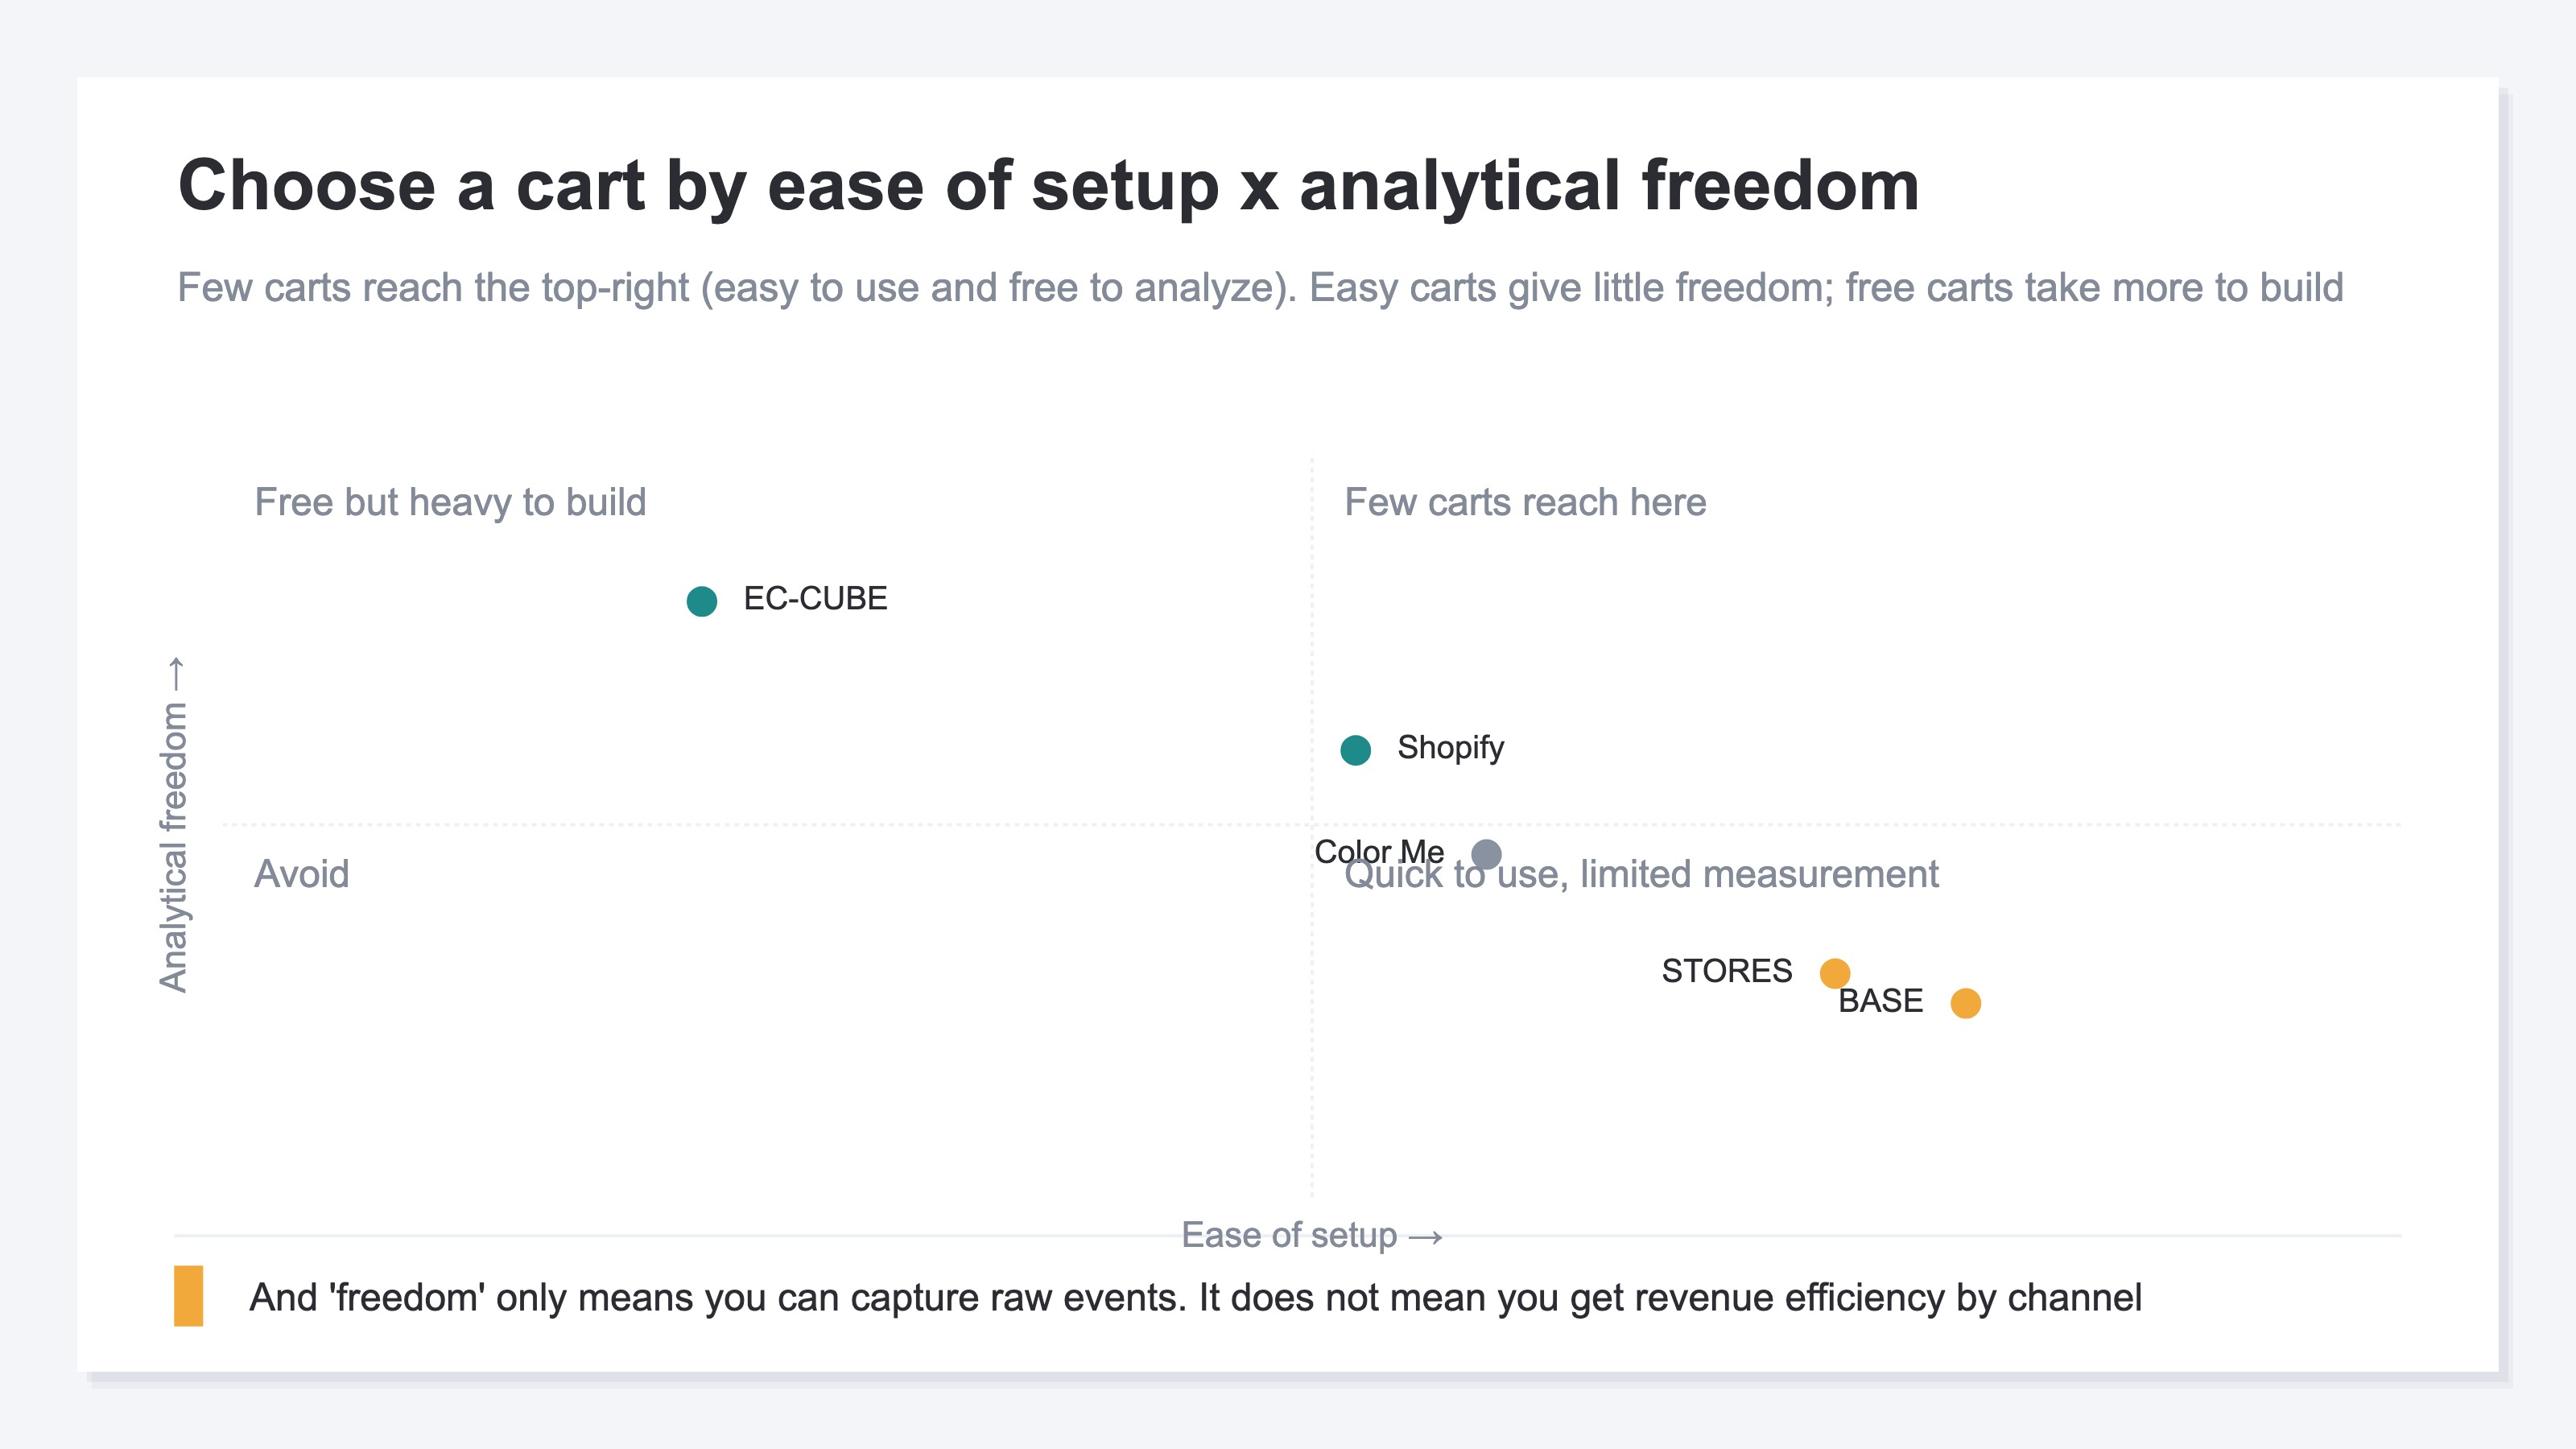
The carts line up diagonally, leaving the top-right empty. BASE and STORES, which are easy to start, have lower analytical freedom. EC-CUBE, high on freedom, takes effort to build. Shopify sits in between. In other words, few carts reach the convenient spot of "easy to set up and free to analyze."
And there is a more important point. The "analytical freedom" here only means you can capture raw events in any shape you like. Even a high-freedom cart only gives you the raw material — "when, how much, what was bought." It does not line up that material into revenue efficiency by channel (which traffic sells efficiently) automatically.
Put differently, wherever you land in the four quadrants, you stop at having set up the measurement entry. The real decision-making material is something you assemble yourself, after you can measure.
4. The real gap shows after you can measure#
Bottom line: split the same revenue by channel and the efficiency reverses. This is the main event beyond the measurement entry.
Say you can now send purchase events [2]. The next wall is the question, "so which traffic is actually selling efficiently?" That is where the gap opens.
For example, work out "revenue per session (RPS)" by the channel that brought the traffic, and the ranking you expected can flip.
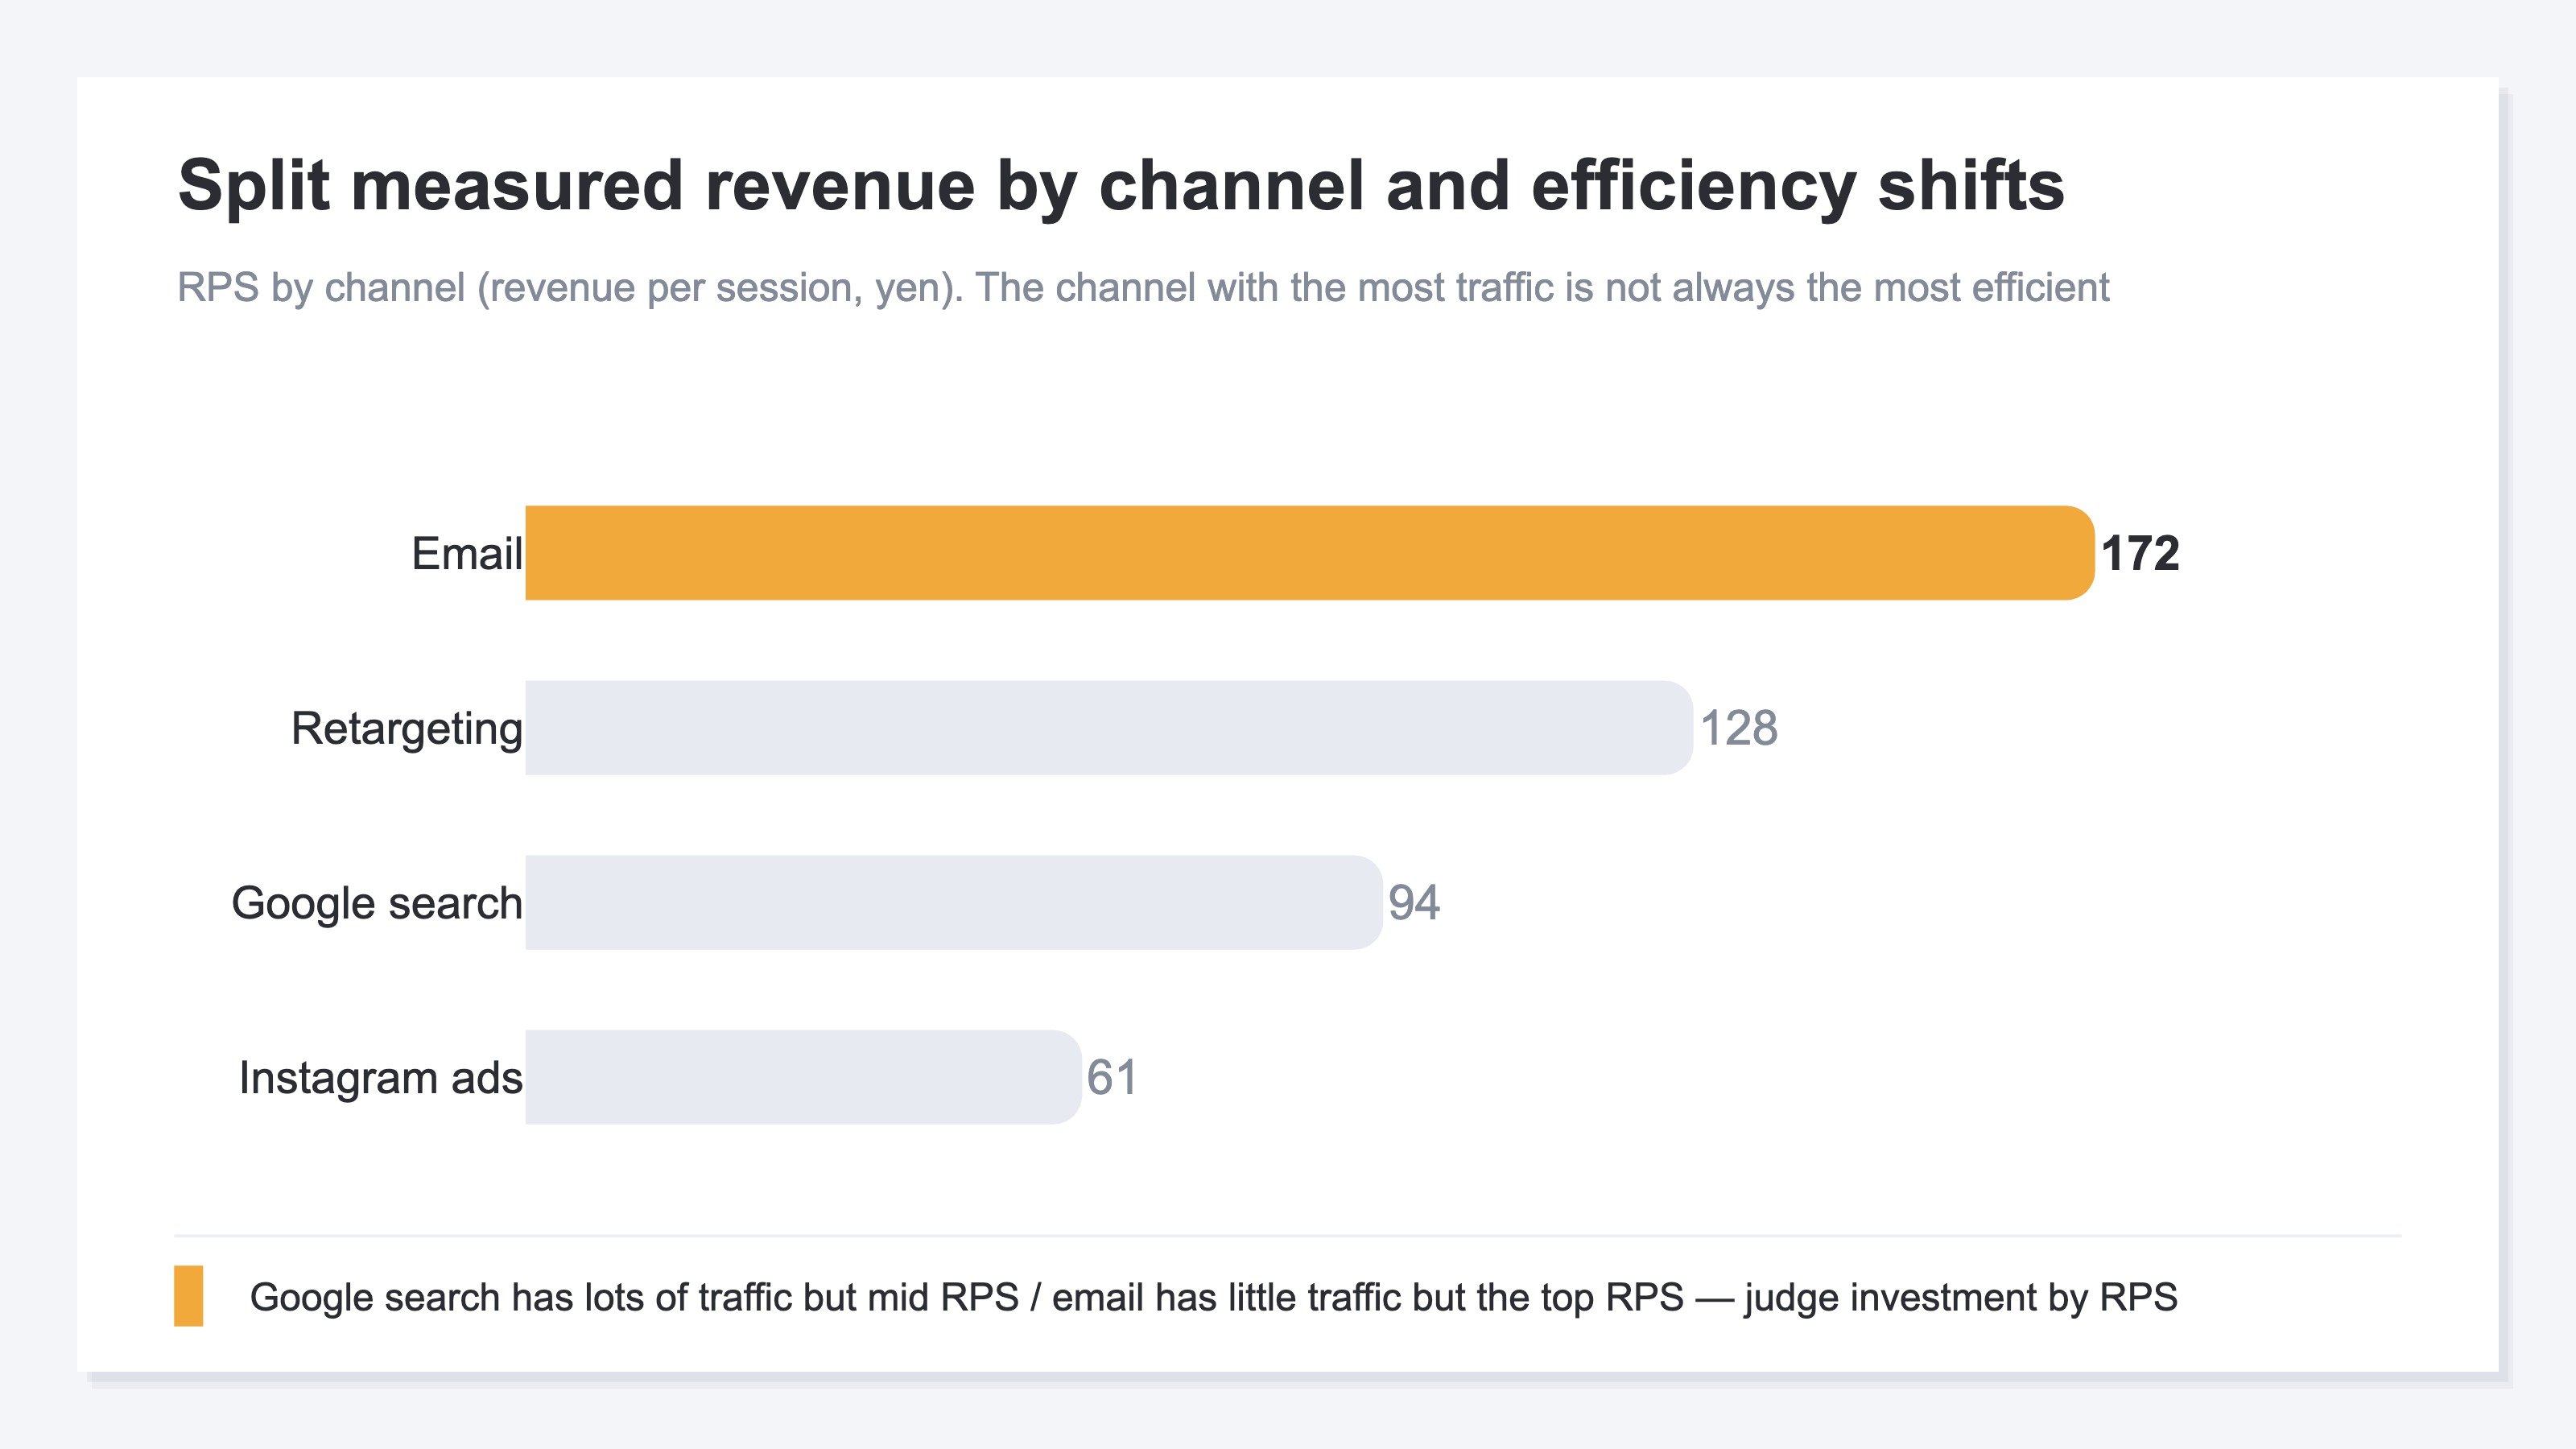
Google search, with the most traffic, is not necessarily the most efficient. Even with less traffic, email can produce more revenue per session. The size of the traffic and the efficiency of the revenue are two different things. Only once you can tell them apart can you steer a limited budget to the channel that pays off most.
But this "line up revenue efficiency by channel and compare" view is heavy work, simple as it sounds. Cart and GA4 standard reports show session and purchase counts, yet carry no standard screen that lines up channel-level RPS and AOV side by side. On top of that, bots (automated traffic) creep in, and revenue-less visits vary by channel. Doing this every month, for every channel, by hand, is a lot of repetition.
We do not chase the purchase-event setup itself (the specific GTM steps) here. You will find the implementation in the GA4 custom event setup guide and the 30-minute GA4 e-commerce checklist. This article focuses on "after you can measure, how to turn those numbers into an investment call." For how far you can see channel revenue after measuring, comparing channel analytics across four Japanese carts is also worth a look.
RevenueScope's solution
Bottom line: what remains after you set up the measurement entry is to compare revenue efficiency by channel, with bots removed, on one screen. That view is absent from cart and GA4 defaults — and it is the gap RevenueScope fills.
Even after you choose a cart and add measurement, you always hit the next wall: you cannot see, at a glance, which channel is selling efficiently.
RevenueScope is a lightweight, revenue-focused dashboard that rides on the dataLayer you set up by adding a single tag. You do not rebuild your cart. Using the purchase data you already send, it lines up Revenue, AOV (average order value), RPS (revenue per session), and CVR (purchase rate) by channel. Because they line up on bot-excluded clean numbers, the reversal above shows up directly.
What reaches your AI or screen is numbers organized like this (demo data shown).
| Channel | Revenue | RPS (per session) | Purchase rate |
|---|---|---|---|
| 280k yen | 172 yen | 5.4% | |
| Google search | 960k yen | 94 yen | 3.2% |
| Instagram ads | 640k yen | 61 yen | 2.1% |
In this table, the largest absolute revenue belongs to Google search. Yet by revenue per session (RPS), email comes out on top. Instagram ads have decent revenue but the lowest efficiency. The reversal — "most traffic does not mean most profit" — is visible at a glance. We explain reading channel revenue efficiency in What is RPS? The metric for comparing ad channels. If your GA4 revenue feels off, why GA4 revenue does not match Shopify helps you sort out the premise of the gap.
That said, there are boundaries to what it does. RevenueScope outputs five numbers — Revenue, AOV, RPS, purchase rate, and sessions — and their breakdowns. Inventory turnover, lifetime value (LTV), and gross margin are out of scope; those belong to accounting and CRM tools. What RevenueScope covers is narrow: telling apart "apparent strength" by revenue efficiency per channel and per new/returning visitor. It is not a replacement for GA4 either. Detailed behavior analysis belongs in GA4; the day-to-day revenue-by-channel call belongs in RevenueScope — they complement each other.
5. FAQ#
Q. If my cart supports dataLayer, is measurement enough?
It matters as an entry, but it is not enough. dataLayer support means you can send purchase events. Splitting those numbers into revenue efficiency by channel and deciding where to invest is a separate task. Treat support yes/no as only the entry to the map.
Q. With a free cart like EC-CUBE, can I analyze anything?
You get the freedom to capture raw events in any shape. But that only means you can gather the raw material. It does not mean a screen comparing channel-level RPS and AOV side by side is prepared automatically. High freedom and easy revenue judgment are different things.
Q. Do I have to switch carts to see revenue efficiency?
No. If your current cart can measure purchases, you can see it by riding on those numbers. RevenueScope adds a single tag and layers channel-level revenue efficiency on top of your existing measurement. There is no need to rebuild your cart.
Conclusion#
When comparing carts, it is easy to end the conversation at "does it support dataLayer or GTM." Whether you can send purchases is, indeed, an important entry. Across five main carts, support and setup effort vary: easier carts give less freedom, while freer carts are heavier to build.
But support is only the entry. Even "freely analyze" gives you raw events, not revenue efficiency by channel automatically. The real difference shows after you can measure. Split the same revenue by channel and the efficiency reverses — the channel with the most traffic is not always the most profitable.
And this "line up revenue efficiency by channel and compare" view is structurally absent from cart and GA4 defaults. So choosing a cart does not end the story. The work of turning the numbers you captured into an investment call remains. Only once you do that does your limited budget flow to the channel that pays off most.
See which ads actually drive revenue, at a glance
Free up to 5,000 sessions/month, AI analyst included. No credit card required. Up and running in 5 minutes.
References#
- [1] Google Tag Manager Help, "Data layer" (2026, last accessed) (support.google.com)
- [2] Google Analytics Help, "[GA4] Measure ecommerce events" (2026, last accessed) (support.google.com)
- [3] Shopify Developer Documentation, "About web pixels" (2026, last accessed) (shopify.dev)
- [4] BASE FAQ, "Setting up access analytics and tracking tags" (2026, last accessed) (help.thebase.in)
- [5] Color Me Shop Manual, "Access analytics" (2026, last accessed) (shop-pro.jp)