
Your ad dashboard says ROAS 3x. Your own revenue math says 2x. And at the company level, sales aren't growing in line with ad spend at all. Same word — "ROAS" — yet the numbers disagree, and you're left wondering which one to trust when moving budget. The truth is that three different numbers all get called ROAS, and they differ in both scope and reliability. This guide covers the three types, which decision each serves, and how to read the gaps when they disagree.
Table of Contents
TL;DR#
-
There are three kinds of ROAS
- (1) Platform ROAS (the ad platform's self-report)
- (2) Channel-level ROAS measured from your own revenue
- (3) Overall ROAS (MER = total revenue ÷ total ad spend)
-
Different decisions need different numbers
Daily bid tuning uses (1), deciding where budget goes uses (2), checking business health uses (3)
-
The three numbers normally disagree
(1) runs high because platforms double-count the same sale. (3) can look healthy while a losing channel hides inside
-
Mixing them up leads to bad budget calls
Allocate on (1) and you fund inflated numbers; watch only (3) and you miss individual bleeders
1. Three different numbers are all called ROAS#
Bottom line: the same "ROAS" splits into three types depending on who measures it and at what scope — each with different reliability and a different job.
ROAS (return on ad spend) is a simple formula — revenue ÷ ad spend — but which revenue, counted by whom, changes everything.
(1) Platform ROAS (the platform's self-report). The number shown in your Google Ads or Meta Ads dashboard. Each platform calculates it from the sales it judges its own ads contributed to. The problem: several platforms each count the same single purchase as their own win. If someone searched on Google, saw a Meta ad too, and bought, that sale lands in both dashboards. Sum the platform ROAS figures and you get a number bigger than reality. We unpack this mechanism in Summing Platform ROAS Overstates It: Use MER to See True Ad Efficiency.
(2) Channel-level measured ROAS (from your own revenue). Not the platform's claim — revenue actually measured on your own site, assigned to channels by where the buyer last came from, divided by each channel's ad spend. No double-counting, and channels can be compared on one yardstick. It takes work to build, but for "where does the budget go," this is the number that matters.
(3) Overall ROAS (MER). Total revenue divided by total ad spend — the broadest, bluntest figure, known as MER (marketing efficiency ratio). It shows no channel detail, but it's the least affected by tracking gaps and double-counting, and it answers one question well: "as a whole business, are the ads paying off?"
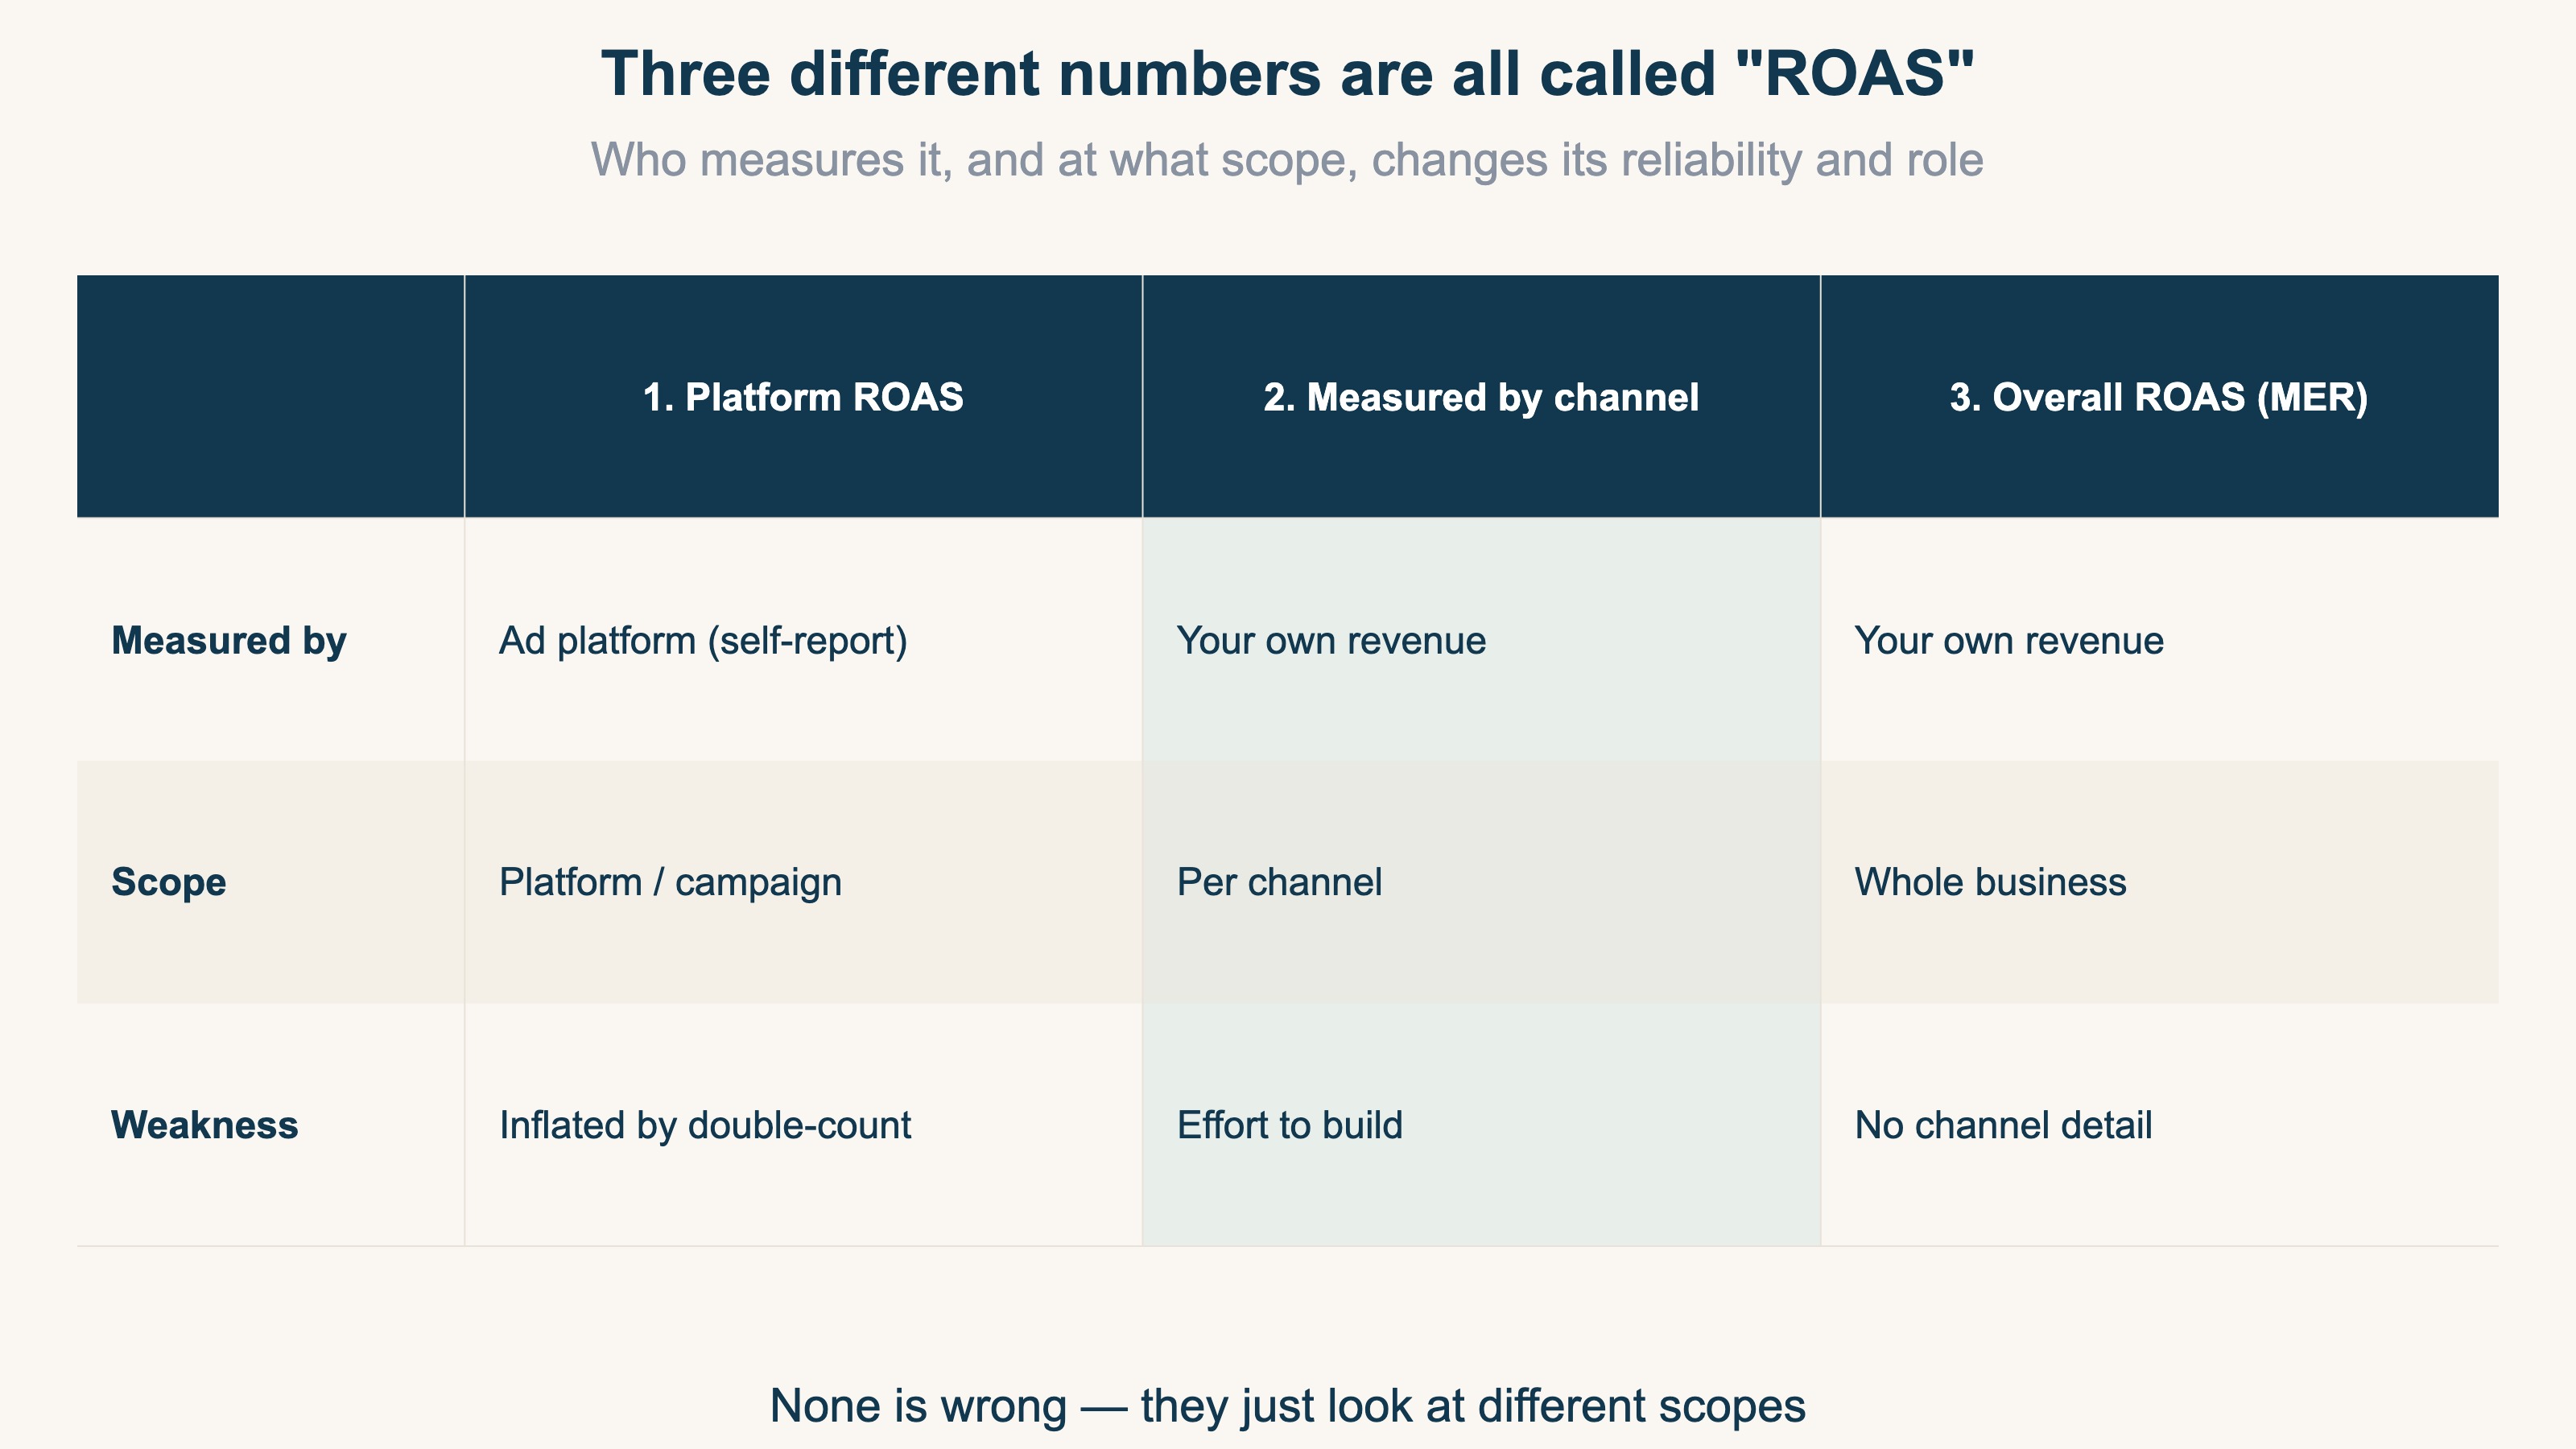
The key point: none of the three is "the correct one." They look at different scopes. Broader and shallower means more trustworthy but cruder; narrower and deeper means more detailed but more easily inflated. Mix them without knowing this, and — as the next section shows — your decisions go wrong.
2. Match the number to the decision#
Bottom line: daily bid tuning uses (1), budget placement uses (2), business health uses (3) — pick the number by the decision at hand.
The axis for choosing is "what am I deciding right now?"
Daily bids and creative tuning → (1) platform ROAS. Comparing campaign A and B inside the same platform? The dashboard number is fine. As long as the inflation is consistent, it works as a relative comparison. The rule is simple: never use it across platforms. Google and Meta count sales by different rules, so comparing their dashboard numbers head-to-head is never a fair fight.
Where the budget goes → (2) channel-level measured ROAS. When deciding "which channel gets the next ¥10,000" across platforms, use (2), built on your own revenue. Decide on (1) and budget drifts toward whichever channel inflates hardest. For the concrete mechanics of allocating across channels, see Single-Product Ad Budget: How a One-SKU Store Allocates by Channel Profit.
Is the business healthy → (3) overall ROAS (MER). The monthly check — "we raised ad spend; did company-wide revenue actually grow?" — belongs to (3). Whatever (1) and (2) are doing, whether cash actually remains only ever shows up in (3).
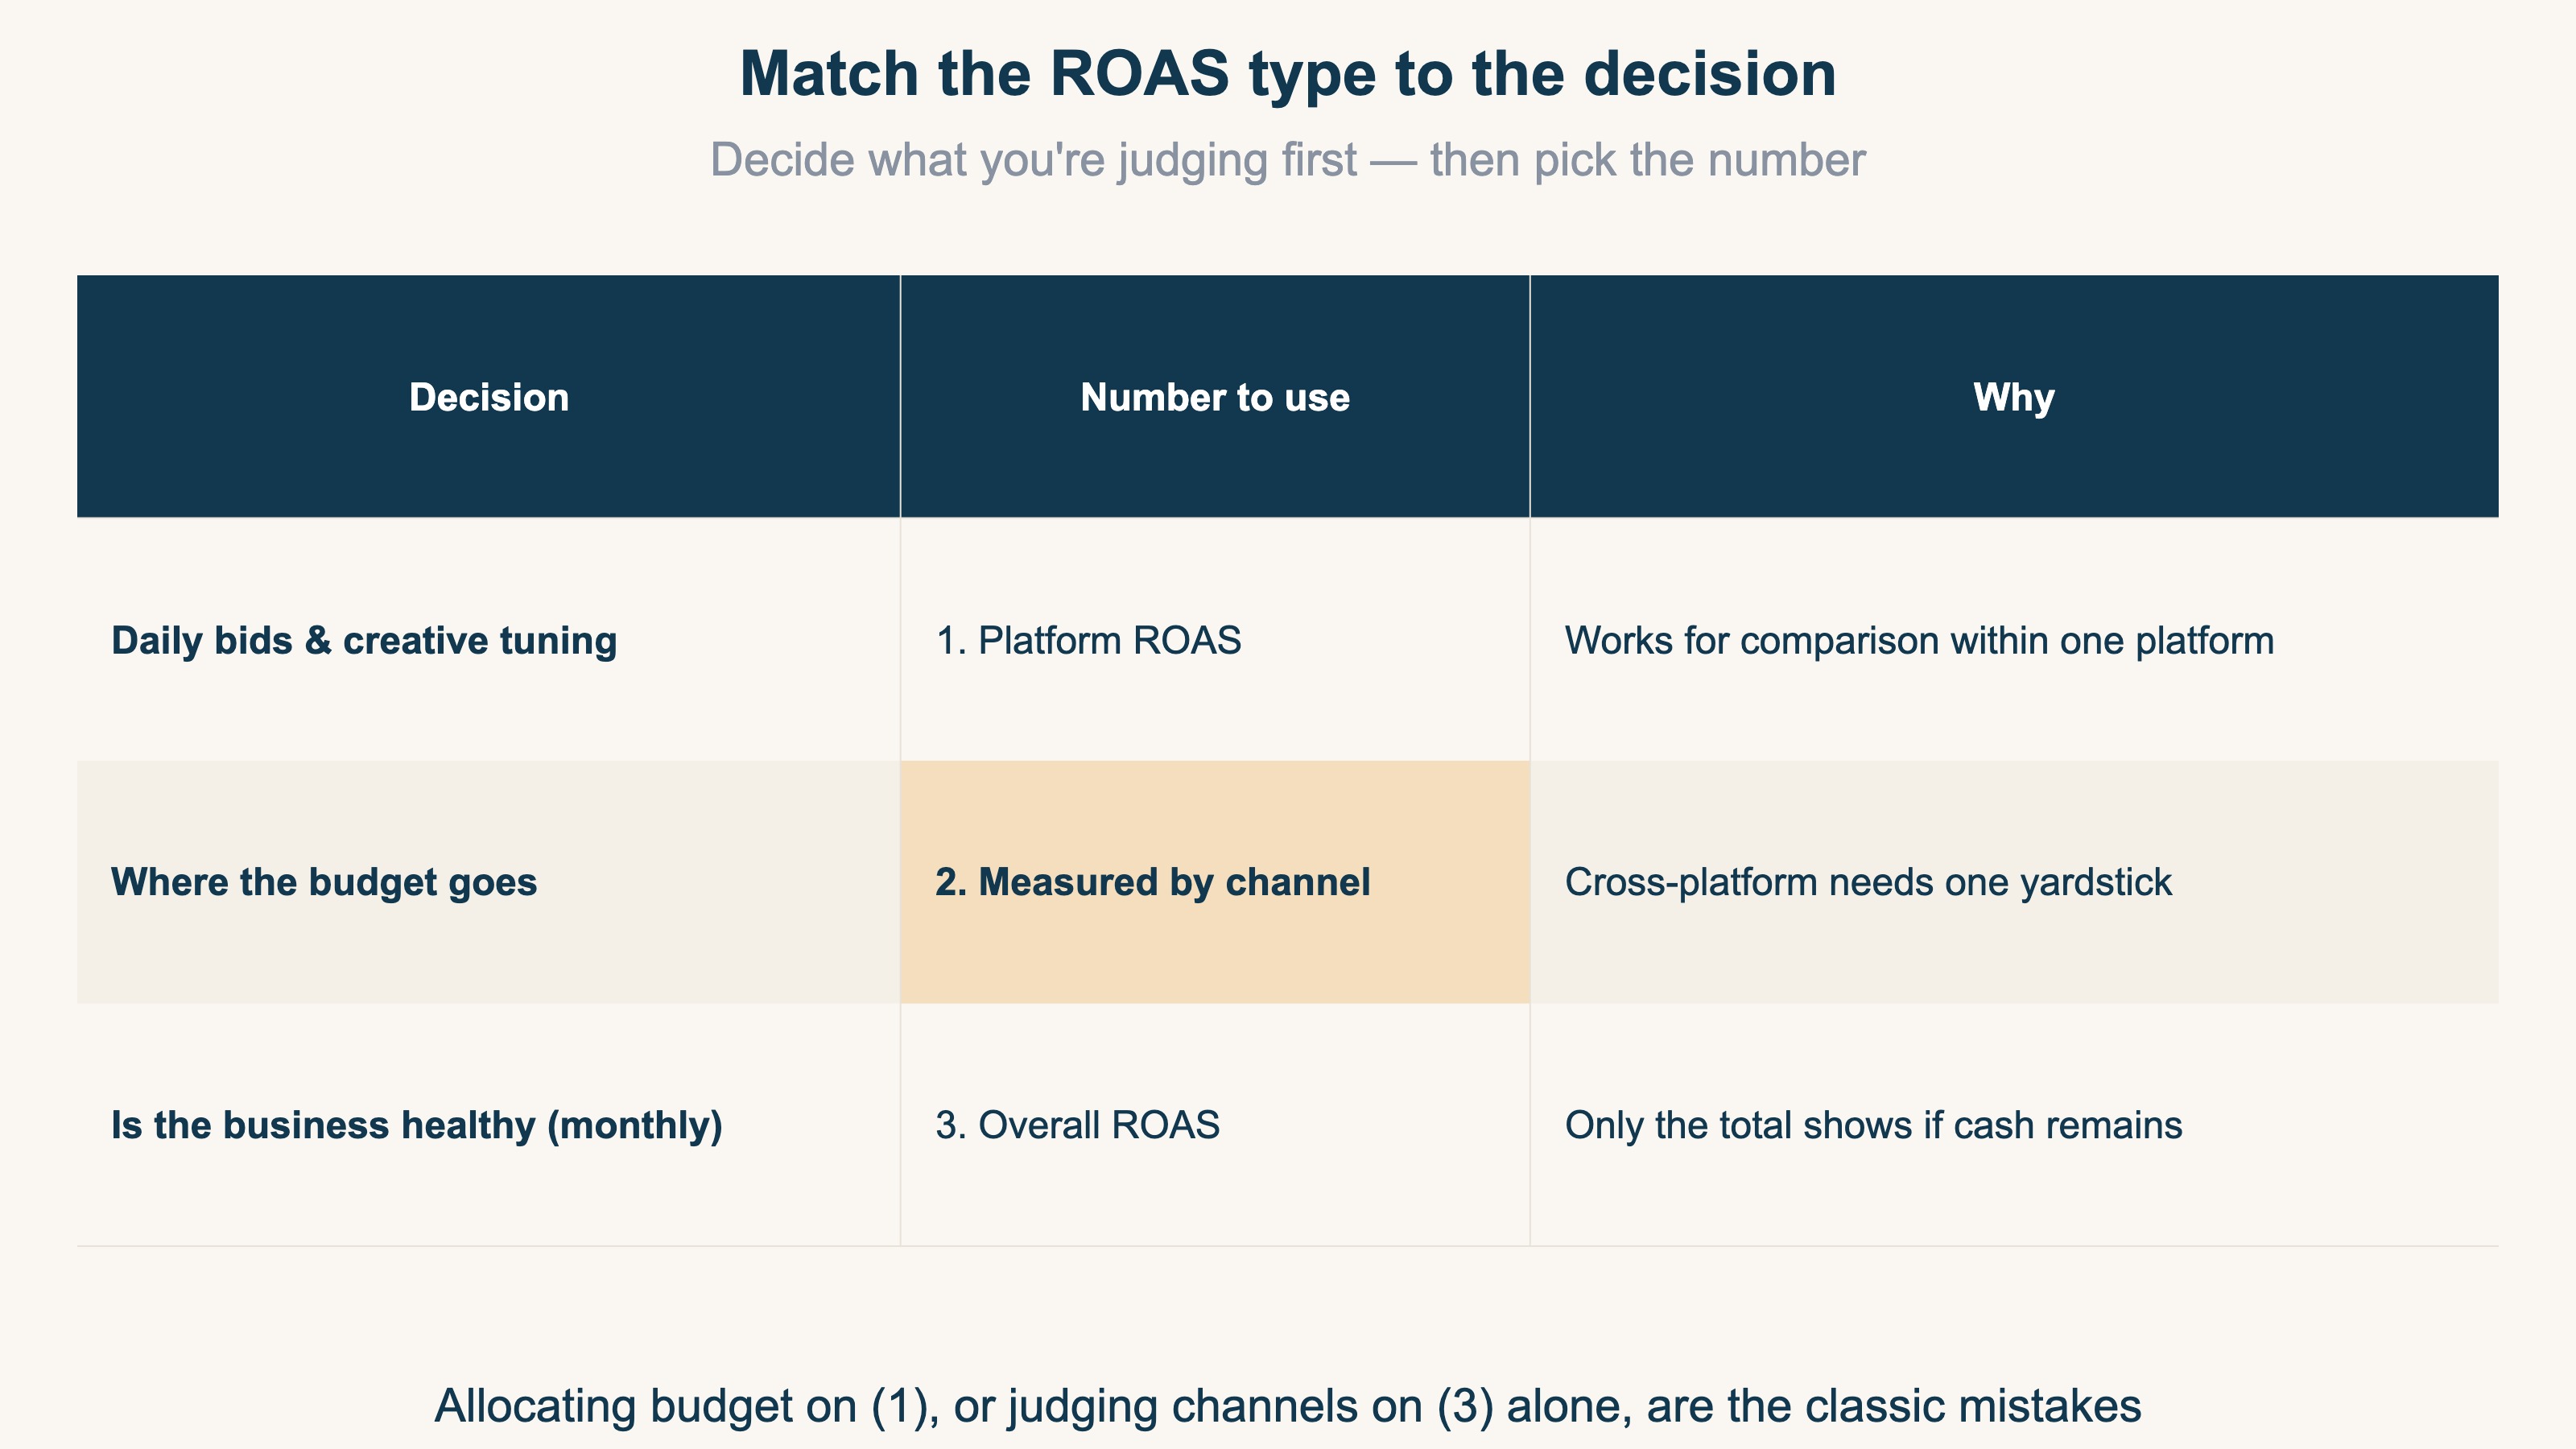
Put the other way: allocating budget on (1), or judging individual channels on (3) alone, are the classic failures. When the decision and the number don't match, ROAS becomes a precise number that answers the wrong question.
3. Reading the gaps when numbers disagree#
Bottom line: a gap is not an error — it's a signal. Which numbers disagree tells you where to look.
The three numbers normally disagree. What matters is reading the cause from the shape of the gap.
(1) is bigger than (2) — the dashboard is inflated. The most common pattern. Double-counting plus platform-friendly attribution can push (1) 20-30% above (2). The wider the gap on a channel, the more likely it "looks great in the dashboard but contributes less in reality." Retargeting ads (which chase people who already visited) tend to claim buyers who would have returned anyway, so this gap opens widest there.
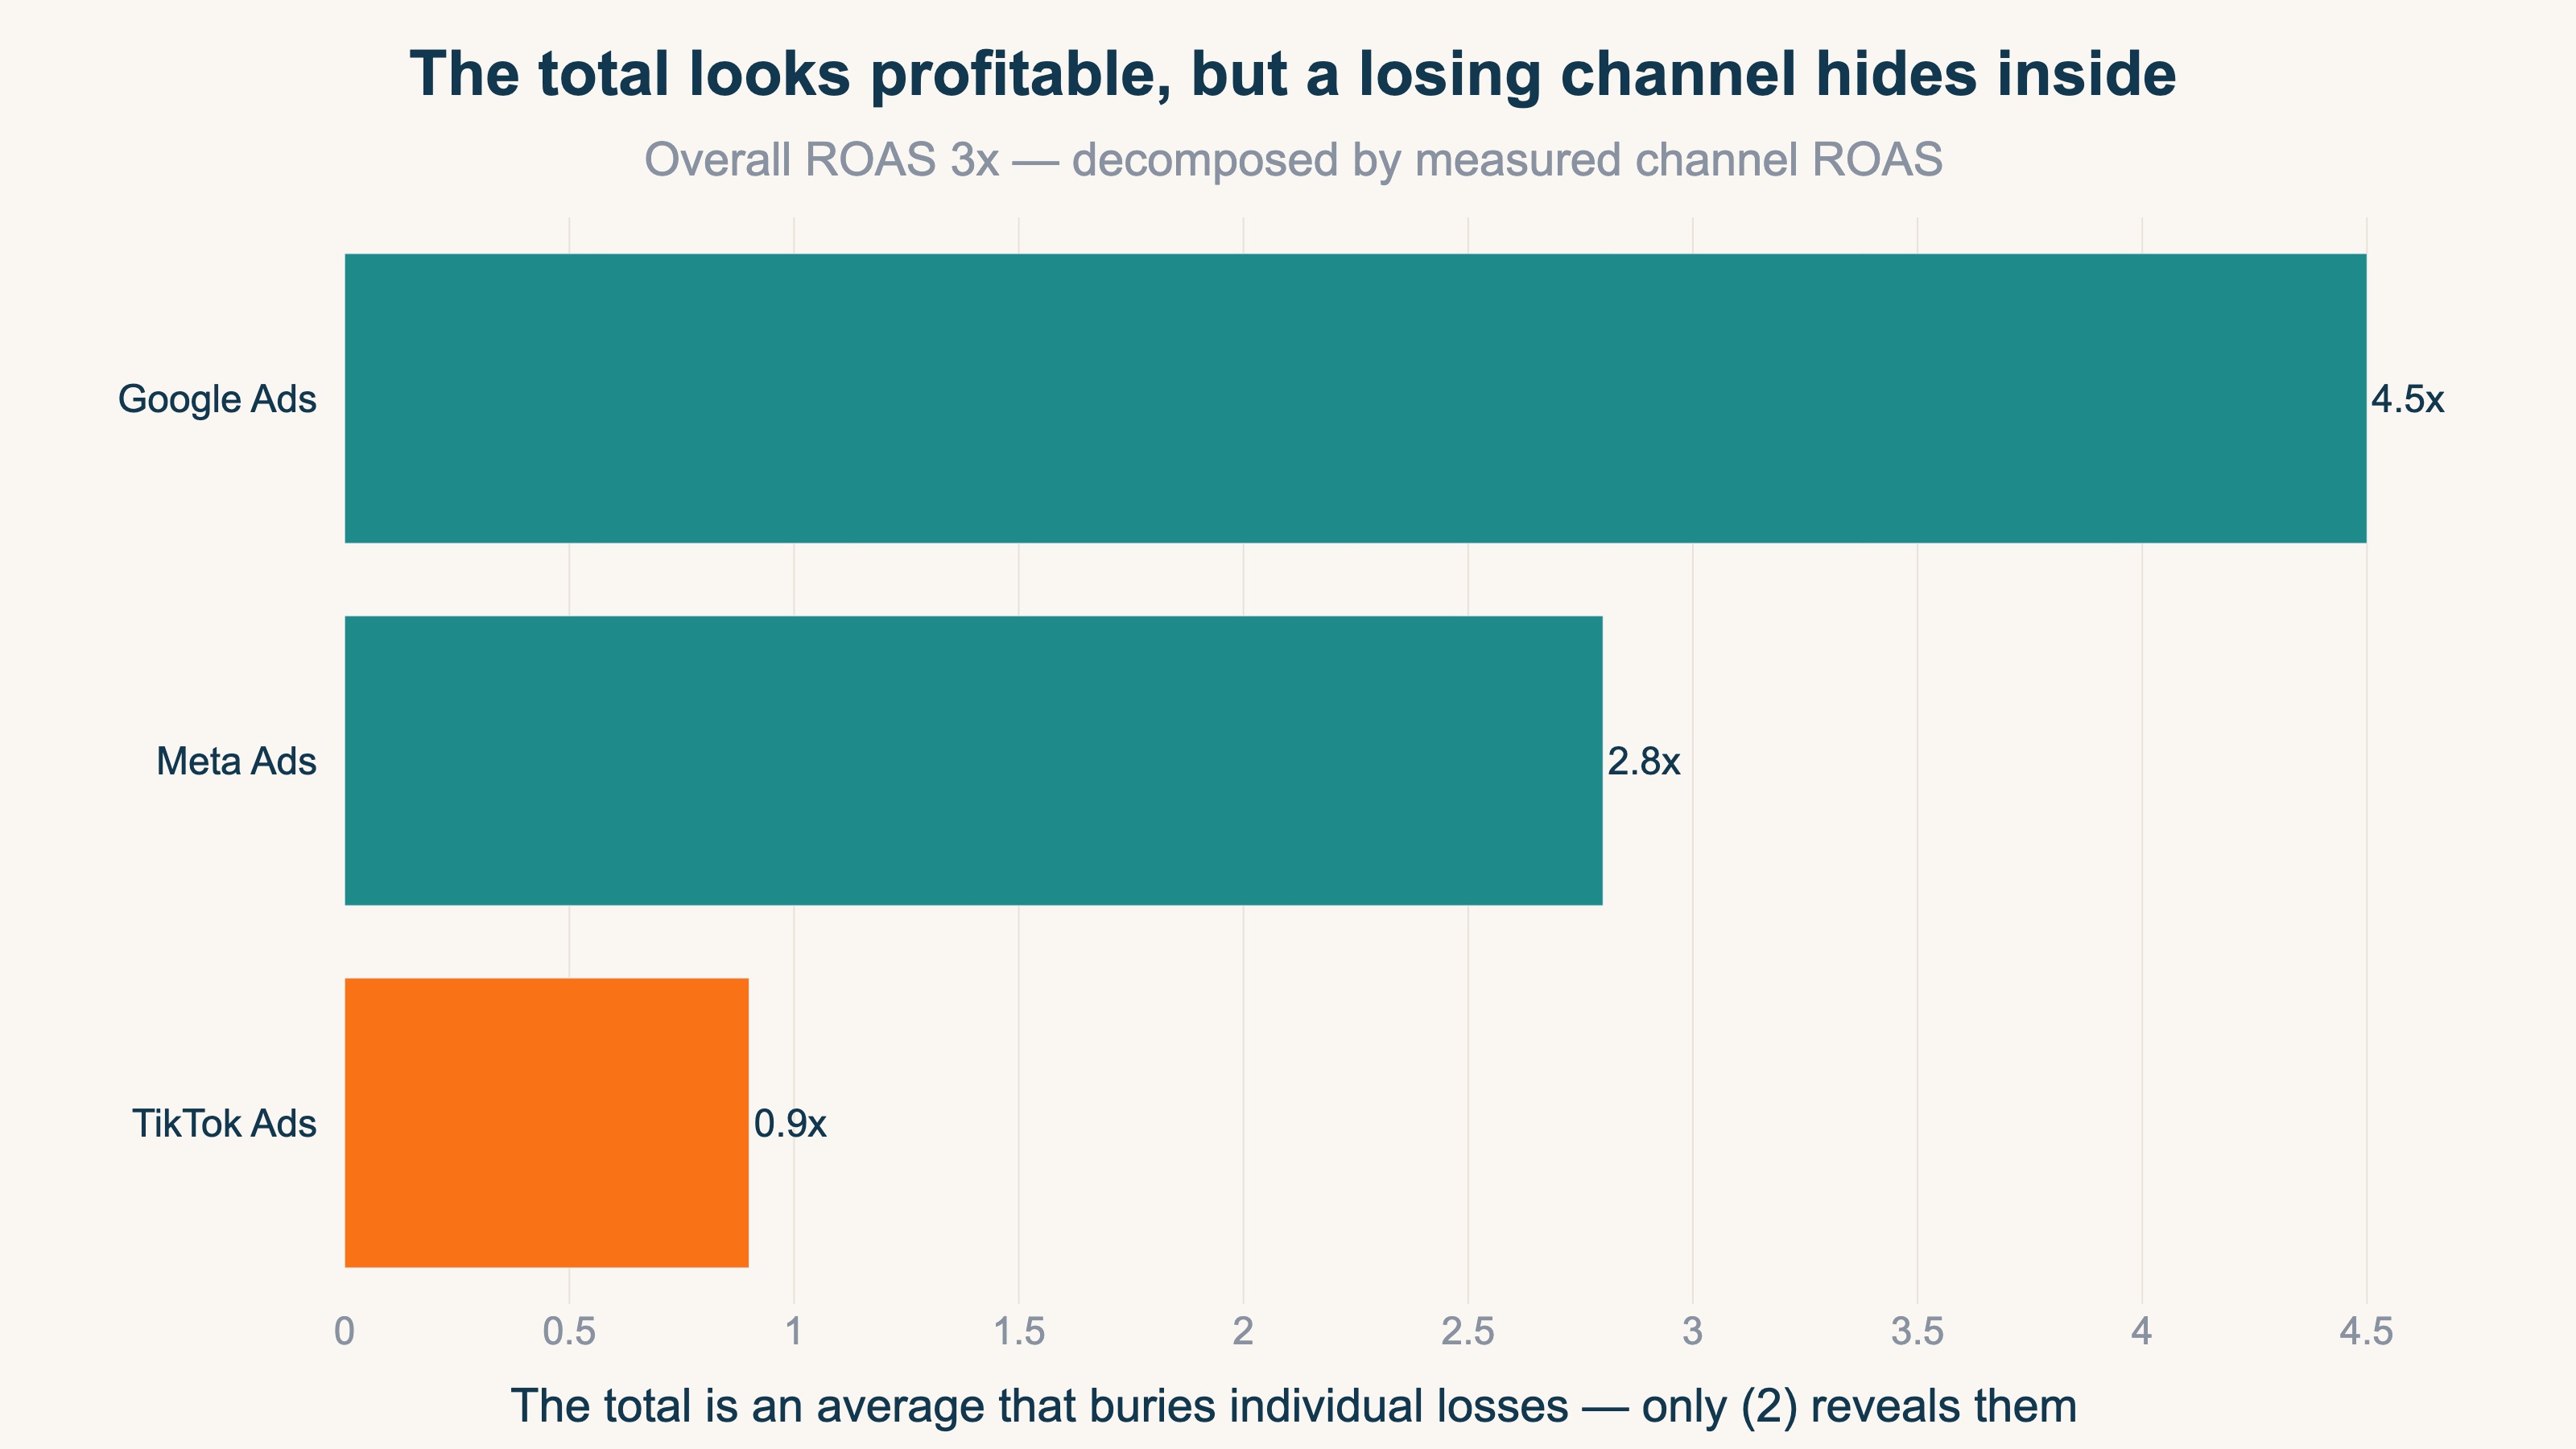
(3) looks healthy, but (2) reveals a hidden loser. Overall ROAS of 3x feels safe — until you split by channel and find "Google 4.5x, Meta 2.8x, TikTok 0.9x": a loss-making channel buried under the profitable ones. (3) is an average, and averages hide bleeding. The reverse happens too: every platform's (1) looks profitable, yet (3) shows total revenue isn't keeping up with total spend — the classic sign that the platform numbers are inflated in aggregate.
The working routine: check (3) monthly → if it worsens (or doesn't improve as spend grows), decompose with (2) by channel → once the culprit channel is found, tune inside that platform with (1). Broad-and-shallow down to narrow-and-deep, in that order. You stay clear of inflated numbers and reach the bleeding point fastest.
One caveat: even a profitable channel found via (2) may be done growing. Whether added spend still pays is covered in When more ads stop paying: spotting ad saturation in ecommerce.
RevenueScope solution
Even once you want to use all three, reality gets in the way. (1) is right there in the dashboard, but building (2) yourself means assigning your own revenue to channels and reconciling it with each platform's ad spend — and that's where most stores stall. (3) isn't free either: manually consolidating ad spend across platforms every month is tedious work.
RevenueScope connects to your ad accounts (Google, Meta, TikTok, and so on), pulls each platform's spend, and reconciles it with your own revenue tracking (deduplicated, aligned by where the buyer last came from). In other words, it automates (2) — the hardest one to build. And since it also measures your total revenue, (3) can be computed from the same screen — two yardsticks that don't depend on the platforms' self-reports.
Ask RevenueScope "show me the real ROAS by channel," and it returns something like this (demo data):
| Channel | Ad spend | Measured revenue | Measured ROAS | Saturation |
|---|---|---|---|---|
| ¥117,000 | ¥244,100 | 2.09x | 45% | |
| Meta | ¥47,200 | ¥153,600 | 3.25x | 78% |
| TikTok | ¥44,500 | ¥40,000 | 0.90x (losing) | 22% |
| Paid channels total | ¥208,700 | ¥437,700 | 2.10x | – |
The bottom row is the three paid channels combined ((3), the true overall ROAS, adds non-ad revenue such as organic search on top — RS measures total revenue too, so it can produce (3) as well). The shape matches section 3: the total reads 2.10x and looks fine, but the channel split reveals TikTok losing money at 0.90x. RevenueScope also attaches each channel's saturation (how much efficiency drops with one more yen of spend, 0-100% — closer to 100 means harder to grow), so the next move — "pause the losing TikTok, shift toward low-saturation Google" — comes with numbers attached.
Stop delegating budget calls to the dashboards' self-reports ((1)); get the measured channel view ((2)) and the overall view ((3)) assembled automatically. That's what turns the three kinds of ROAS from something you know into something you actually use.
FAQ#
Frequently asked questions#
Q. So should I ignore platform ROAS?
A. No — it has a job. For day-to-day tuning of campaigns and creatives inside one platform, the dashboard ROAS is the fastest tool available. What it must not do is settle cross-platform comparisons or budget allocation: each platform counts sales by its own rules, so those comparisons are never fair.
Q. What's a healthy MER (overall ROAS)?
A. There's no universal target — it depends on margins and business stage. A more useful habit than chasing a benchmark: record your own MER monthly and watch how it moves in months when ad spend rose. For industry-level ROAS reference points, see ROAS benchmarks by industry 2026.
Q. Can I build channel-level measured ROAS with GA4 alone?
A. Partially. Combining GA4's per-channel revenue with each platform's spend in a spreadsheet gives you a workable first version. Bear in mind GA4 itself drops some revenue (checkout domain hops and the like), and the monthly manual reconciliation tends not to survive busy seasons. Start with the spreadsheet version; automate when the routine stops holding.
Conclusion#
Three numbers share the name ROAS: (1) platform ROAS (the ad platform's self-report), (2) channel-level ROAS measured from your own revenue, and (3) overall ROAS (MER). Daily bid tuning runs on (1), budget placement on (2), and the monthly health check on (3) — match the number to the decision. The three normally disagree, and the shape of the disagreement is itself the diagnostic: it tells you where to look.
As a first step, compute this month's (3) — total revenue ÷ total ad spend — just once. Put it next to the dashboards' (1), and the size of the gap shows you how much the self-reports are inflated. From there, work down into (2) by channel, and budget decisions become something you make with real numbers.
See which ads actually drive revenue, at a glance
Free up to 5,000 sessions/month, AI analyst included. No credit card required. Up and running in 5 minutes.
References#
- Upstack Data, "A Comprehensive Guide to MER and How It Differs from ROAS"
- EasyInsights, "Marketing Efficiency Ratio vs ROAS: What's the Difference?"