
"Budget went up, so let's add spend to the channel with the best ROAS." You scale it — revenue grows, but profit barely moves. Sound familiar? The usual culprit is saturation. Ads reach the most responsive audience first, so the more you spend, the less each additional yen returns (declining marginal ROAS). This article explains why scaling can erase profit, how to spot the "stop point," and how to decide scale, refresh, or cut for each channel.
Contents
TL;DR#
-
Saturation = how "used up" a channel's budget is. Closer to 100%, the lower the return on each extra yen.
Because the most responsive audience sells first, marginal ROAS drops as you spend more.
-
Average ROAS hides saturation.
Overall ROAS can still look profitable while the last yen you added (marginal) is already in the red.
-
As a rule of thumb, 60%+ means diminishing returns and 80%+ means saturated.
Above 80%, refreshing creative or moving to a new channel beats simply adding budget.
-
Scale the channel with room left, not the one with the best ROAS.
Even a top-ROAS channel offers little upside once it's saturated. Move spend to where there's headroom.
1. Why more ad spend can shrink your profit#
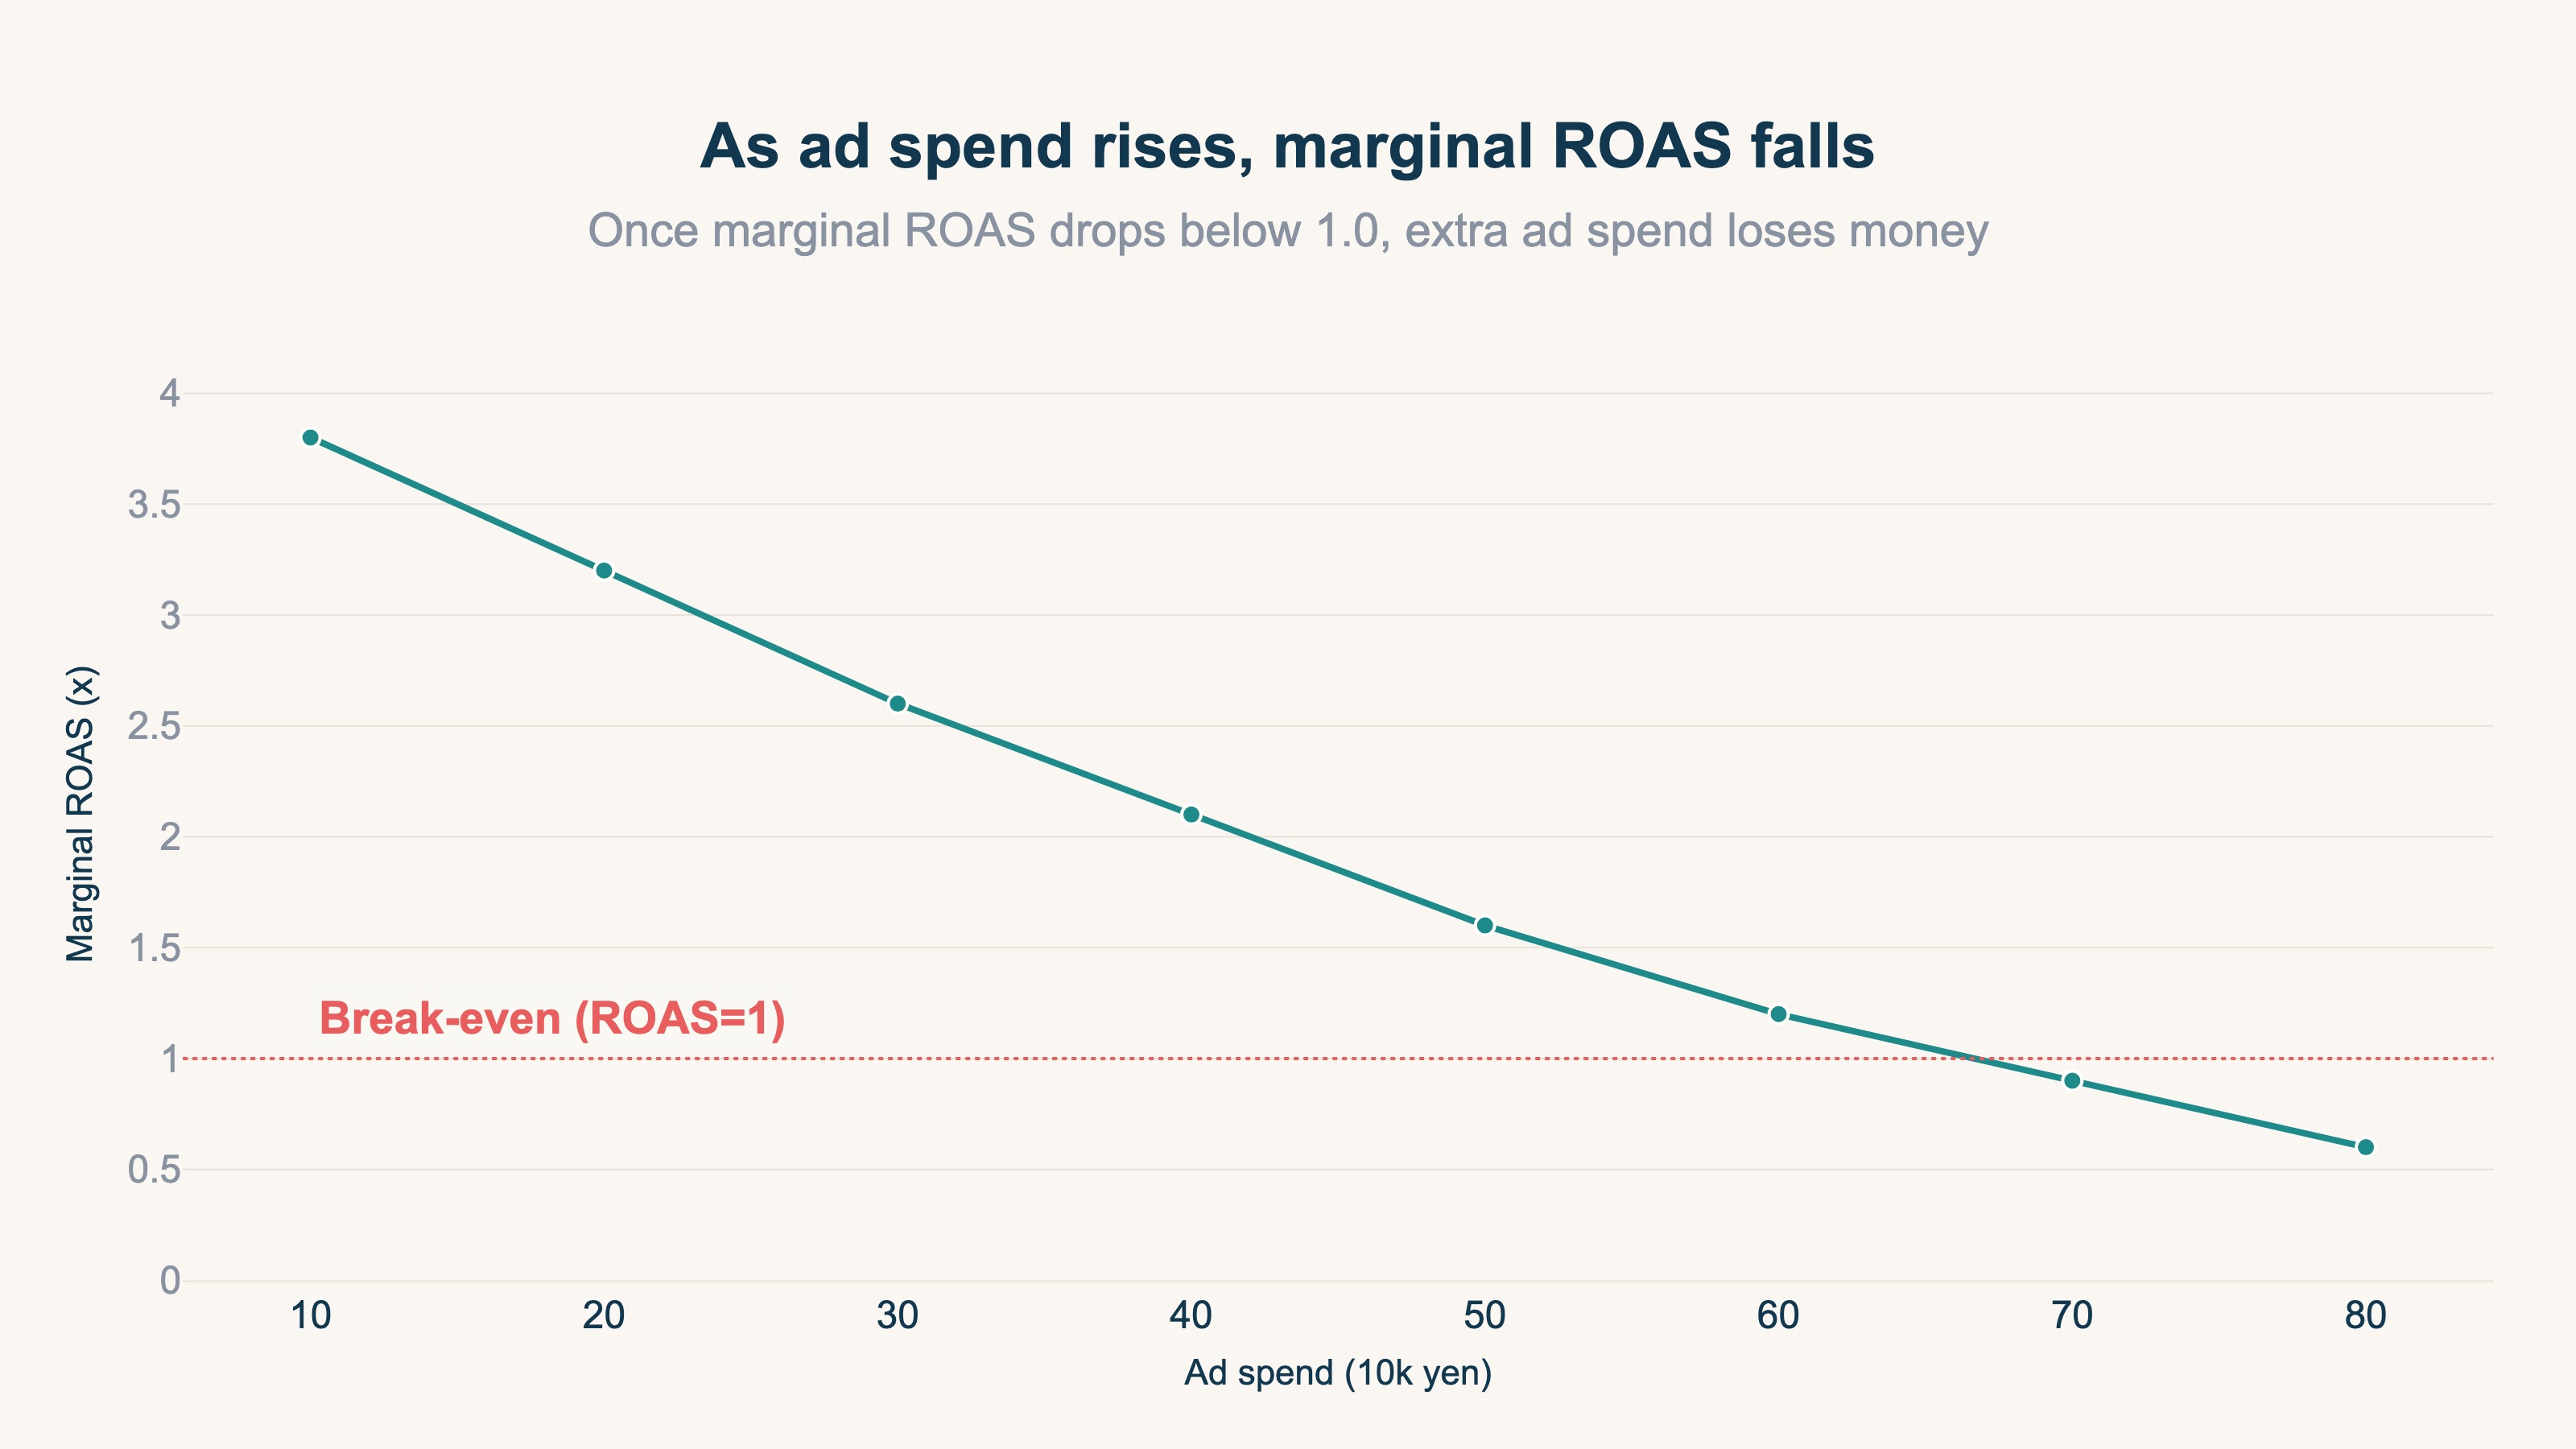
Bottom line: ads sell to the most responsive audience first, so each additional yen gets less efficient as you spend more.
When you run ads, they first reach people who want to buy now or already have interest. This audience converts very efficiently. But as you raise budget and widen delivery, you increasingly reach people who aren't ready to buy yet. For the same product, the audience you reach later is harder to convert.
Because of this "later audiences convert worse" property, every additional yen of ad spend returns less revenue (declining marginal ROAS). The first ¥100k may have a high ROAS, but as you stack the next ¥100k and the one after that, the efficiency of the added portion steadily falls.
This is saturation. It measures how much of a channel's responsive audience you've already used up. Pour more budget into a saturated channel and revenue barely moves while ad cost piles on. The result: revenue grew, but profit didn't.
2. Average ROAS hides saturation#
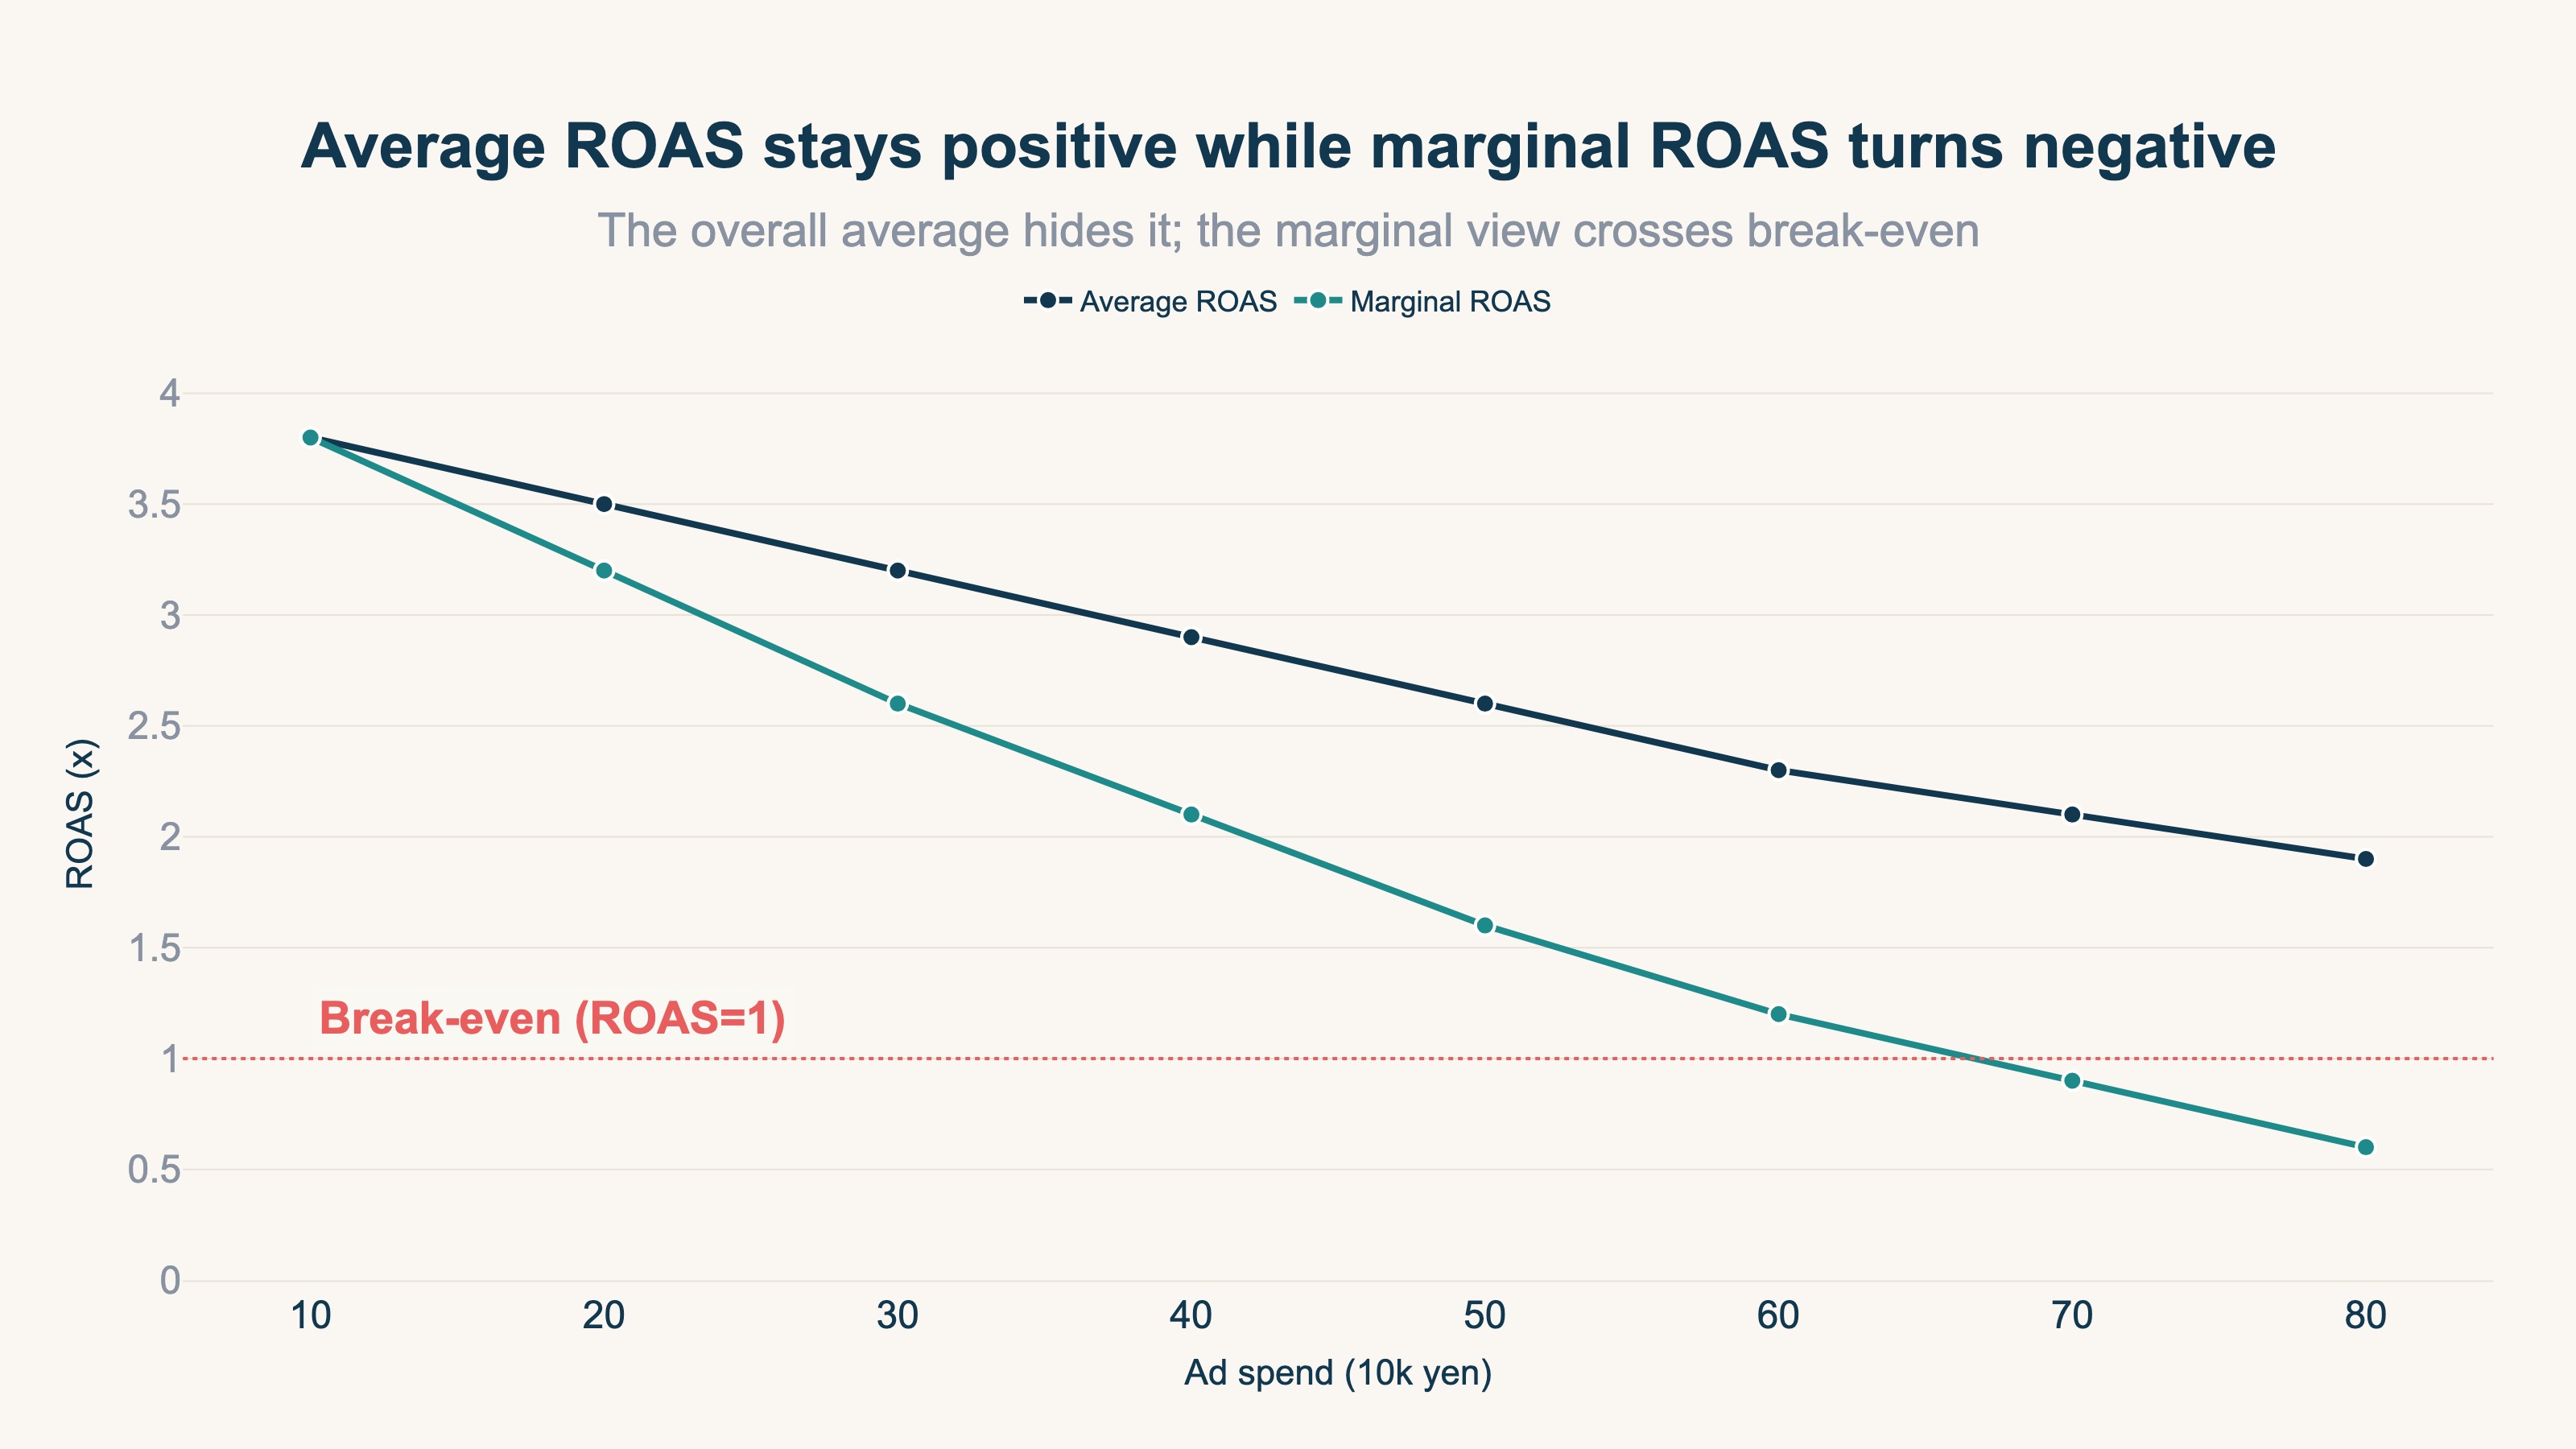
Bottom line: overall ROAS can look profitable while the last yen you added is already losing money.
The ROAS shown in your ad dashboard is revenue against your total spend for the period — an average. But the number you need for decisions is the marginal one: "if I add the next yen, how much comes back?" Even with an average ROAS of 2.7, after scaling up the marginal ROAS on the last portion may have fallen to 0.8. The average gets propped up by the efficient early spend, masking the decline in the later portion.
Judge by the average and you conclude "it's still high, so let's add more" — while the inefficient marginal portion quietly erases profit. How risky it is to set budgets off average ROAS is covered in detail in Average ROAS can't set your ad budget. From here, this article focuses on reading that marginal decline through a single number: saturation.
3. Reading the ceiling with a saturation score#
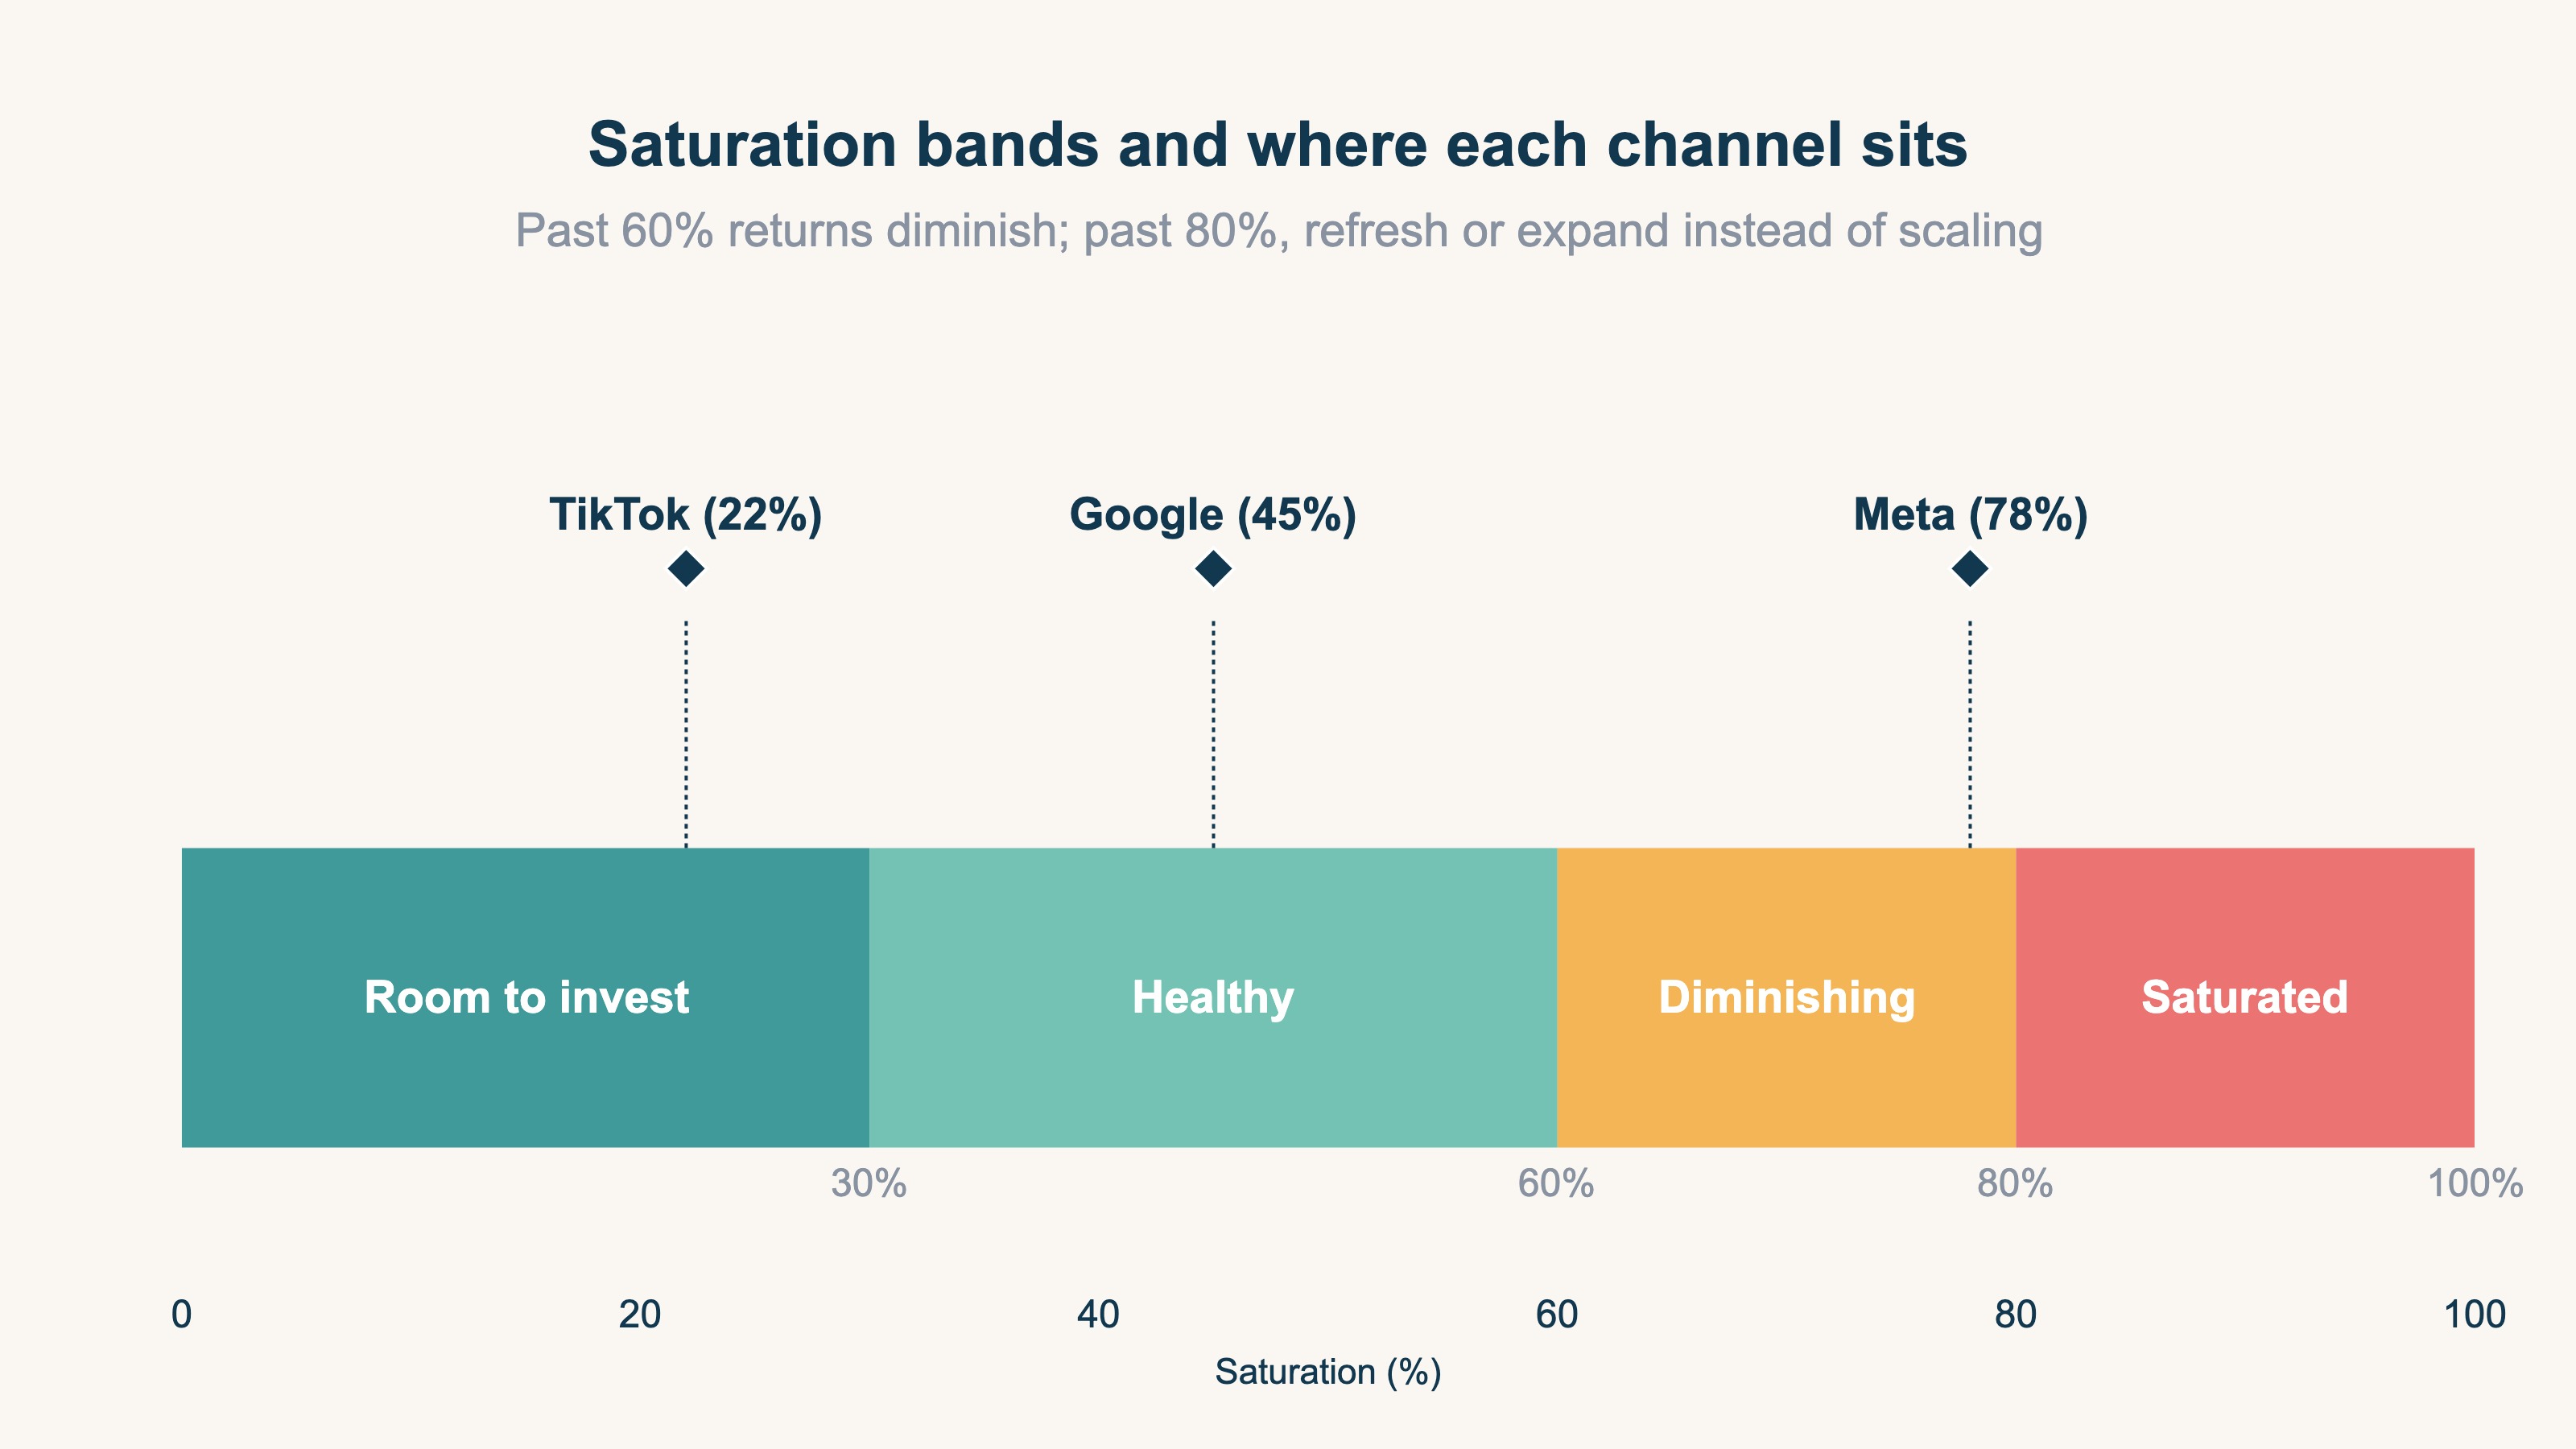
Bottom line: saturation shows how "used up" a channel is on a 0–100% scale. 60%+ means diminishing returns; 80%+ is a saturation signal.
It's hard to tell "am I done, or can I still grow this?" from average ROAS alone. That's where saturation comes in. Saturation expresses how much of a channel's budget headroom you've used, from 0 to 100%. The closer to 100%, the lower the return on each additional yen.
Here's a common rule of thumb for saturation.
| Saturation | State | What to do |
|---|---|---|
| Under 30% | Plenty of room | Adding budget grows results nearly proportionally |
| 30–60% | Healthy | Scale gradually to keep efficiency |
| 60–80% | Diminishing returns begin | Refresh creative and targeting to lift the ceiling |
| 80%+ | Saturated | Adding budget worsens efficiency. Expand to new channels or segments |
The key point: a high saturation score doesn't mean "you can't grow this" — it means "you can't grow it with the current approach." Change the creative, widen the audience, and the responsive pool grows, lifting the ceiling itself. Saturation tells you the stop point if you keep doing the same thing.
4. Deciding scale, refresh, or cut per channel#
Bottom line: the channel to scale is the one with saturation headroom, not the one with the best ROAS.
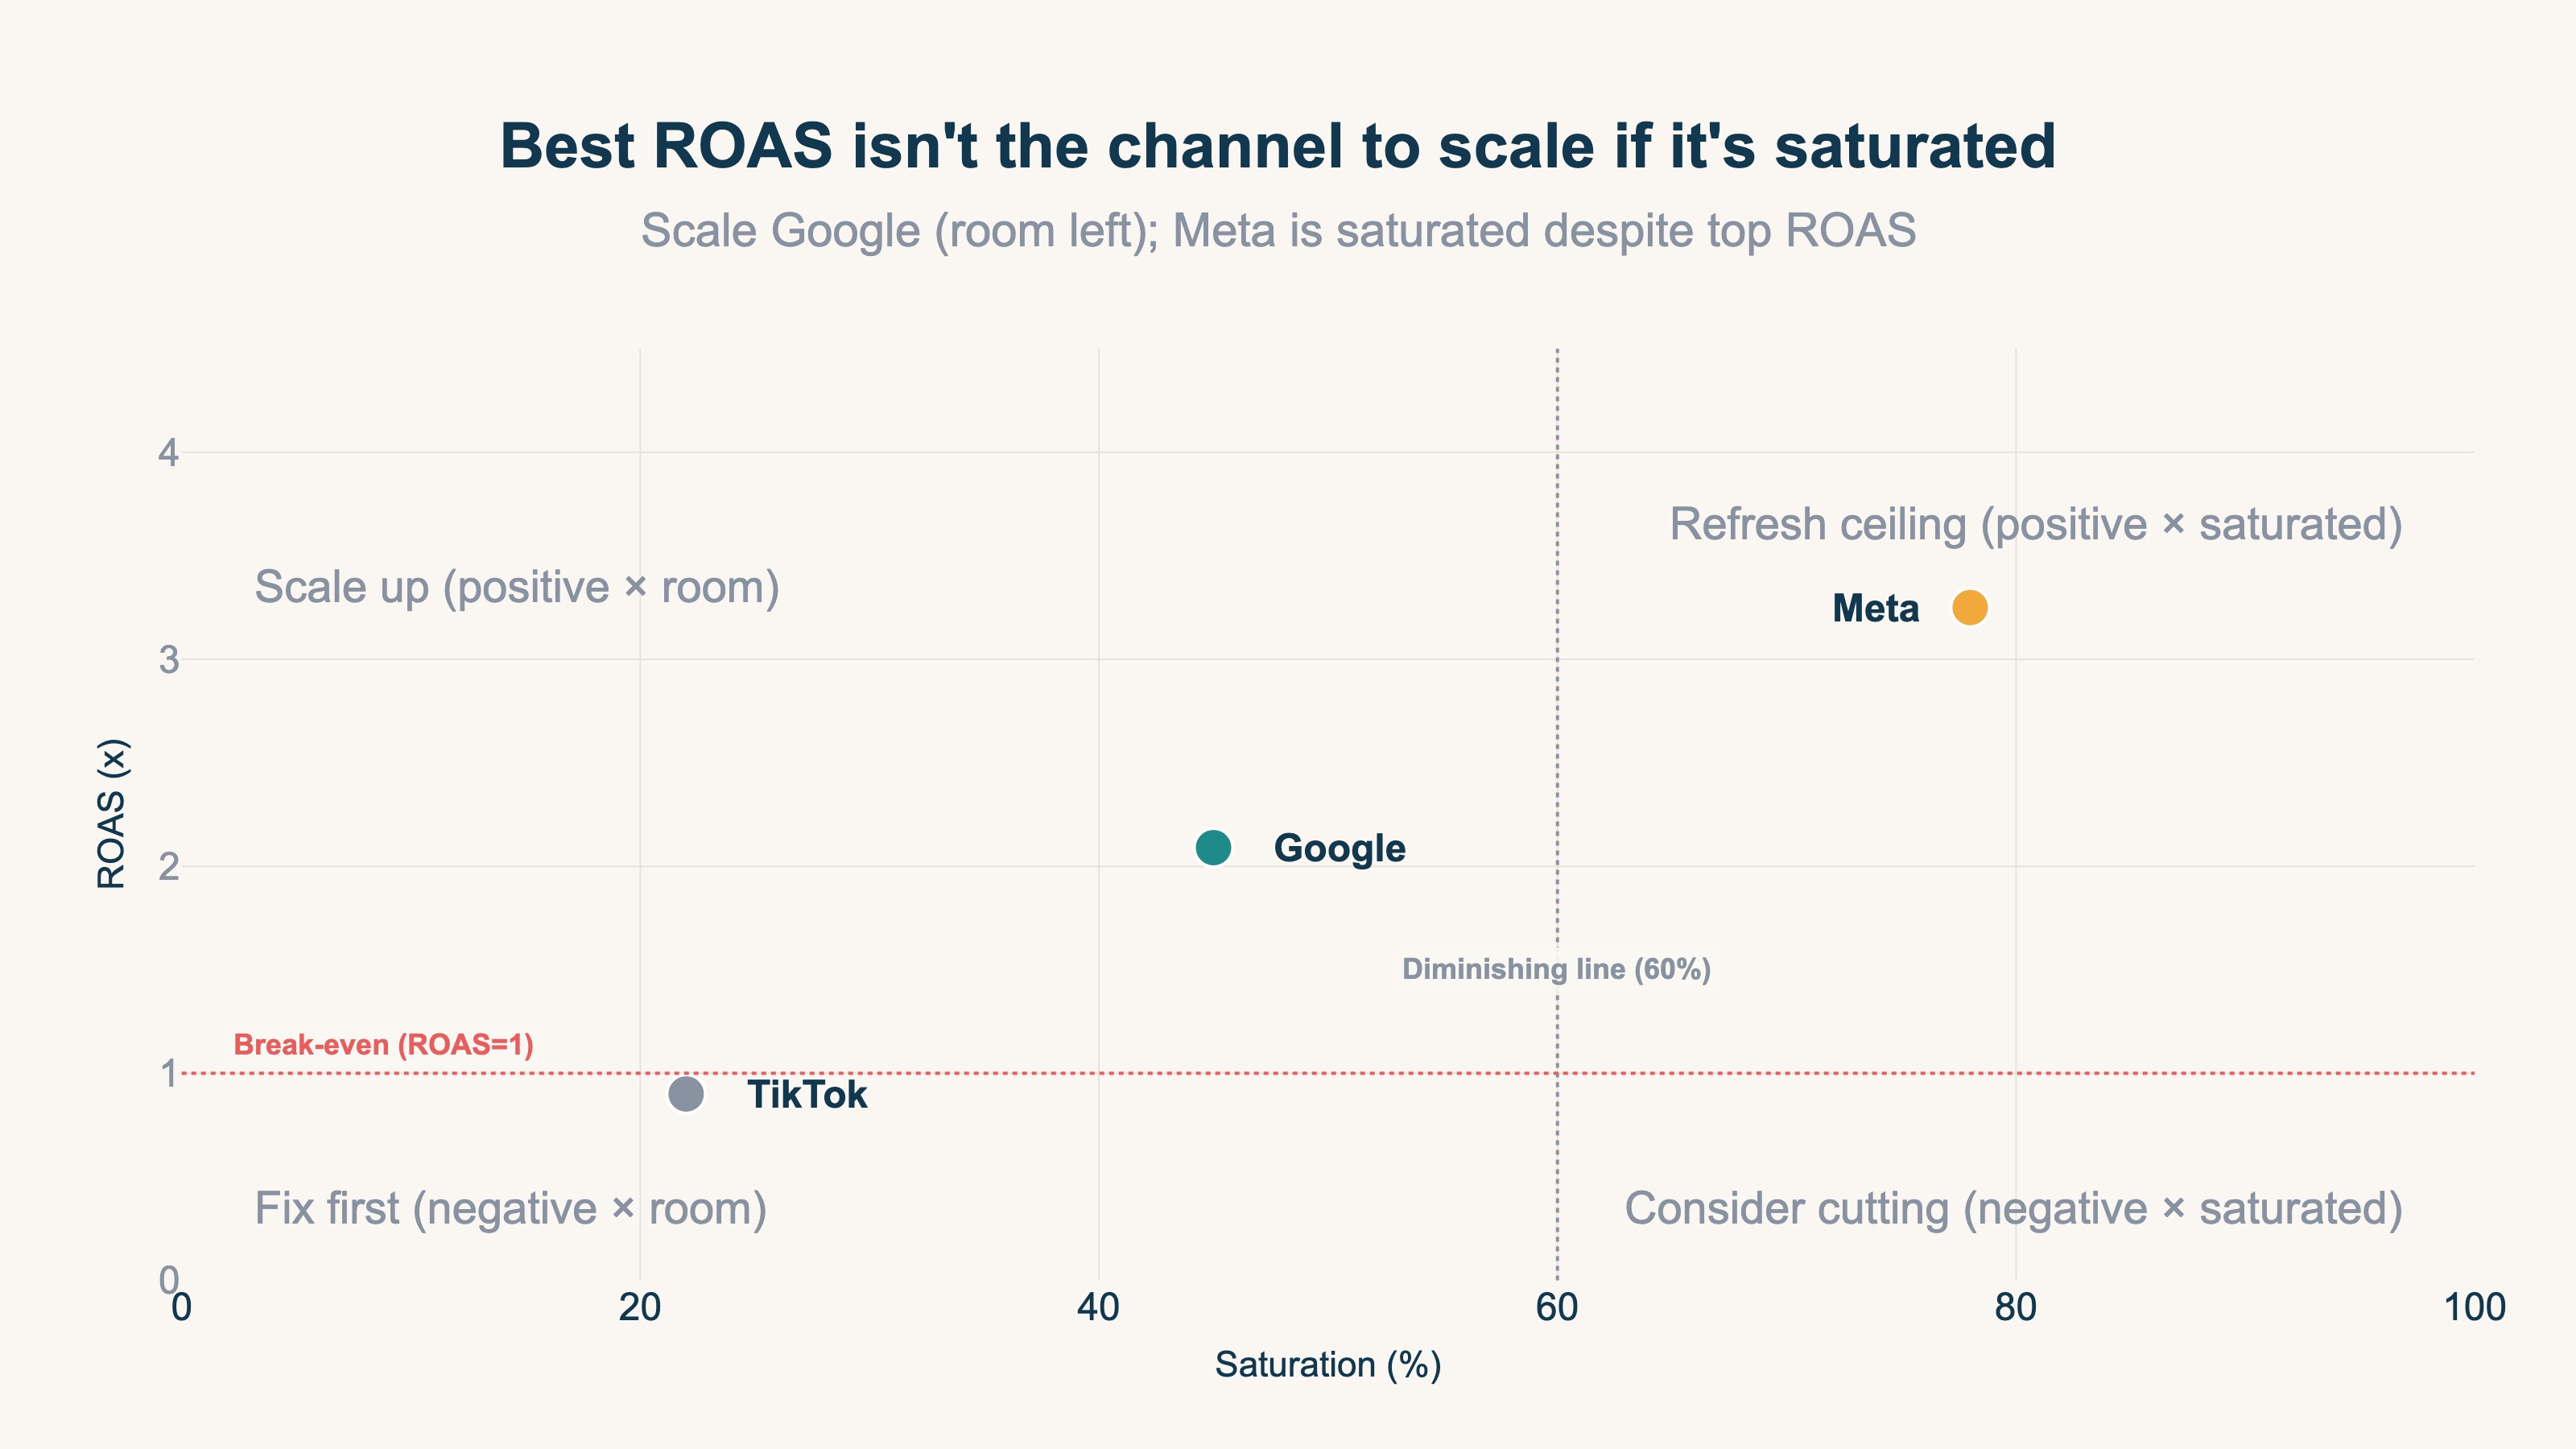
Add saturation and channels look different. A common mistake is "add budget to the best-ROAS channel." But if that channel is already saturated, the added portion is low-efficiency. Conversely, a channel with slightly lower ROAS but room to grow turns added budget straight into results.
The decision splits three ways.
- Scale: channels with saturation headroom (roughly under 60%) and a profitable ROAS. This is where your "next ¥10k" goes.
- Refresh: channels with high saturation (80%+) you don't want to drop. Swap creative or audience to lift the ceiling, then reconsider scaling.
- Cut (or hold): channels with a loss-making ROAS. Even with saturation headroom, don't add until you have evidence you can improve efficiency.
Combining ROAS and saturation lets you lay out "where to add, what to refresh, what to stop" on one view. Ad dashboards are siloed per channel, so the starting point is putting every channel on the same basis.
RevenueScope solution
The root reason saturation goes unseen is that each ad dashboard shows only its own channel and won't compute saturation or marginal ROAS across all of them. The problem of each platform reporting only its own ROAS is also covered in platform ROAS vs MER.
Connect your ad-spend data to RevenueScope and it computes ROAS and saturation per connected channel, then returns the scale / refresh / cut call. For example (demo data):
| Channel | Ad spend | ROAS | Saturation | RevenueScope's call |
|---|---|---|---|---|
| Meta | ¥47,200 | 3.25 | 78% | ⚠️ Near saturation. Best ROAS, but little upside to adding |
| ¥117,000 | 2.09 | 45% | ✅ Room to grow. First choice to scale | |
| TikTok | ¥44,500 | 0.90 | 22% | ❌ Loss-making. Refresh or pause |
By ROAS alone Meta looks best, but at 78% saturation further spend loses efficiency. The channel to scale is Google, which still has room.
Ask "how should I allocate a ¥1,000,000 budget?" and it answers (demo data):
| Channel | Current | Proposed | Change | Reason |
|---|---|---|---|---|
| ¥117,000 | ¥182,000 | +55.6% | Scale up to the ceiling of 45% saturation | |
| Meta | ¥47,200 | ¥42,359 | −10.3% | Already at the ceiling at 78%. Trim slightly to optimize |
| TikTok | ¥44,500 | ¥0 | Pause | Loss-making. Re-evaluate after a refresh |
| Total deployable (ceiling) | ¥208,700 | ¥224,359 | — | — |
| Unallocated | — | ¥775,641 (78%) | — | Can't be absorbed by the existing 3 channels |
This is the danger of saturation. Even with a ¥1,000,000 budget, only about ¥224k can be efficiently allocated across these three channels — and most of that is maintaining current spend, with just ¥65k of genuinely new room (Google). Force the remaining ~78% into the existing three and you over-invest in saturated channels, worsening overall ROAS. The rest is better spent opening new channels, refreshing creative, or simply held back. That's a call you can only make by looking across all channels at once — not from any single ad dashboard.
One thing to be clear about: RevenueScope can return saturation, marginal ROAS, and a budget-allocation suggestion only when you connect ad-spend data (each platform's spend); for periods with no spend connected, neither ROAS nor saturation is shown. And the ROAS here is conversion value divided by ad spend — a revenue-based ratio. RevenueScope does not output profit after cost of goods (gross margin) or inventory (revenue-based ROAS is a different thing from profit-based ROAS vs ROI). The allocation is a starting point for a human to decide, not automated bidding. The final call on where to add budget is yours.
FAQ#
Frequently asked questions#
Q. How is saturation calculated?
A. From how much you've spent on a channel and how the results have grown, it estimates how far the return on each added yen (marginal ROAS) has fallen, expressed as 0–100%. Closer to 100% means the current approach is losing efficiency on added spend. It's an estimate, so seasonality or creative changes can move the ceiling.
Q. If ROAS is still profitable, can't I keep adding?
A. Average ROAS can be profitable while the last portion you added (marginal ROAS) has dropped below break-even. Decisions need the marginal, not the average. Saturation makes that marginal decline visible, so it's safest to judge with both ROAS and saturation.
Q. Does a saturated channel mean it's unusable?
A. No. It means "hard to grow with the current approach." Change the creative or widen the audience, and as the responsive pool grows, the ceiling itself rises. High saturation means consider a refresh first, not an immediate cut.
Q. Where can I see my channel's saturation?
A. Each ad dashboard (Google Ads, Meta Ads, etc.) reports its own ROAS but generally has no feature to compute saturation or marginal ROAS across channels. To gather multiple channels' spend in one place and compute saturation, a cross-channel tool like RevenueScope is a useful complement.
Conclusion#
Ads sell to the most responsive audience first, so the more you spend, the less each added yen returns (marginal ROAS). That's saturation. Average ROAS hides the decline, so "the average is still profitable, let's add more" is how profit disappears.
As a first step, ask per channel: "if I scale up now, what would the ROAS on the added portion be?" The place for your next ¥10k isn't the best-ROAS channel — it's the one with saturation headroom.
See which ads actually drive revenue, at a glance
Free up to 5,000 sessions/month, AI analyst included. No credit card required. Up and running in 5 minutes.
References#
- Google, "About Target ROAS bidding," 2024
- Meta, "About budgets and schedules," 2024
- Google, "Set a budget for your campaign," 2024