I run a small store that sells a single product, and every month I get stuck on "how much ad budget to put in which channel." The usual articles tell me "ad spend should be 20-30% of sales," but that is about how much to spend overall — it says nothing about which channel the next ¥10,000 should go to. With one product, I can't spread sales across a product mix, so the precision of this channel choice decides, directly, the profit I keep. This article lays out — as plainly as I can — how to allocate budget by real per-channel profit and by "how much the added spend actually returned," rather than a total-spend rule of thumb.
Table of Contents
TL;DR#
-
"What percentage of sales" is only a total-budget guideline
It answers how much to spend overall — not which channel the next ¥10,000 belongs to
-
Decide the next ¥10,000 at the margin
Look at the extra revenue the added spend produced, not the average ROAS. Topping up a saturated channel won't grow it
-
Allocate by real per-channel profit
Not the platforms' self-reported numbers — align your own revenue on one common basis and compare it by RPS and contribution profit
-
One product means there's nowhere to hide
You can't spread sales across a product mix, so channel precision converts straight into profit
1. Why a percentage of sales cannot allocate budget#
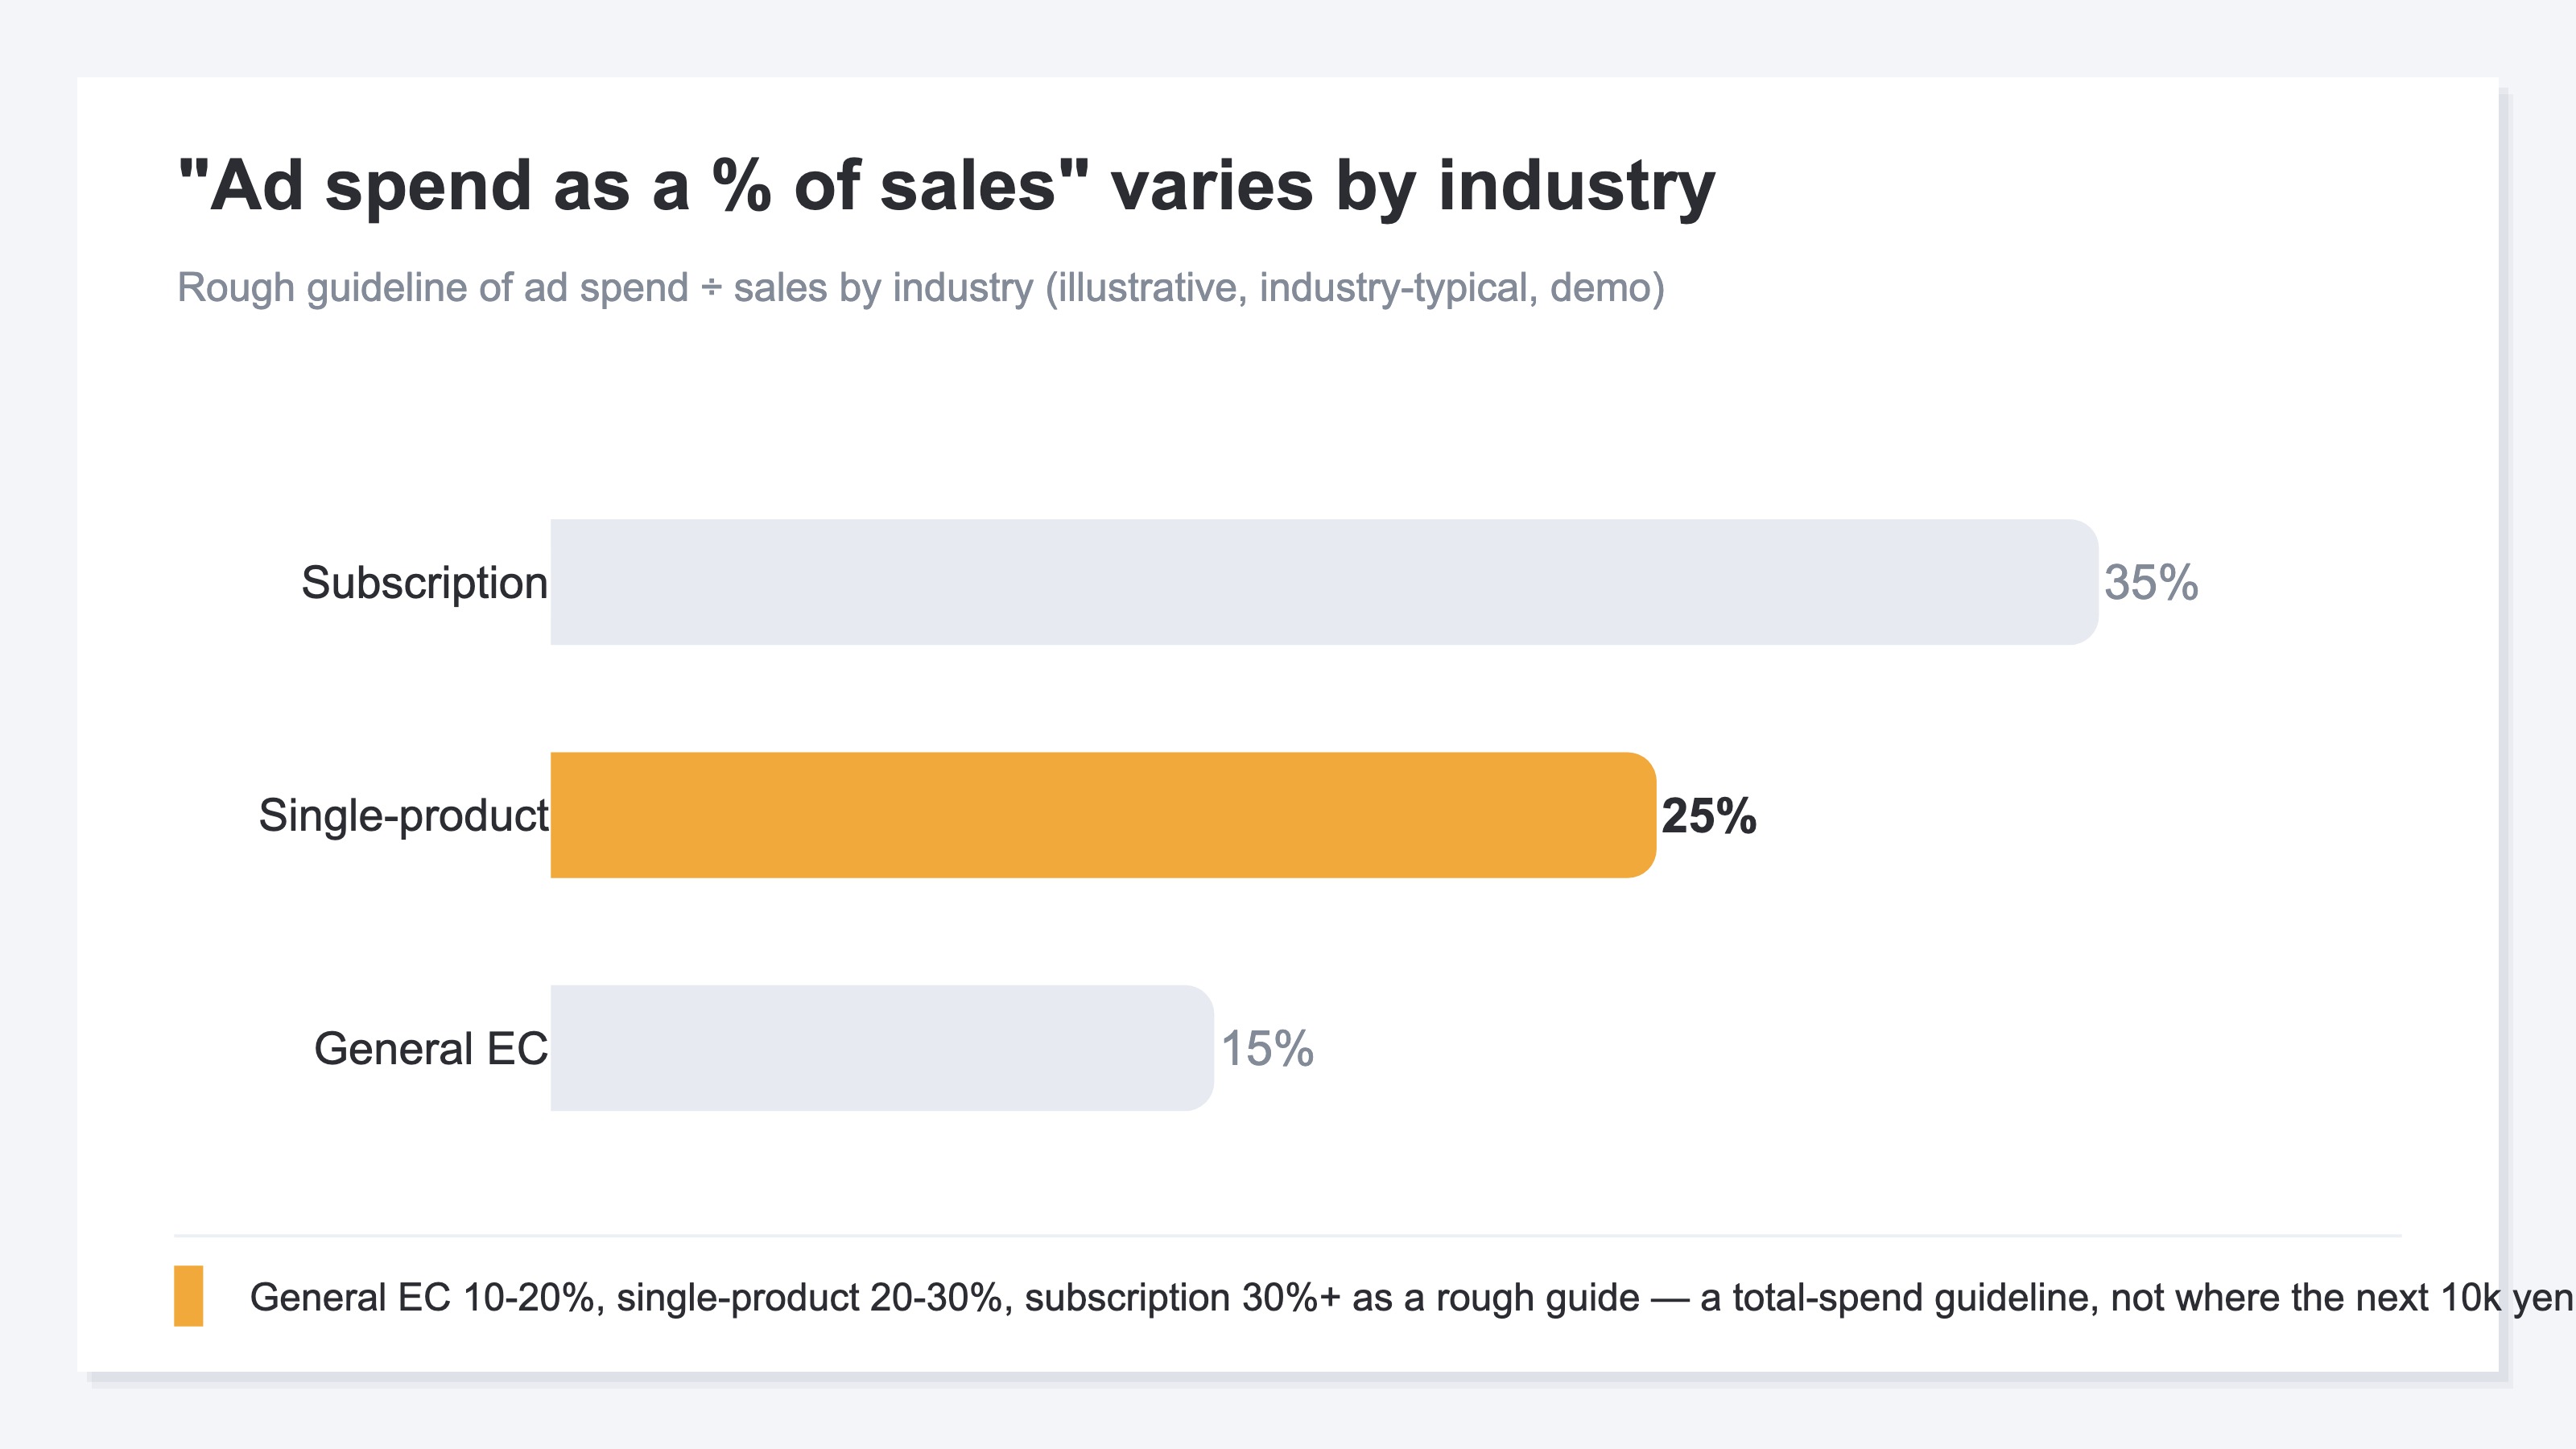
Bottom line: "percentage of sales" is a total-spend guideline; it does not tell you which channel the next ¥10,000 belongs to.
Japan's BtoC physical-goods EC market keeps growing[4], and within it, single-product commerce — betting on one item — is often quoted at "ad spend of 20-30% of sales," varying by category[1]. For subscription cosmetics and supplements it can exceed 30%[3]. As a rough ceiling on how much you may spend on ads overall, that is useful.
But the decision you actually agonize over daily is elsewhere: "how do I split the budget I have across search ads, social ads, and retargeting?" and "if I can add ¥10,000 next month, which channel returns the most?" This allocation — the next move — is the judgment that drives profit. A total-spend guideline like "percentage of sales" answers none of it. Even the KPIs you should watch to recover ad spend in single-product subscription commerce lean toward per-channel efficiency, not a total ratio[2].
And a single-product store sells exactly one item. A multi-product store can cover a missed ad on one item with another; a one-SKU store cannot. Get the channel split wrong and the loss hits the whole business directly. That is why you can't rest easy on a total guideline — you have to look one level deeper into the allocation itself.
2. Place the next ¥10,000 at the margin#
Bottom line: judge a channel not by its average ROAS but by the extra revenue the added spend produced — the margin.
The most important question in allocation is "where does the next ¥10,000 go?" What you should look at here is not the channel's average ROAS (return on ad spend). It is how much extra revenue the added spend generated. We call this "looking at the margin."
Say a channel takes ¥100,000 a month and returns ¥300,000 — an average ROAS of 3x. Add ¥10,000, though, and revenue may not rise by ¥30,000. If you've nearly reached everyone likely to buy, that extra ¥10,000 might add only ¥5,000. That is channel "saturation."
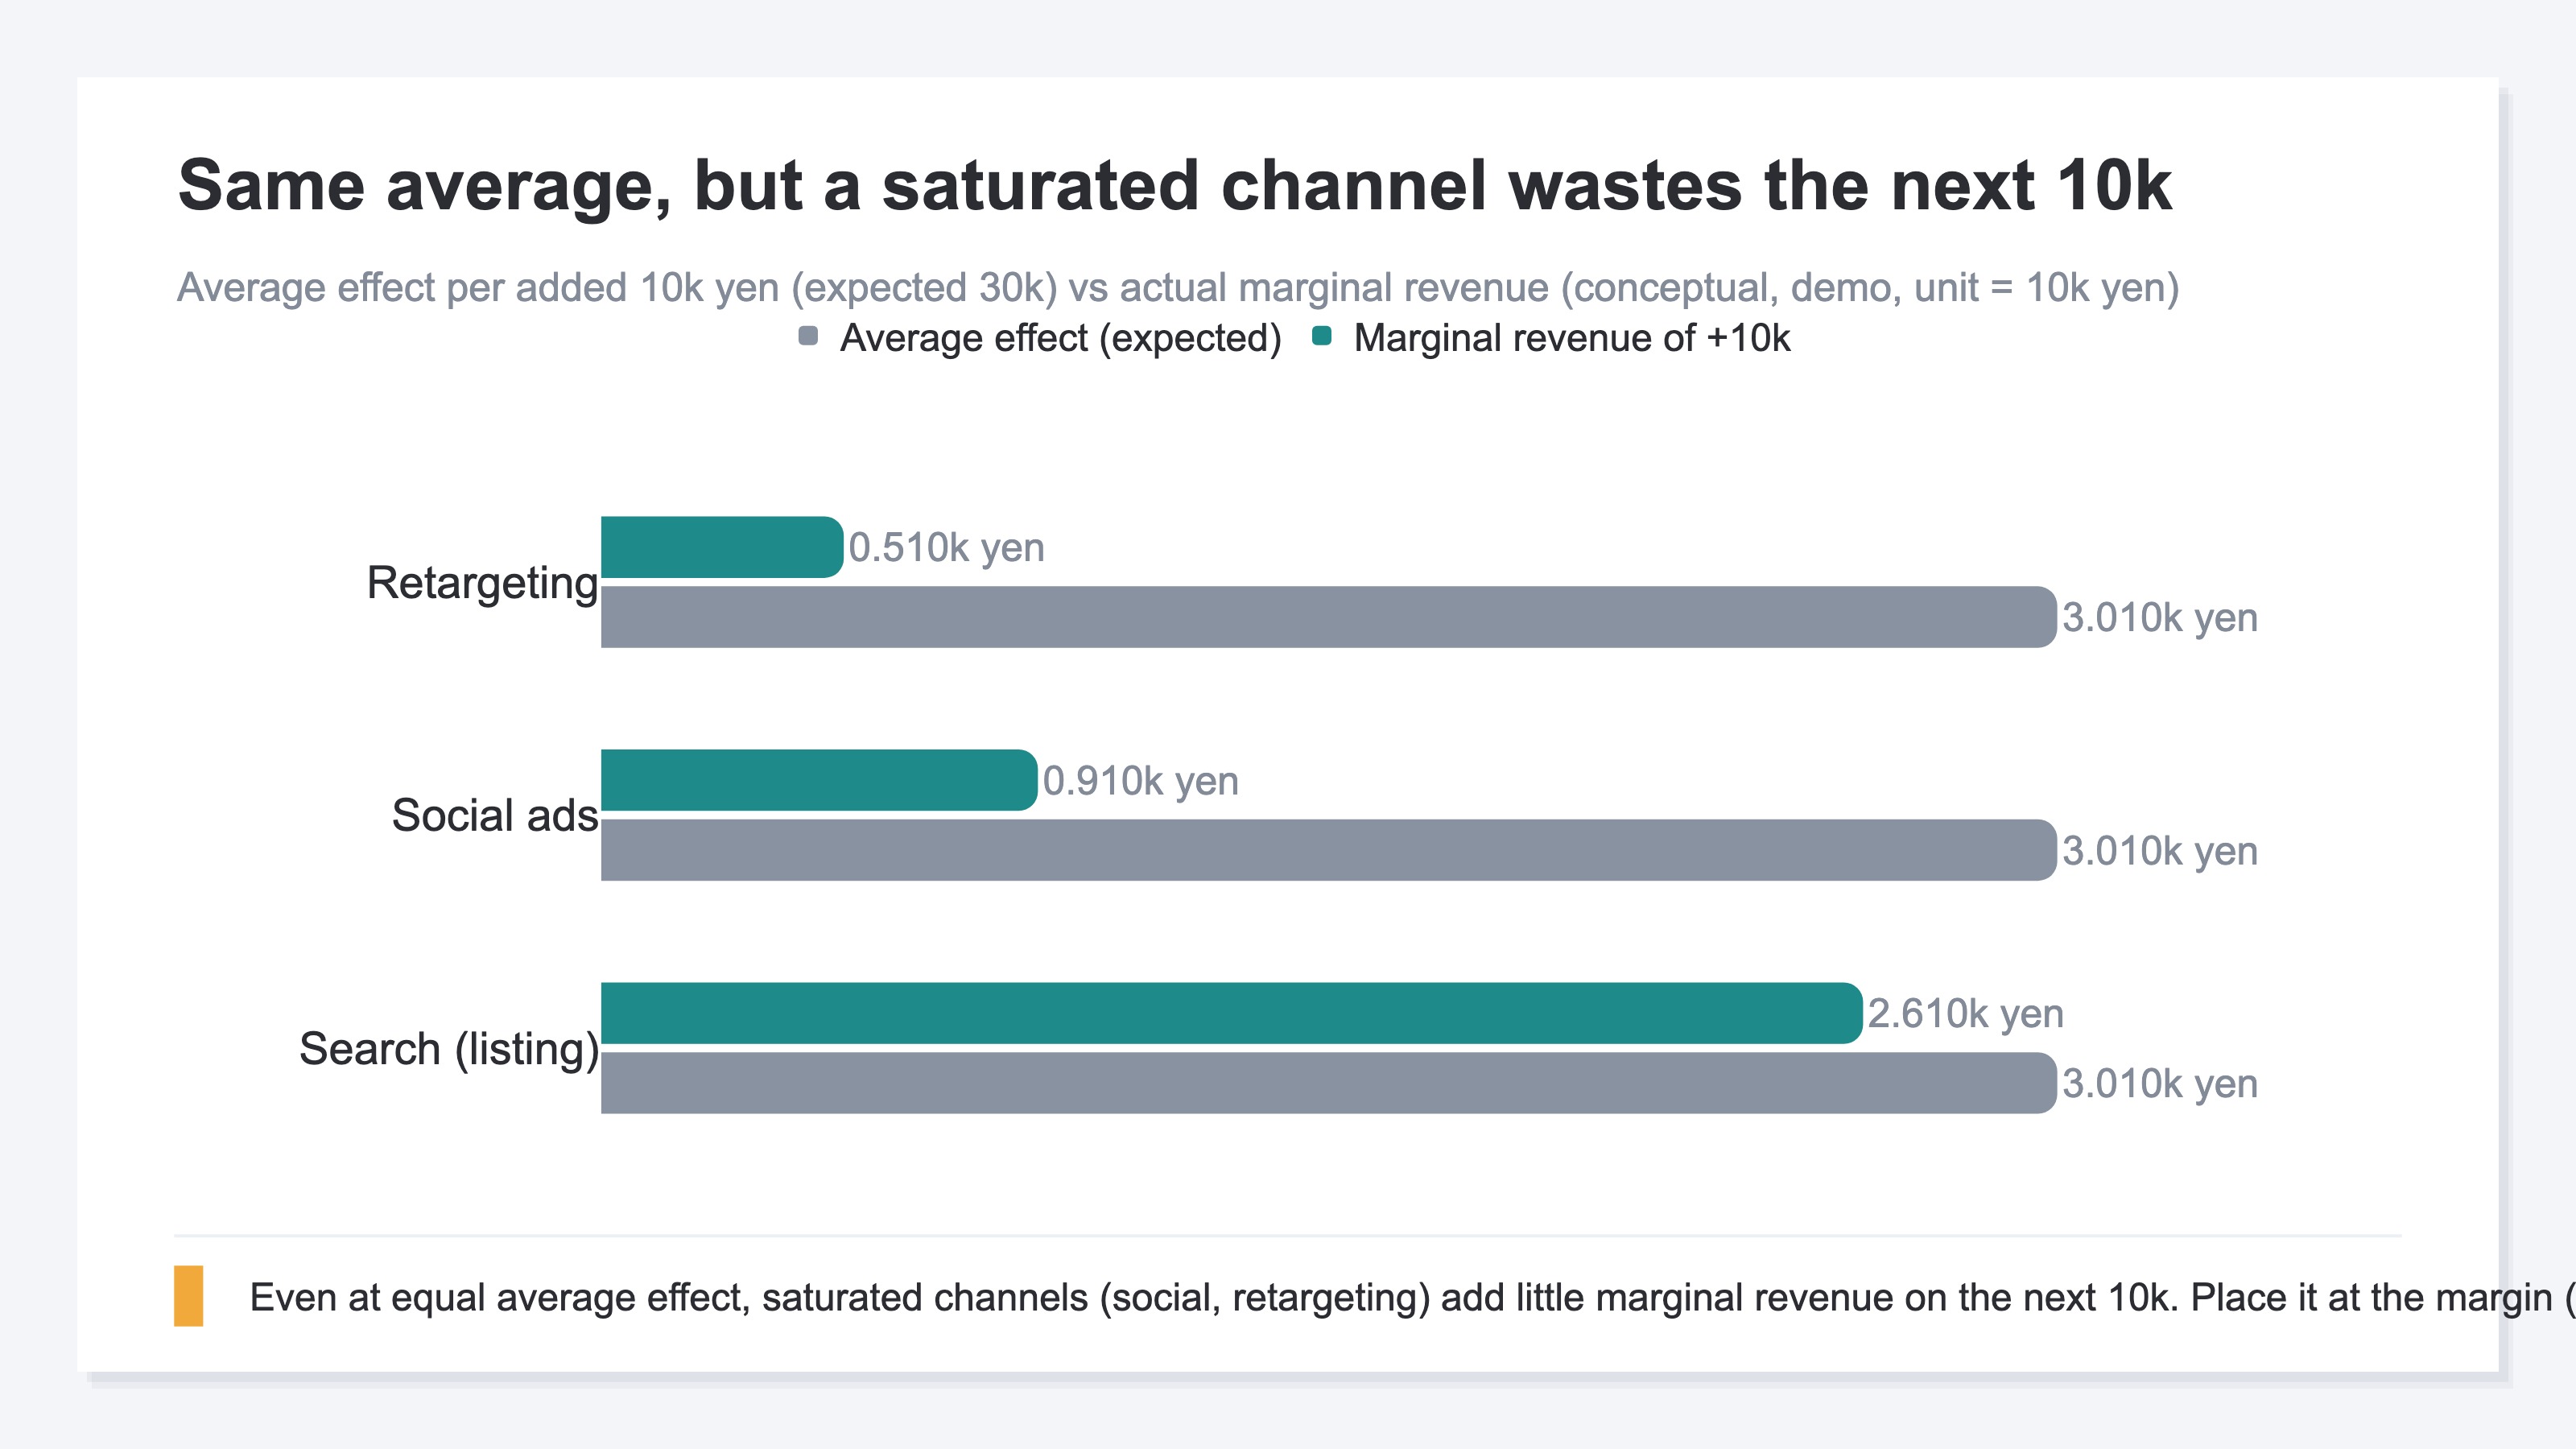
So the next ¥10,000 belongs not in "the channel with the highest average ROAS" but in "the channel that still grows cleanly when you add to it." A high-average-ROAS channel that's already saturated wastes the top-up. A plain-looking channel with headroom returns more revenue on the same ¥10,000. For why more ad spend doesn't always mean more profit, see When more ads stop paying: spotting ad saturation.
3. Compare channels by real profit: RPS and contribution#
Bottom line: allocate on your own revenue aligned across channels — compared by RPS and contribution profit — not the platforms' self-reports. The idea is simple; the heavy part is re-aligning every channel to the same basis each month.
Even once you decide to judge at the margin, you can't if the numbers behind it are scattered across platforms. The ROAS each ad platform reports is a self-report calculated to suit that platform, and the same sale is often double-counted by several platforms claiming it as their own. So before allocating, you have to align your own real revenue on one common basis across all channels. The gap between platform self-reported ROAS and the real efficiency seen across the whole site (MER) is laid out in Platform ROAS vs MER: why they differ.
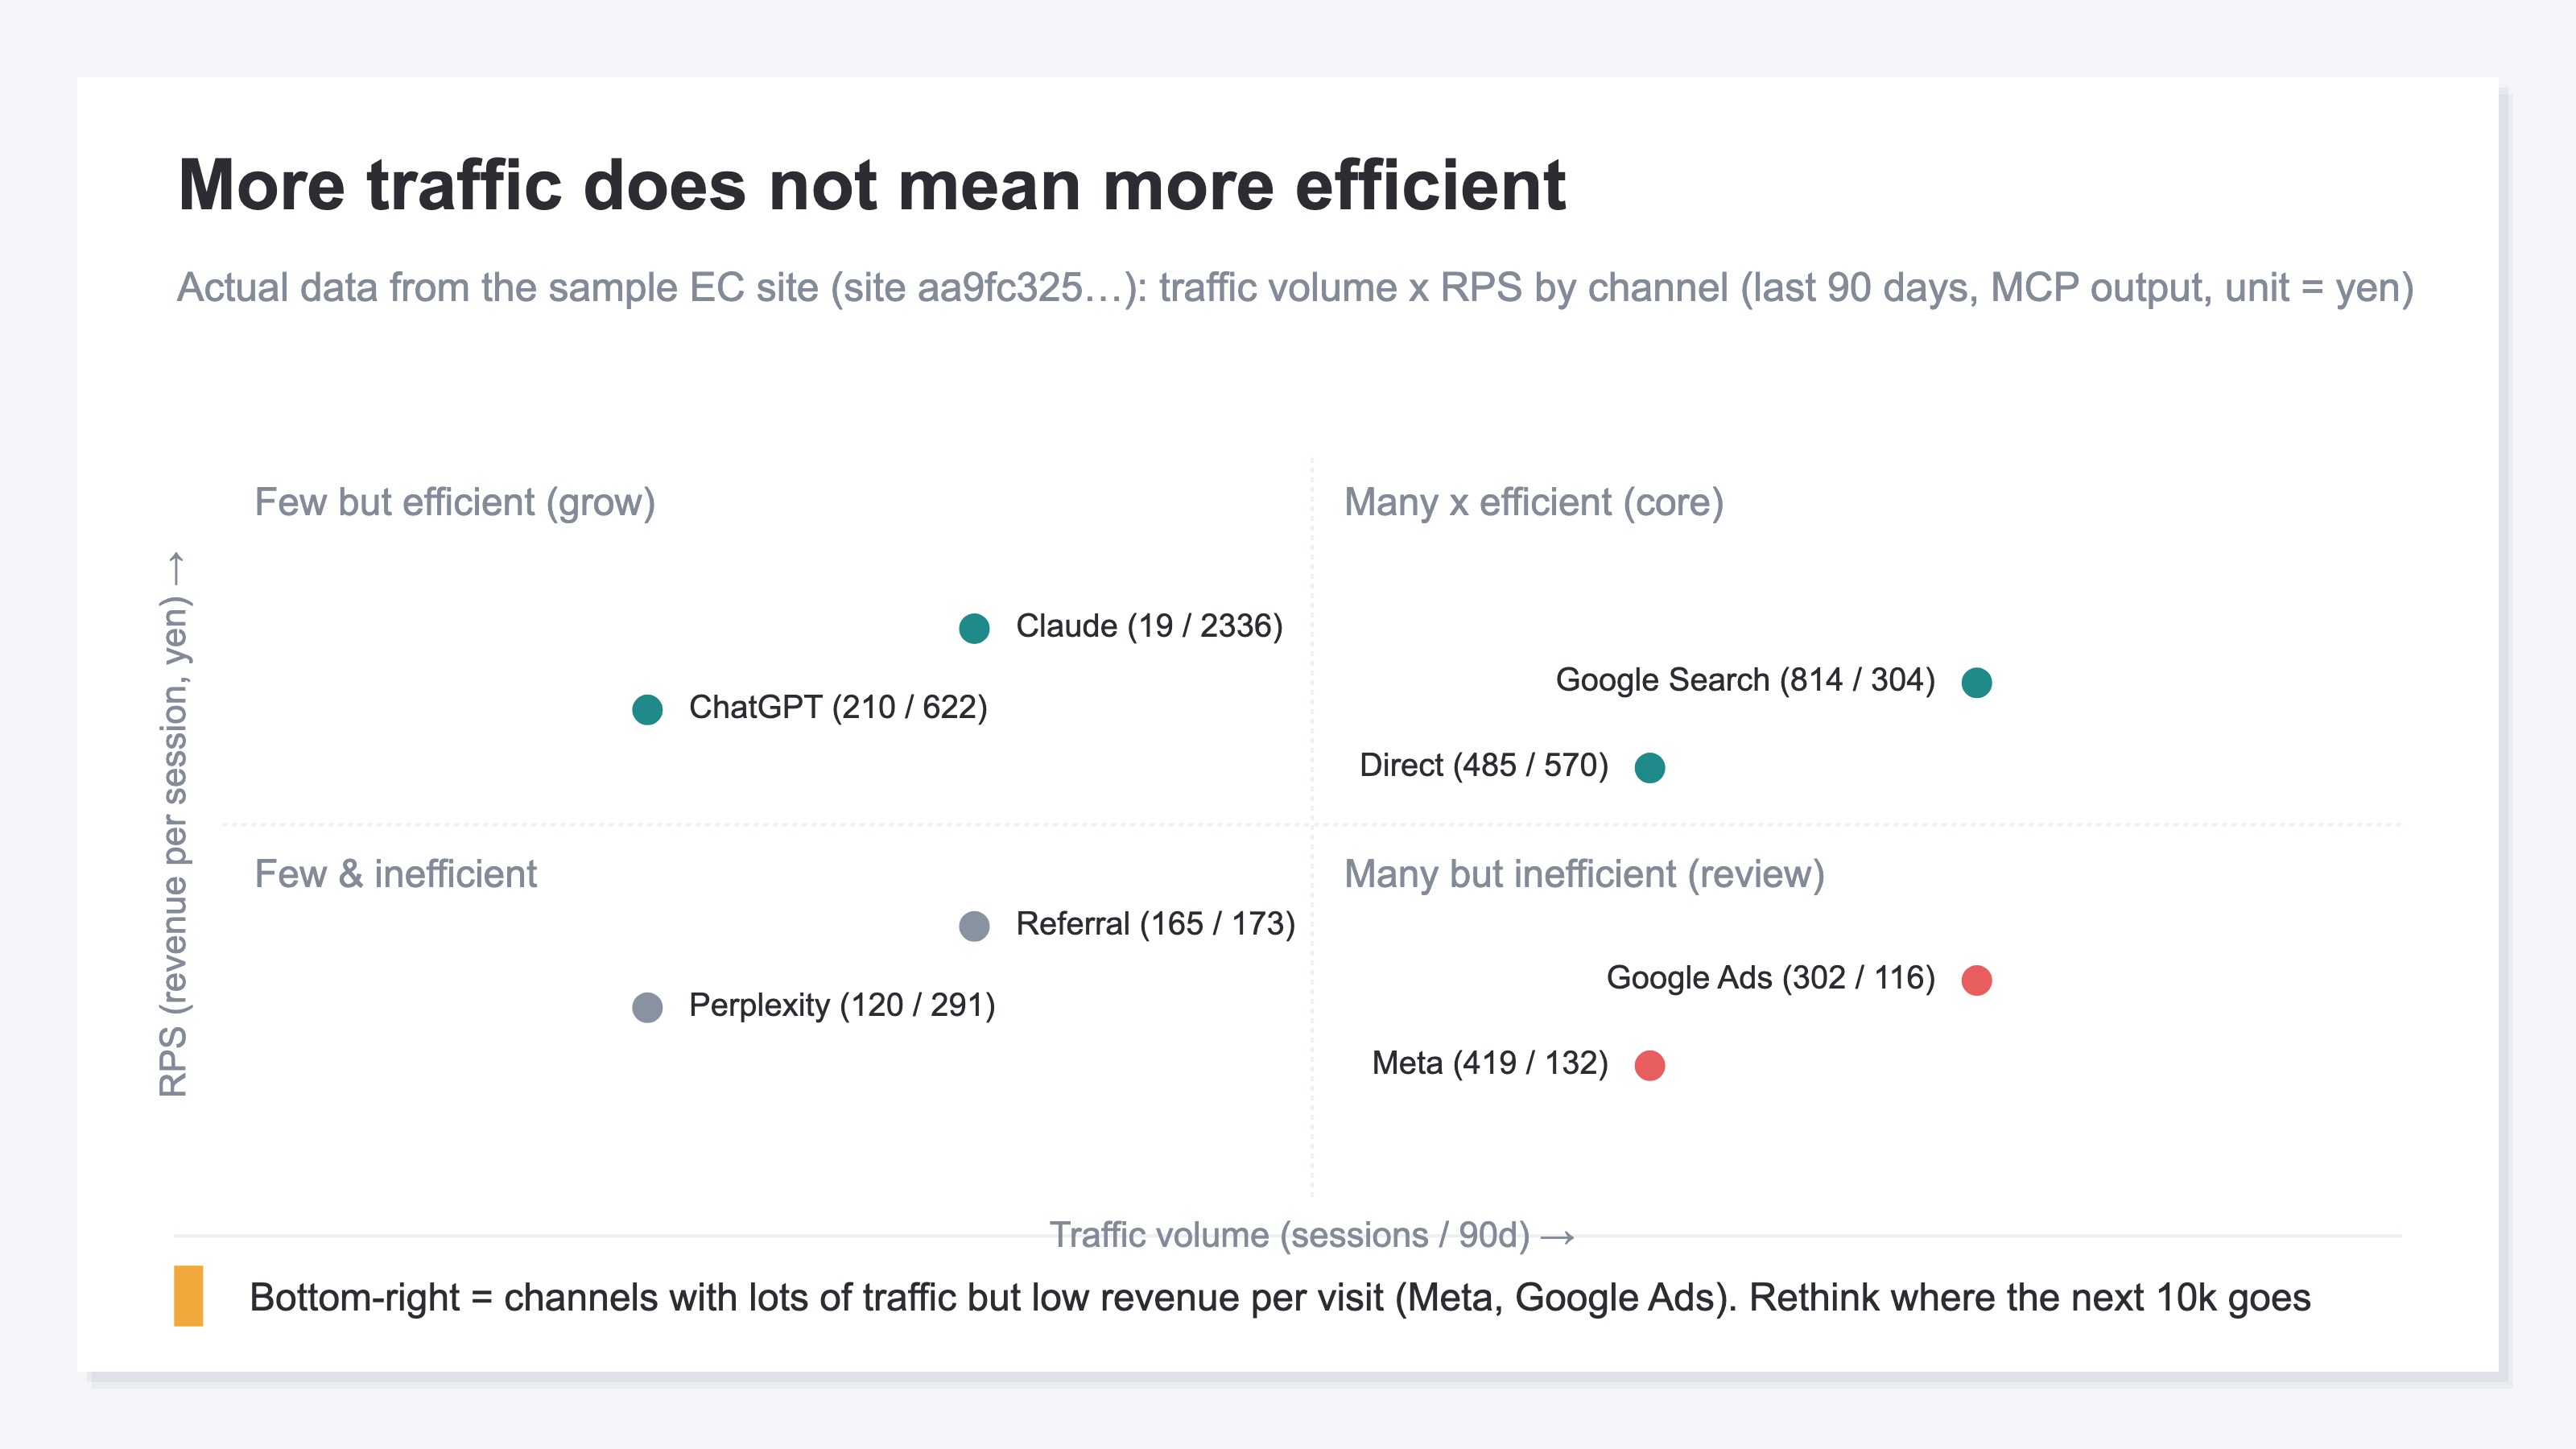
A handy tool here is RPS (revenue per session) — channel revenue divided by that channel's sessions, i.e., the average revenue one visit produced. The channel with the most traffic isn't the winner; a channel with few visits that convert well is more efficient — that shows up in this single number. How to compute RPS and where to use it is collected in RPS (revenue per session): the complete guide.
RPS          = channel revenue / channel sessions
Contribution = revenue - (cost + shipping + payment fees + ad spend)
Single-product commerce has one advantage here. With one product, cost, shipping, and payment fees are roughly fixed — so contribution profit (revenue minus the costs directly incurred, i.e., the profit you keep) is easy to estimate. A multi-product store is fiddly because each item has a different cost; with one SKU the "revenue ranking" is close to the "profit ranking."
The idea itself isn't hard. You align revenue and sessions by channel, compute RPS, add an approximate contribution profit, and compare. What's hard is doing this every month. Smoothing out the double-counting in each platform's self-reported ROAS, reconciling channel names that are written inconsistently, excluding automated programs (bots), and then continuing to line up every channel on the same basis — keeping this preprocessing alive by hand each month is quietly heavy work. And a view that puts each channel's "RPS × real revenue" on one screen to compare simply isn't there, structurally, in GA4's standard reports. So RPS and contribution profit are a "starting point for narrowing down where the next ¥10,000 goes" — but not something that, by themselves, settles every month's allocation.
One more thing: when you evaluate channels, also checking "is it bringing in new customers" sharpens the call. For the trap where a high-ROAS platform is actually skewed toward returning customers, see Are high-ROAS channels the risky ones? Evaluating channels by splitting new from returning.
RevenueScope solution
Bottom line: to decide "where the next ¥10,000 goes" from true ROAS and saturation, you have to align each platform's self-report onto one basis and put "how much more each channel can still absorb efficiently" on a single screen across all channels. RevenueScope takes over that reconciliation.
Even when you want to decide "where the next ¥10,000 goes" by margin and real profit, each platform's self-reported ROAS is inconsistent — and "across all channels combined, how much more can I still spend efficiently?" never surfaces from looking at ad dashboards one at a time. That is where single-product budget allocation stumbles most.
RevenueScope connects to your ad accounts (Google, Meta, TikTok, and so on), pulls each platform's ad spend, and reconciles it against your own revenue tracking. On top of each channel's true ROAS (return on ad spend), it then produces a saturation score — how much efficiency has already dropped by the time you add one more yen — on a 0-100% scale. The closer to 100%, the harder it is to grow by spending more.
For example, ask RevenueScope to "show channel efficiency and saturation," and it returns each channel's ad spend, revenue, true ROAS, saturation, and a suggestion in one list (display is demo data).
| Channel | Ad spend (¥) | True ROAS | Saturation |
|---|---|---|---|
| Google Ads | 584,089 | 3.18x | 49% |
| Meta | 808,858 | 1.86x | 67% |
Display is demo data (a fictional site with sample data). Saturation is an estimate based on industry averages.
What works here is reading ROAS and saturation together. Even a high-ROAS channel won't grow cleanly on the next ¥10,000 if its saturation is near the ceiling. Conversely, a channel with plain ROAS but headroom in saturation still returns on the same ¥10,000. The "next ¥10,000" belongs not in the highest-average-ROAS channel but in the one with saturation headroom — and the numbers make that visible.
It gets stronger from here. Ask RevenueScope "if I allocate an extra ¥500,000 a month," and it returns the ceiling and breakdown you can deploy while keeping efficiency in your current channel mix, with the assumptions and constraints attached (display is demo data).
Of a ¥500,000 budget, ¥0 can be added while keeping current efficiency. The remaining ¥500,000 (100%) has no efficient place to go — both current channels have hit their saturation ceiling. We recommend one of: opening new channels, refreshing creative, or holding the budget in reserve.
"Budget you could raise, but with no efficient place to put it" — that's a judgment you can only produce because you're looking across every channel's ad spend at once, and it exists to stop over-investment (saturation is an estimate based on industry averages; in reality, efficiency declines gradually even inside the saturation point).
We tend to assume "raise the budget and sales rise too," but if current channels are saturated, most of the added spend only lowers efficiency. RevenueScope turns "how much you can still add efficiently to current channels" and "from where you should shift to opening new channels or refreshing creative" into decision material, gathering every channel onto one screen. That is an answer that never comes out of viewing GA4 or each ad dashboard one at a time — it only appears across channels.
What RevenueScope produces is the true ROAS of channels whose ad spend it has pulled in, per-channel revenue efficiency (RPS), and a first-draft allocation informed by saturation. Focused on these revenue-based numbers, it narrows down which channel the next ¥10,000 belongs to. Contribution profit and gross margin are the last step you finish on your own side by entering your business's cost, shipping, and fees — and because RevenueScope hands you the revenue ranking, laying the profit ranking on top of it is a light final touch. What RevenueScope takes over is the heavy manual work of re-aligning this "where the next ¥10,000 goes" across every channel, every month, so you can focus on the final allocation call.
Even at the stage where you haven't connected ad spend yet, RevenueScope lists high- and low-efficiency channels by RPS (revenue per session). Connect your ad accounts and it goes further — into the true ROAS, saturation, and allocation draft above: a two-tier setup. The more a business rides on a single product, the more this "where the next ¥10,000 goes" precision decides profit directly.
FAQ#
Frequently asked questions#
Q. So how much should a single-product store actually spend on ads?
A. There's no single right number. "20-30% of sales" is a rough ceiling on the total, but what matters is how you split budget within that cap. Before worrying about the total, comparing per-channel efficiency (RPS) and checking whether budget is flowing to the channels that still grow has a bigger effect on profit.
Q. Should I prioritize search or social?
A. Deciding by your own numbers is surer than deciding by channel type. Search ads generally reach "people ready to buy now," so they're said to work early — but if already saturated, topping up is wasted. Look at each channel's RPS and the lift from adding ¥10,000 (the margin), and put money where it still grows.
Q. Do I have to calculate contribution profit precisely?
A. A rough figure is fine at first. With one product, cost, shipping, and fees are roughly fixed, so even a rough estimate keeps the revenue ranking close to the profit ranking. Start by comparing revenue and RPS by channel, then add an approximate contribution profit. If the ranking changes from the ROAS view, that's proof ROAS-only judgment is risky.
Conclusion#
A single-product store's ad budget can't be allocated by "what percentage of sales." That's a total-spend question; it doesn't tell you which channel the next ¥10,000 belongs to. Allocate by the margin — "how much the added spend actually returned" — not average ROAS, and compare channels by real per-channel profit (RPS and contribution profit) rather than the platforms' self-reports. Precisely because there's one product, cost is roughly fixed so profit is visible, and there's nowhere to hide a bad channel choice.
But even when the idea is simple, what actually works is "re-aligning every channel to the same basis, every month." Only after you smooth out the per-platform double-counting, exclude bots, and put true ROAS and saturation on one screen does "where the next ¥10,000 goes / from where to shift to a different move" become decision material. Keeping this cross-channel re-alignment going by hand each month is the heaviest part of single-product budget allocation. RevenueScope takes over exactly this heavy repetition, so you reach a state where the next ¥10,000's destination can be decided with real numbers.
See which ads actually drive revenue, at a glance
Free up to 5,000 sessions/month, AI analyst included. No credit card required. Up and running in 5 minutes.
References#
- [1] Tsuhan Tsushin, "What percentage of sales is the right ad-spend level for mail-order businesses? Category averages and rankings," 2024
- [2] Niche Media, "What is single-product subscription commerce? The KPIs needed to recover ad spend and make the model work," 2021
- [3] Netshop Manager Forum, "Ad tactics for single-product commerce sites, part 2: goal-setting and using video to maximize sales," 2022
- [4] Ministry of Economy, Trade and Industry, "FY2024 Survey on E-Commerce Market," 2025