Google Ads reports "ROAS 400%," and Meta Ads reports "ROAS 350%." Both look healthy on their own dashboards. But add the two numbers together to judge "overall ad efficiency," and you are looking at more revenue than actually exists — because each platform counts the same purchase as its own win. This guide explains why summing platform ROAS overstates results, what MER (whole-ad efficiency) is, and how to use the two together.
Table of Contents
TL;DR#
-
Platform ROAS gets "inflated" per channel
Each ad platform counts the same purchase as its own result, so summing ROAS exceeds your actual ad-driven revenue
-
MER = Total revenue ÷ Total ad spend
A single number for whole-business ad efficiency, immune to cross-platform double-counting
-
Use ROAS for per-channel tuning, MER for budget decisions
Daily optimization → ROAS / Budget allocation and whole-business efficiency → MER
-
MER alone still can't tell new from returning
A channel with high apparent ROAS is often skewed toward returning customers who would have bought anyway
1. How platform ROAS gets inflated#
Bottom line: each platform counts the same purchase, so summing ROAS exceeds your real revenue.
ROAS (return on ad spend) is a platform's ad-driven revenue divided by its ad spend. The ROAS in your Google Ads dashboard uses "the revenue Google decided was its own win," and Meta's ROAS uses "the revenue Meta decided was its own win."
The problem is that one customer often touches several ads before buying. If someone sees a Meta ad, discovers your product, then searches on Google and buys, both Meta and Google count "this purchase was thanks to my ad." That is double-counting in attribution (how revenue gets assigned to ads).
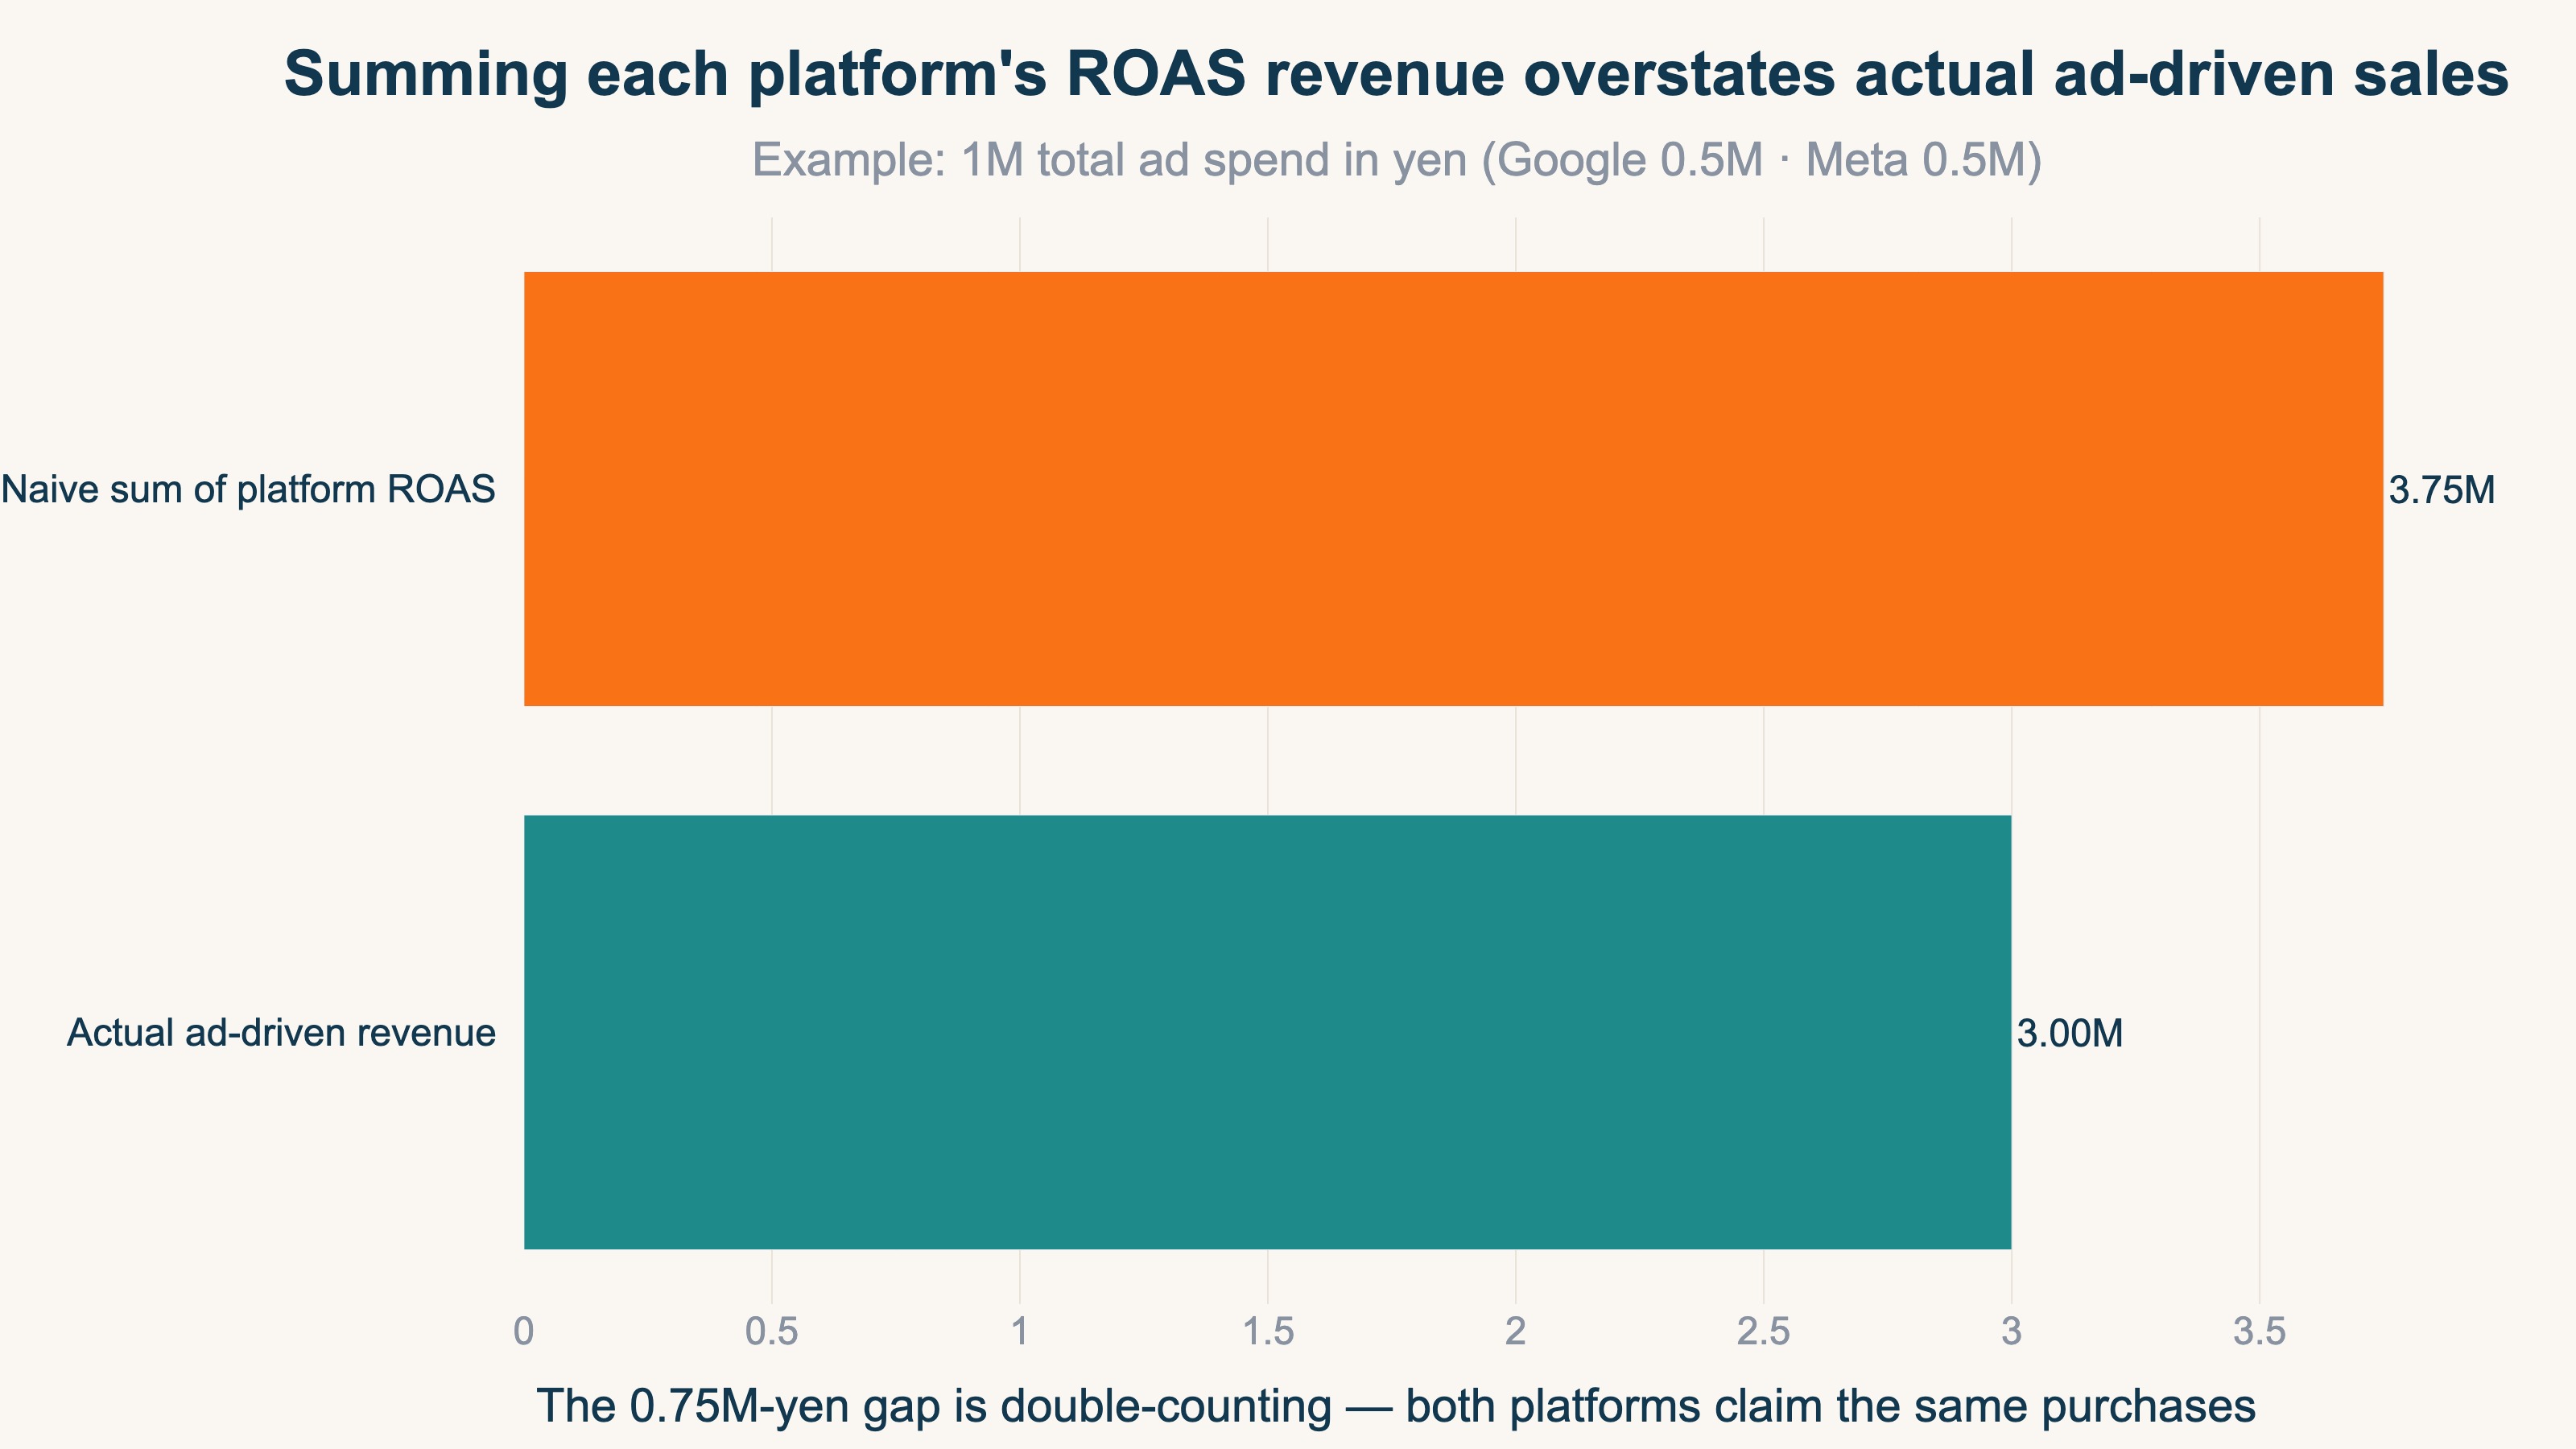
In numbers, for a store spending ¥1M total per month (Google ¥500K, Meta ¥500K):
Google reported : ROAS 400% → claimed revenue ¥2.0M
Meta reported   : ROAS 350% → claimed revenue ¥1.75M
Sum of platform claims      = ¥3.75M
Actual ad-driven revenue    = ¥3.0M
The claims add up to ¥3.75M, but actual ad-driven revenue is ¥3.0M. The ¥750K difference is double-counting — both platforms counting the same purchases. Simply summing per-platform ROAS overstates your total ad result by 25%.
2. What MER is#
Bottom line: MER is total revenue divided by total ad spend, measuring whole-business efficiency in one number.
MER (Marketing Efficiency Ratio) is your whole-business total revenue divided by total ad spend.
MER (%) = Total revenue ÷ Total ad spend × 100
For the same store, if total revenue — including organic search and direct traffic — is ¥5M against ¥1M of ad spend, MER is 500%. The key is that MER never assigns revenue to a specific platform. Because it makes no assignment, there is no double-counting. You see the plain efficiency of all advertising, with none of the per-platform inflation.
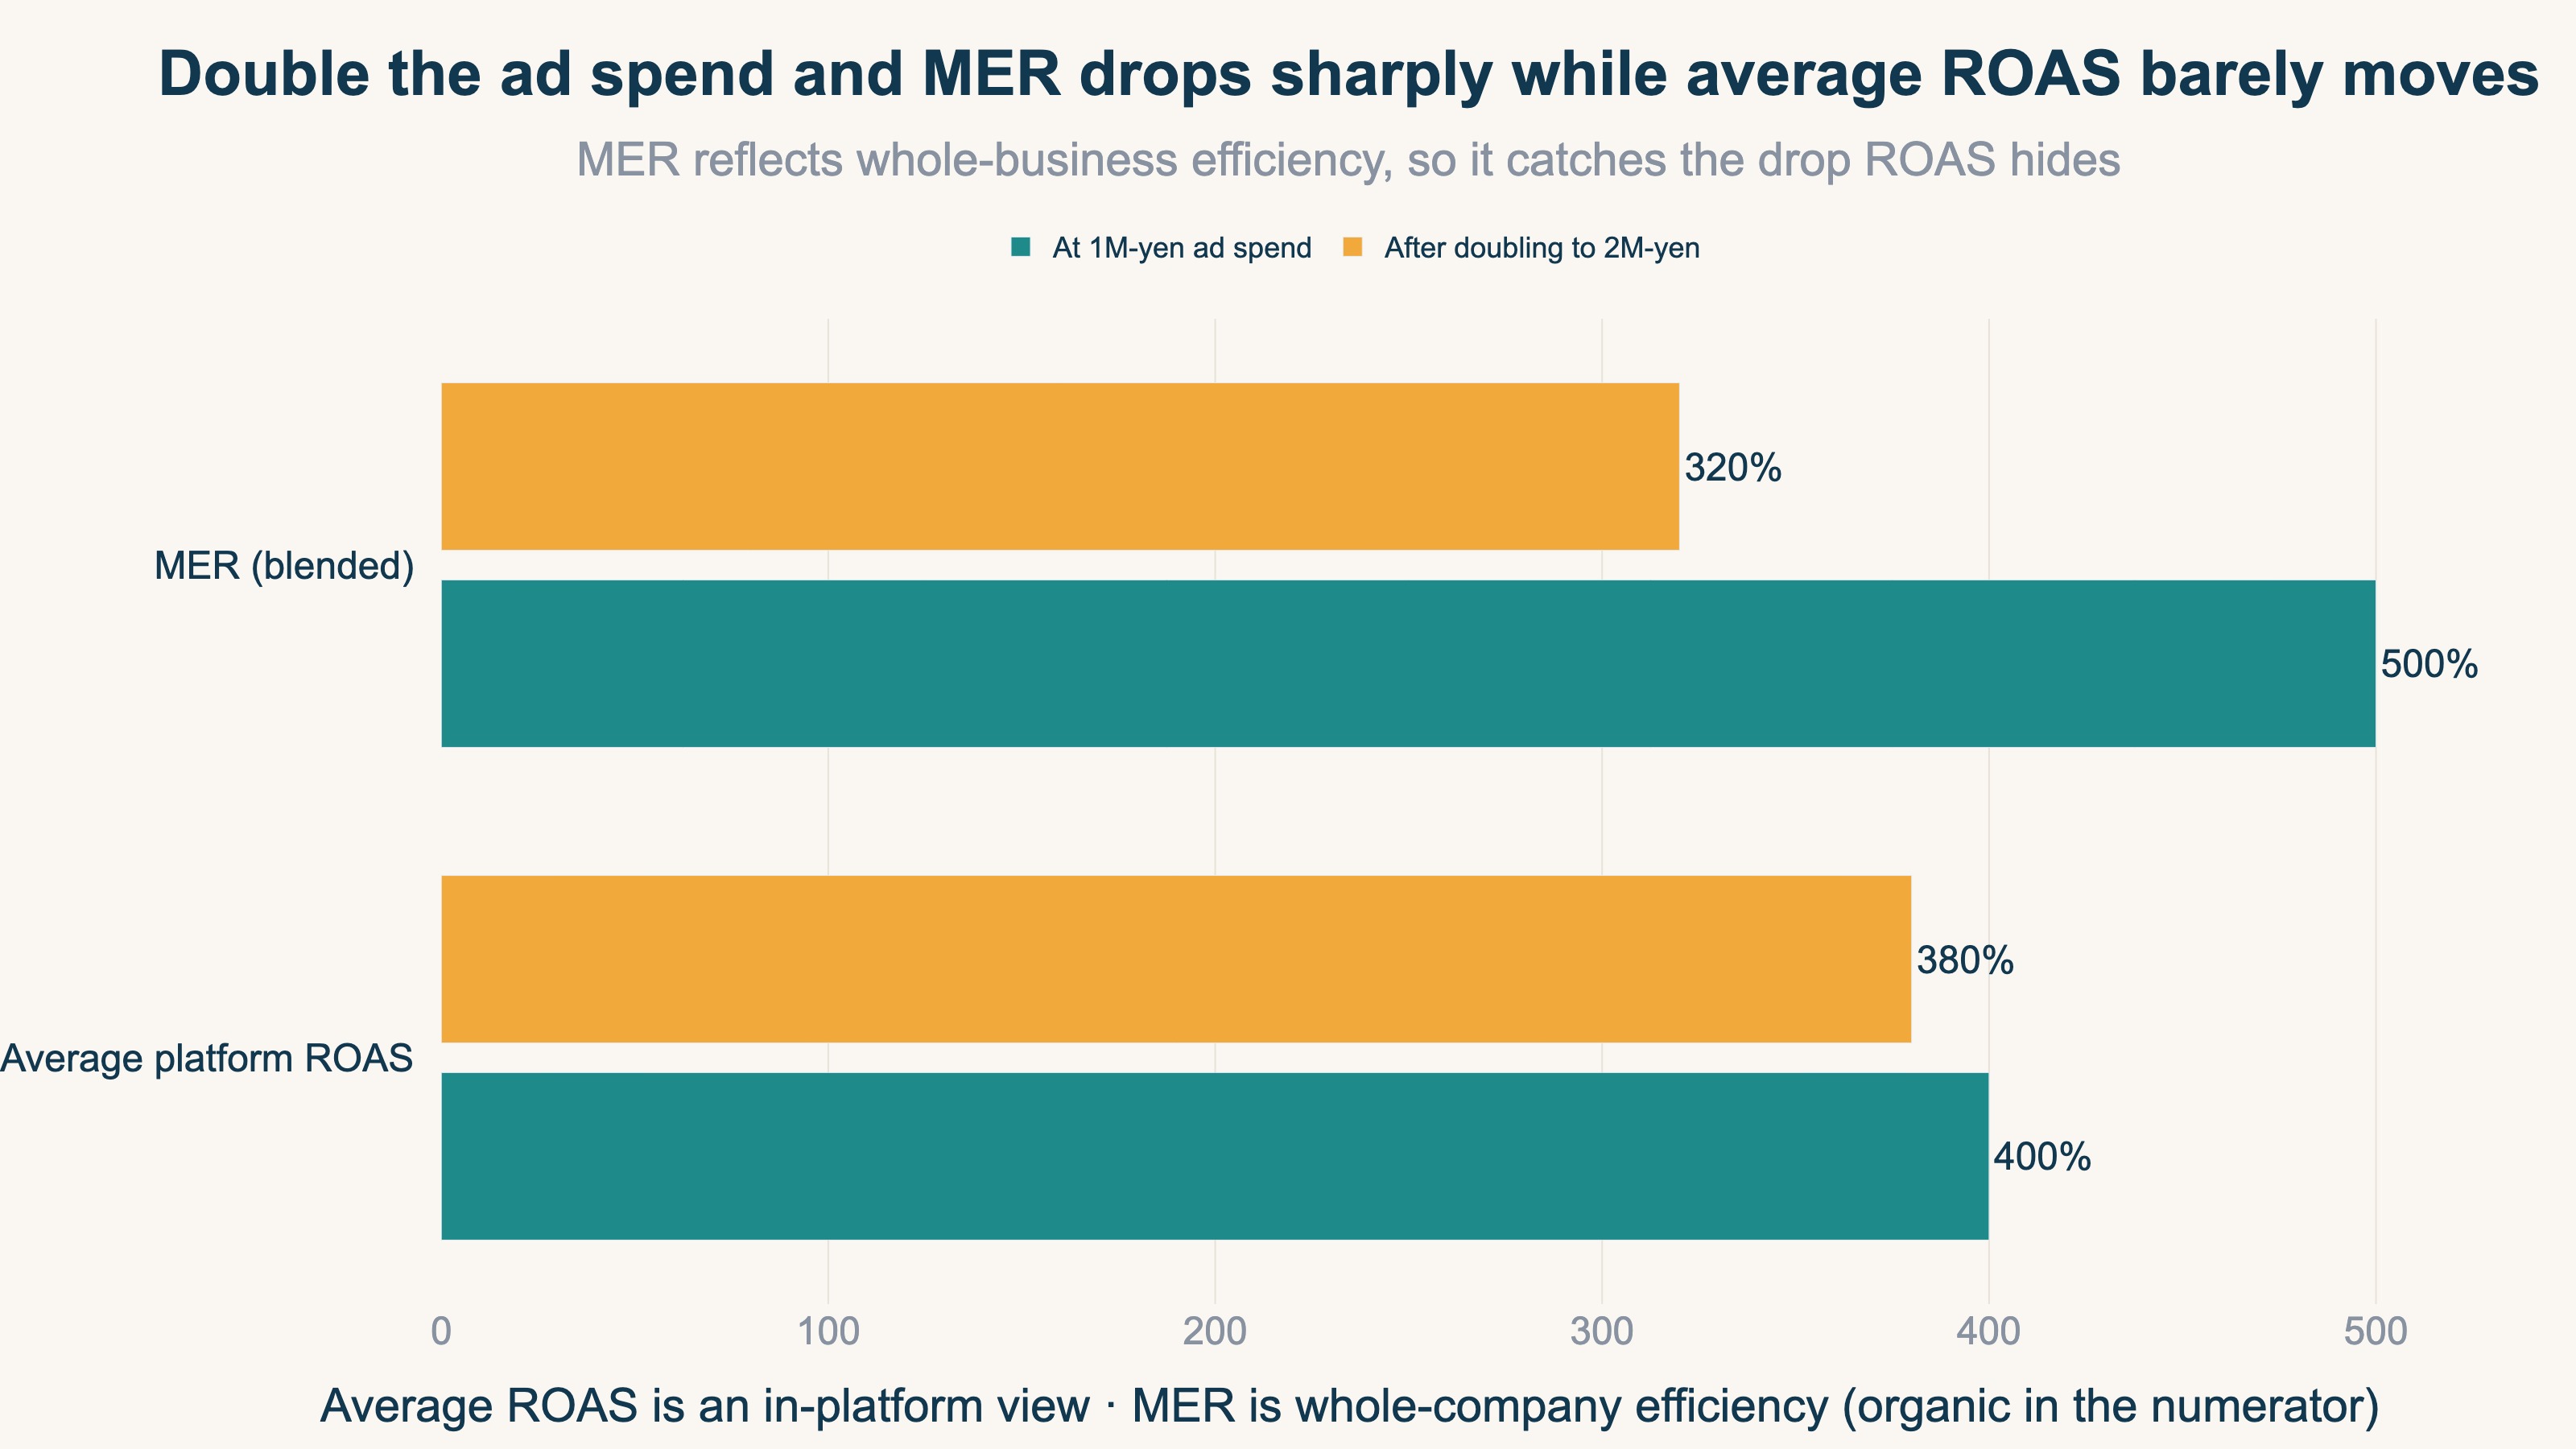
MER has another advantage. Because non-ad revenue — organic search, repeat buyers, word of mouth — also sits in the numerator, it reflects how total revenue moves when you change ad spend. If you double ad spend and MER drops, that added investment is lowering overall efficiency. That shift is hard to spot with ROAS, which only looks inside each channel.
If you want to see profit too, there is a "contribution-margin MER" that uses revenue minus cost of goods and shipping as the numerator. The margin-based view is covered in detail in Gross Margin Breakeven ROAS.
3. When to use ROAS versus MER#
Bottom line: refine inside channels with ROAS, set total spend with MER.
ROAS and MER are not a case of one being correct — they cover different scopes. Relying on only one misleads your decisions.
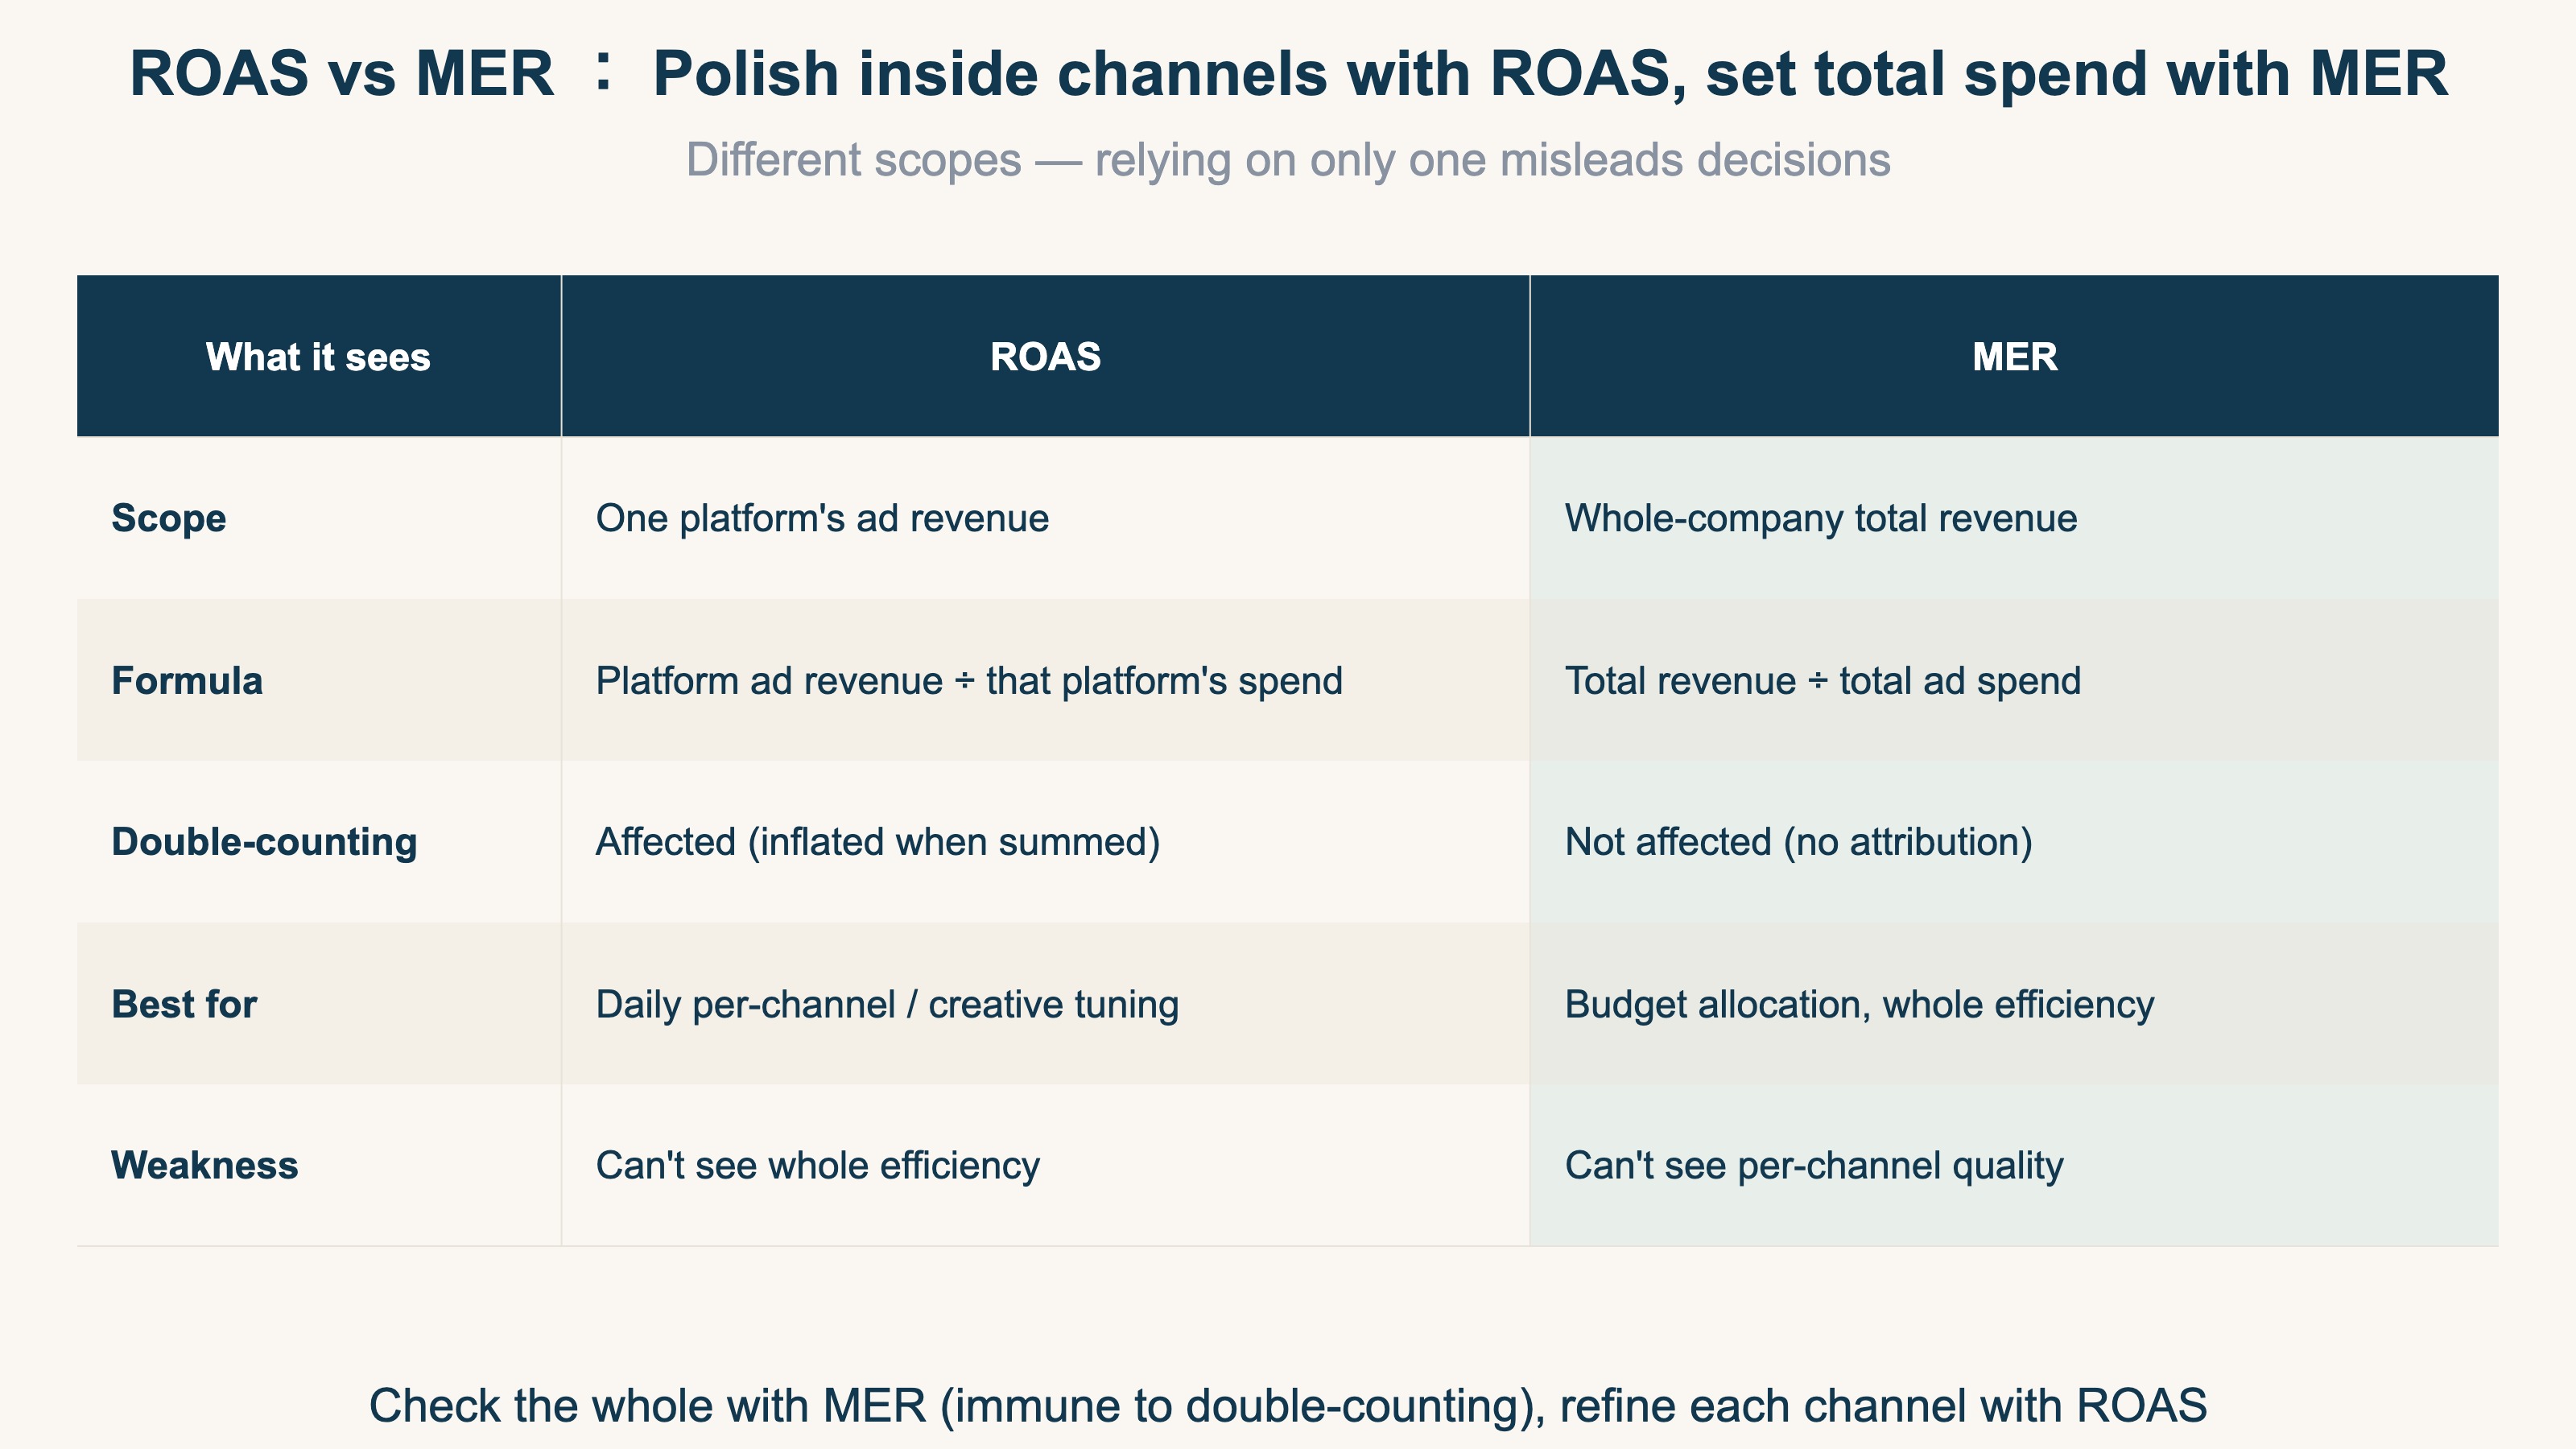
Where ROAS works
- Per-channel campaign tuning on Google Ads, Meta Ads, and the like
- Comparing which creative or which product's ads are performing
- Daily numbers you can act on right away
Where MER works
- Deciding how much of next month's budget goes to each channel
- Checking whether total business revenue actually grew when you raised ad spend
- Evaluating whole-company ad efficiency including organic and repeat revenue
In practice, refine inside channels with ROAS and decide total spend with MER — a two-layer approach. Chasing per-platform ROAS alone lets you miss the state where "overall efficiency is falling, yet each platform still looks healthy" because of double-counting.
4. What MER still hides about new and returning customers#
Bottom line: MER averages everything, so it erases the gap between channels that win new customers and channels that re-engage returning ones.
MER is convenient, but because it blends everything into one number, something disappears: whether revenue came from new or returning customers.
Ad platforms tend to push delivery toward whoever buys most cheaply. The cheapest buyers are usually "returning customers who would have come back anyway." So channels centered on returning buyers tend to show high apparent ROAS. By contrast, channels that reach new customers who don't know your product yet rarely convert on the spot, so their ROAS looks low.
If you cut a new-customer channel "because its ROAS is low," you close off the entry point for future repeat buyers with your own hands. So confirm overall efficiency with MER, but evaluate new-customer contribution separately — by channel, and split by new versus returning. With this two-layer view, you pick the channels truly worth protecting when budgets get tight. For a deeper look at the new-versus-returning gap by channel, see Splitting channel ROAS into new and returning.
5. AI-automated campaigns (P-Max) inflate platform ROAS even more#
Bottom line: "hands-off" AI campaigns like Google P-Max and Meta Advantage+ tend to absorb branded search (people already looking for your store) as their own result, making ROAS look higher than it really is.
In P-Max and Advantage+, the AI decides both placement and bidding automatically, and it pushes delivery toward "wherever results are cheapest." That destination is often branded search — people typing your store's name, who have already decided to buy. They would have bought from organic search even without the ad. When an AI-run ad overlaps that audience, it counts revenue that "would have happened anyway" as its own, and ROAS shows up at, say, 600% — while total store revenue (MER) stays flat.
The root cause is the same double counting as in section 1, but it is harder to see here, because where the AI delivered and why the number came out that way are opaque to the operator. If you raise the budget just because "ROAS went up," you may simply be buying more of the same branded-search harvest, with no real new customers. Two checks help: is ROAS high while overall store revenue (MER) is not moving, and can you separate branded-search (your store name) from everything else? Re-measured on new-customer efficiency excluding branded terms, a high AI-driven ROAS often looks very different.
RevenueScope solution
Platform ROAS getting inflated, and MER blending away the new-versus-returning split, share one root: "which channel actually created which revenue" is only visible through each platform's self-report.
RevenueScope replaces that self-reported variance with one common yardstick from its own tracking. Rather than the inflated figures each platform claims separately, it aligns every channel by where the buyer last came from (Last-touch), strips out duplicates and bots (automated non-user traffic), and lines up the de-duplicated real revenue on one screen. That ends the cross-platform double-counting. And the attribution basis is not limited to Last-touch: you can switch to First-touch, Linear, and Time-decay and compare how the weighting shifts on the same screen. Revenue that ties to no channel is shown honestly, as a single "unattributed" line rather than hidden.
On top of that, if you connect per-channel ad spend, the same screen can return per-channel ROAS and saturation (whether spending more is unlikely to move the needle). Enter your ad spend, and your actual measured revenue and ROAS sit on one ruler. What RevenueScope handles is aligning the numerator of MER (total revenue ÷ total ad spend) — your total revenue and its per-channel split — on one consistent basis. With a trustworthy numerator in hand, computing MER is just dividing by total ad spend. Redoing this de-duplication, bot exclusion, and model comparison across every channel each month in GA4 is heavy manual work — the idea isn't hard, but the repetition is. That is where RevenueScope fits.
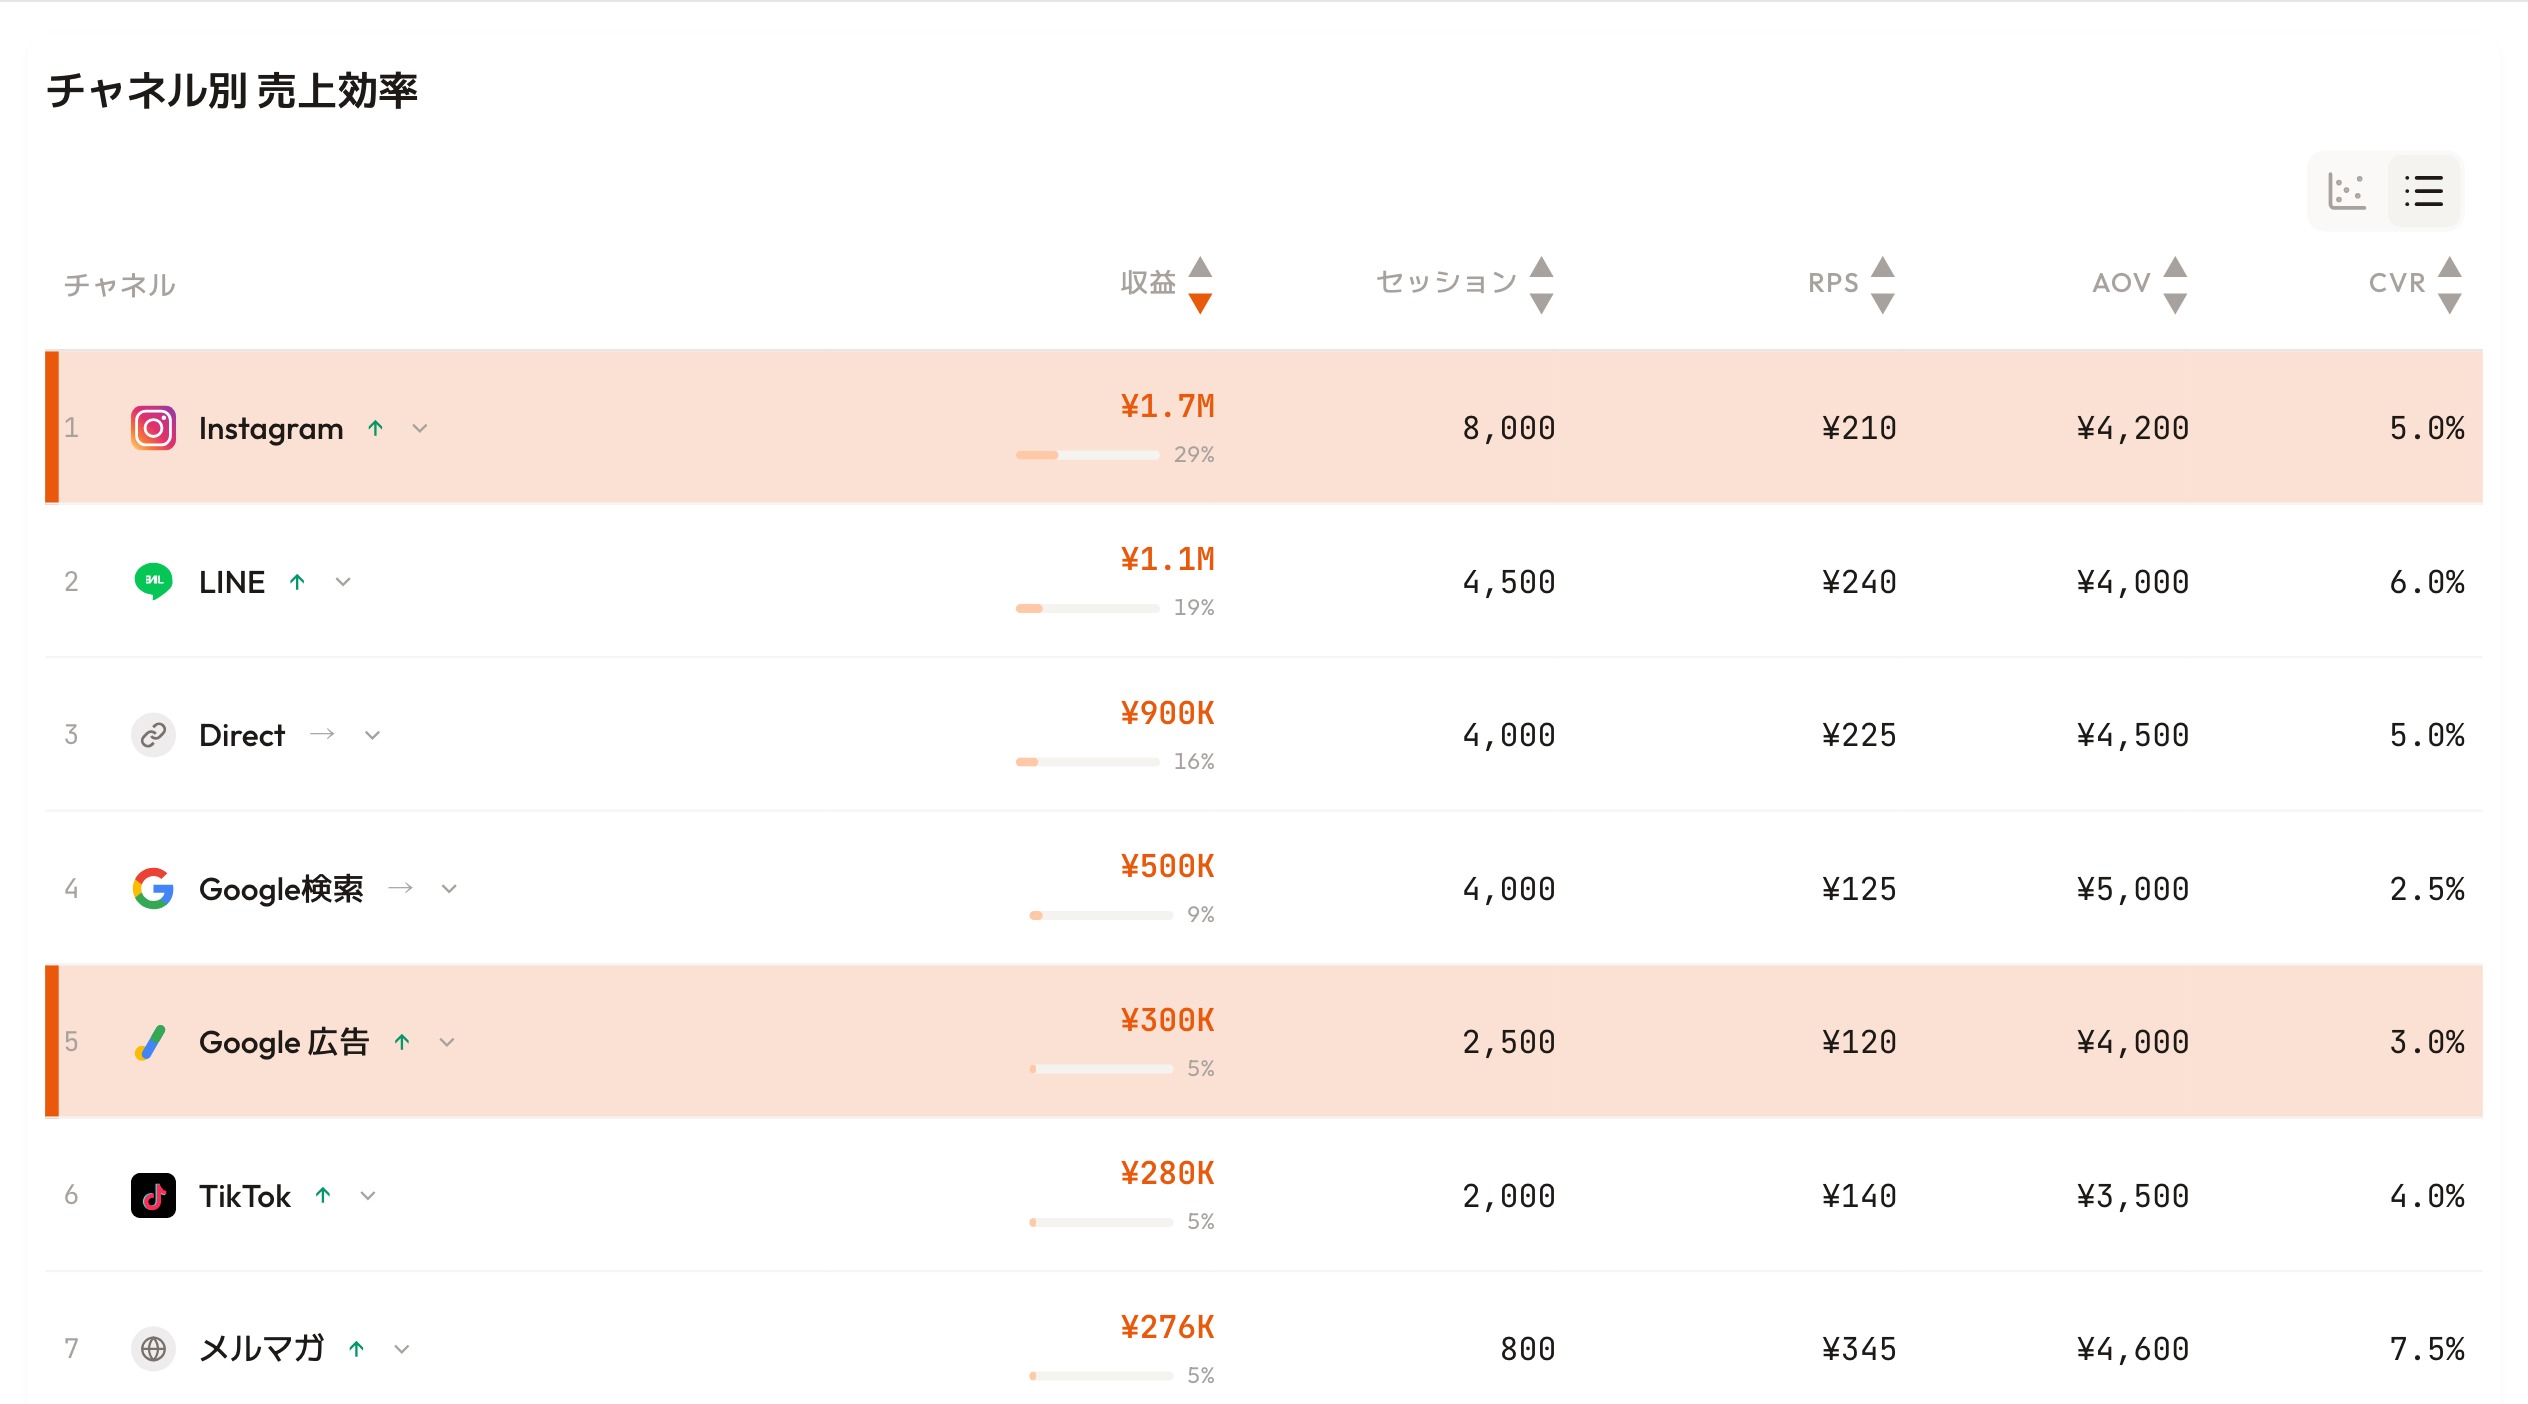
RevenueScope dashboard (demo data shown). Every channel is lined up on one Last-touch yardstick, removing cross-platform double-counting.
The screen above is sorted by revenue. Instagram has the largest revenue at ¥1.7M, yet its RPS (revenue per session) is a mid-pack ¥210, while Google Ads sits at ¥300K and RPS ¥120. Each platform's own dashboard claims "the revenue I drove," so summing the platform ROAS of the ad channels double-counts the same purchases and overstates actual ad-driven revenue. Because this screen lines up every channel on one common yardstick (Last-touch RPS), you compare real revenue instead of inflated figures. The email newsletter — small in revenue but topping every channel at RPS ¥345 — makes the point plain: revenue size and efficiency are two different things, and that gap is exactly the starting point for looking at the whole picture with MER.
That said, Last-touch has its own weakness. Because revenue leans toward the channel that made the final push, on its own it understates the contribution of new-customer acquisition. So RevenueScope backs it up with two independent lenses. One compares RPS (revenue per session) by channel to weigh how efficient each inflow source is. The other splits revenue, RPS, AOV, and CVR by new versus returning customers. The first shows "which channel is efficient," the second shows "whether that revenue is a new customer or a returning one." Read together, they let you separate out "channels with high apparent ROAS that are really just skewed toward returning customers."
Switch the attribution basis, surface unattributed revenue instead of hiding it, strip out bots, and compare channel-level RPS — that is where RevenueScope earns its keep. See whole-business efficiency and new-customer contribution from the same starting point, instead of being swayed by each platform's self-report. How to run this whole-channel efficiency review every month is laid out in The monthly channel-efficiency review. That is the next step.
FAQ#
Q. Should MER or ROAS be my main KPI?
A. The realistic answer is to give them separate roles. Use ROAS for per-channel optimization, and MER for monthly budget allocation and whole-efficiency decisions. With only one, ROAS alone overstates the whole through double-counting, while MER alone hides the quality of individual channels.
Q. Why shouldn't I sum platform ROAS?
A. Because each platform counts the same purchase as its own result. If one customer touches both a Meta ad and a Google ad before buying, both record it as "my revenue." Summing them exceeds actual ad-driven revenue by exactly that overlap.
Q. Is there a benchmark number for MER?
A. There is no universal target, because it varies widely by industry, gross margin, and ad dependence. What matters is the change, not the absolute value. If MER drops when you raise ad spend, that added investment is lowering overall efficiency. Compare against your own past MER, before and after a change.
Conclusion#
Because each platform double-counts the same purchase, summing per-platform ROAS overstates your total ad result. MER (total revenue ÷ total ad spend) measures whole-business efficiency in one number and is immune to that double-counting. Refining inside channels with ROAS and setting total spend with MER is the basic two-layer approach that keeps ad-budget decisions honest.
MER is not all-powerful, though: it averages away the gap between channels that win new customers and channels that re-engage returning ones. As a first step, calculate MER from your own total revenue and total ad spend, then split channel revenue by new versus returning. "Which channels are truly worth protecting" becomes a decision you can make with concrete numbers.
See which ads actually drive revenue, at a glance
Free up to 5,000 sessions/month, AI analyst included. No credit card required. Up and running in 5 minutes.
References#
- Google Ads "About attribution models" 2024
- Shopify "Marketing Efficiency Ratio: How To Calculate + Improve MER" 2026
- Shopify "Return on Ad Spend: How To Calculate Your ROAS" 2026