When someone reports "our ad ROI was 300% last month," do you know whether that's ROAS 300% or actual profit-based ROI 300%? At a 30% gross margin, ROAS 300% barely breaks even — and profit ROI is essentially zero. This guide clarifies the formula difference, when to use each metric, and the three ways EC operators mix them up.
Table of Contents
TL;DR#
-
ROAS = Ad revenue ÷ Ad spend × 100 (%). ROI = Profit ÷ Investment × 100 (%)
The numerator — revenue vs profit — is the key difference. ROAS measures ad efficiency; ROI measures investment return
-
ROAS 300% can still be a loss
At 30% gross margin, breakeven ROAS is 333%. ROAS 300% is in the red. Profit ROI is around −10%
-
In EC practice: ROAS for ad optimization, ROI for investment decisions
Campaign-level PDCA → ROAS / Full investment decisions including labor and production → ROI
-
When someone says "ROI 300%," always ask for the definition
ROAS and ROI formulas look similar, so they get used interchangeably in the same meeting
1. ROAS vs ROI: the formula difference#
Key point: Revenue or profit as the numerator produces completely different numbers.
ROAS and ROI both measure "how much came back from ad spend or investment," but the numerator is different.
ROAS (%) = Ad-driven revenue ÷ Ad spend × 100
ROI  (%) = Profit (gross margin etc.) ÷ Investment × 100
ROAS numerator: revenue (before deducting cost of goods or ad spend). ROI numerator: profit (after deducting costs). Similar in shape, completely different in meaning.
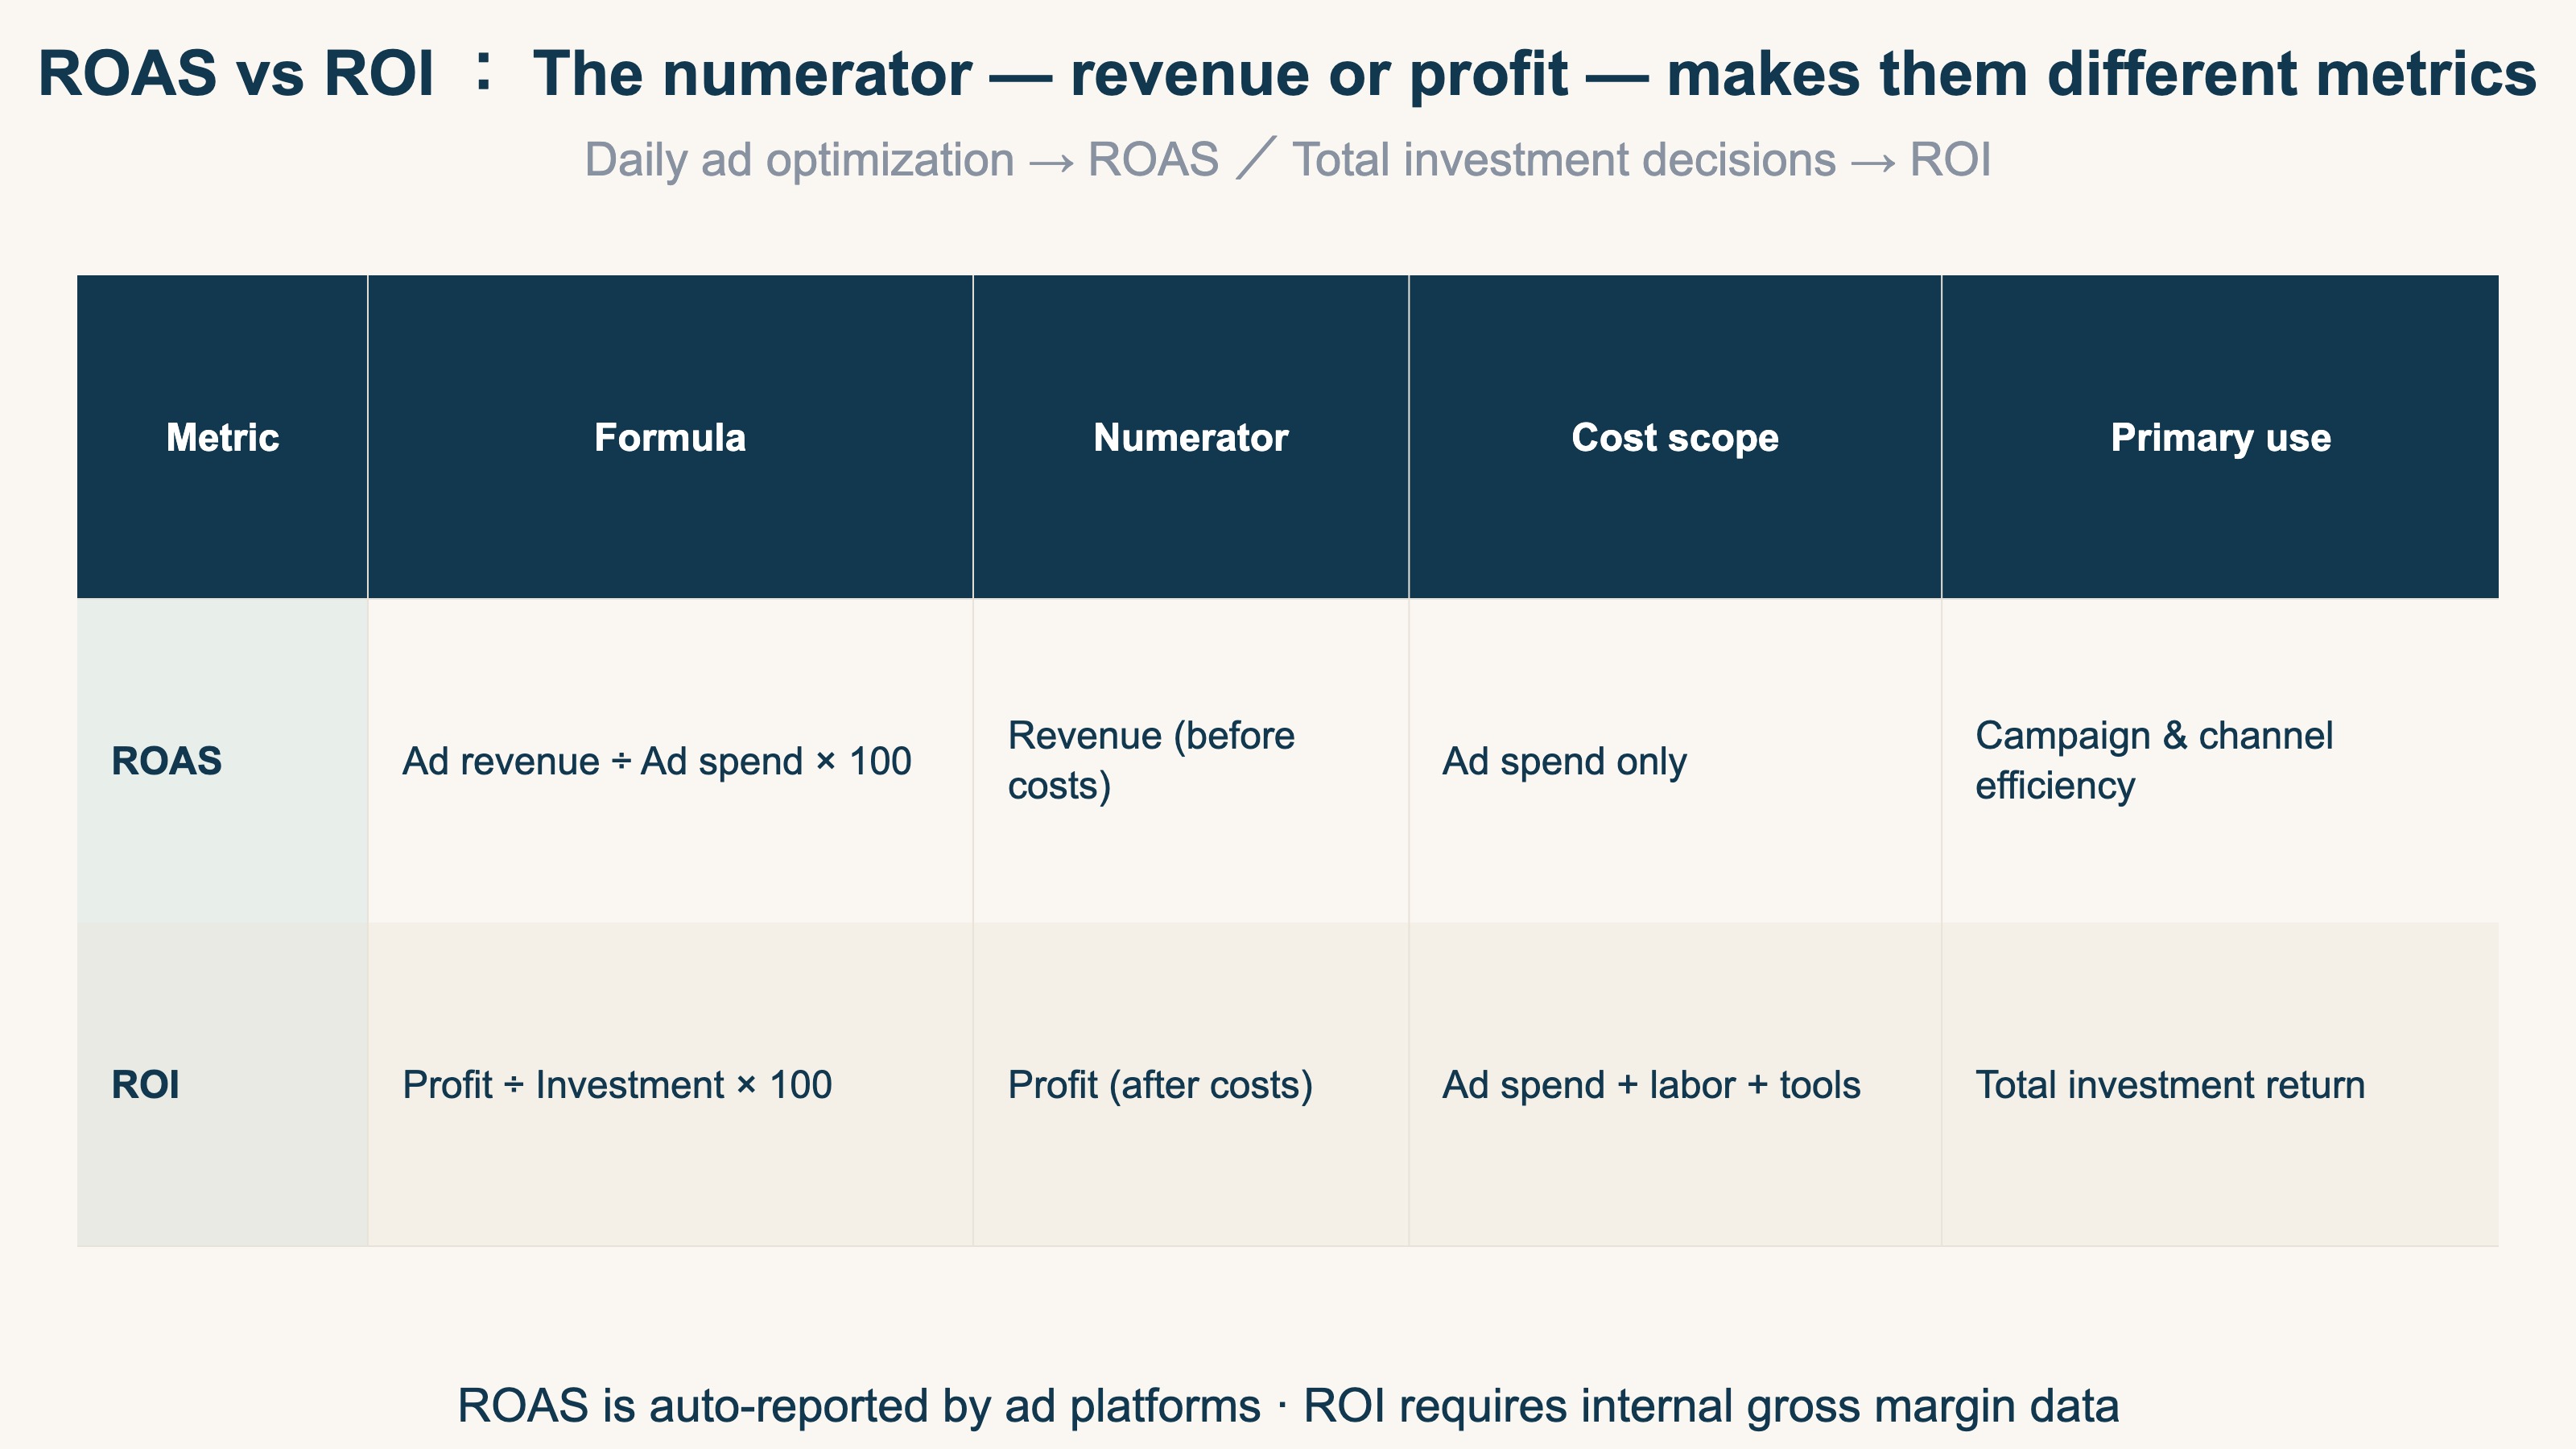
The investment scope is also different. ROAS covers ad spend only. ROI can cover ad spend plus labor costs, production fees, and tools — the full investment picture.
ROAS closely matches what ad platforms auto-report, making it the default for daily operations. ROI fits financial decisions and budget planning.
2. What happens when you confuse them#
Key point: ROAS 300% doesn't mean profit. Without factoring in gross margin, your judgment runs backwards.
When "ROI 300%" circulates in a team report, it's often the ROAS number relabeled as ROI. Here are the typical judgment errors this causes.
Error ①: Treating ROAS 300% as proof of profitability
At 30% gross margin:
- Ad spend ¥100K, revenue ¥300K (ROAS 300%)
- Cost of goods ¥210K (70% COGS rate)
- Gross profit ¥90K − ad spend ¥100K = ¥10K loss
ROAS 300% is still a loss. Profit ROI (gross margin basis) is −11%. Treating ROAS as ROI leads to increasing budget on a losing campaign.
Error ②: Missing high-ROI non-ad channels
ROAS only covers paid advertising. Organic search, direct traffic, and social organic efficiency (measured as RPS) are invisible to ROAS. Without an ROI lens across all channels, you might label a low-ROAS-but-low-cost channel as "no results" when it's actually your most profitable source.
3. When to use ROAS and when to use ROI#
Key point: Daily ad optimization → ROAS. Investment allocation and budget reviews → ROI.
When to use ROAS
- Daily PDCA on Google Ads, Meta Ads, and other campaign-level work
- Comparing efficiency across channels, products, or creatives
- Ongoing KPI monitoring in monthly ad reports
Ad platforms auto-report ROAS in real time, making it easy to act on daily. The trap: without gross margin context, "high ROAS" doesn't guarantee profit.
When to use ROI
- Evaluating overall marketing investment including labor and production costs
- Budget allocation decisions: paid ads vs organic vs PR for next quarter
- New channel investment decisions (influencer, events, content)
ROI requires internal profit data that ad platforms don't provide, making it better suited to quarterly or annual investment decisions rather than day-to-day optimization.
4. Three common mix-up patterns in EC practice#
Key point: Similar-looking formulas make it easy for different definitions to mix in the same conversation.
Pattern ①: Using the word "ROI" to mean ROAS
When Google Ads reports "cost efficiency," that number is ROAS. Calling it "ROI" in internal reports means making investment decisions without factoring in gross margin or labor. The fix: define whether you mean "ROAS (ad revenue ÷ ad spend)" or "ROI (profit ÷ total investment)" before any budget discussion.
Pattern ②: ROAS and ROI coexisting in the same document
When an agency report shows "ROAS 350% / ROI 25%," the former is ad revenue vs ad spend and the latter is gross profit vs total investment — different denominators and numerators. Focusing on the larger number without understanding the distinction misrepresents actual profitability.
Pattern ③: Setting only a ROAS target
Maintaining "ROAS 300%" as a monthly KPI works until gross margin changes — same ROAS, different profit. For EC stores with variable product mix or cost structures, add a "breakeven ROAS (= 1 ÷ gross margin × 100)" reference alongside any ROAS target. It closes the gap between ROAS performance and actual ROI.
RevenueScope solution
The root cause of ROAS/ROI confusion is an information gap: revenue is visible in real time, but channel-level profit is not.
RevenueScope tracks RPS (revenue per session) across all channels in real time — including organic search and direct traffic that ROAS ignores. You can compare the revenue efficiency of every channel in one screen, preventing the "judge everything by ad ROAS and miss the rest" mistake.
Channel RPS, combined with your gross margin, lets you calculate channel-level profit contribution: RPS × gross margin = contribution per session. That's the starting point for a true cross-channel ROI view — the next step beyond ROAS-only measurement.
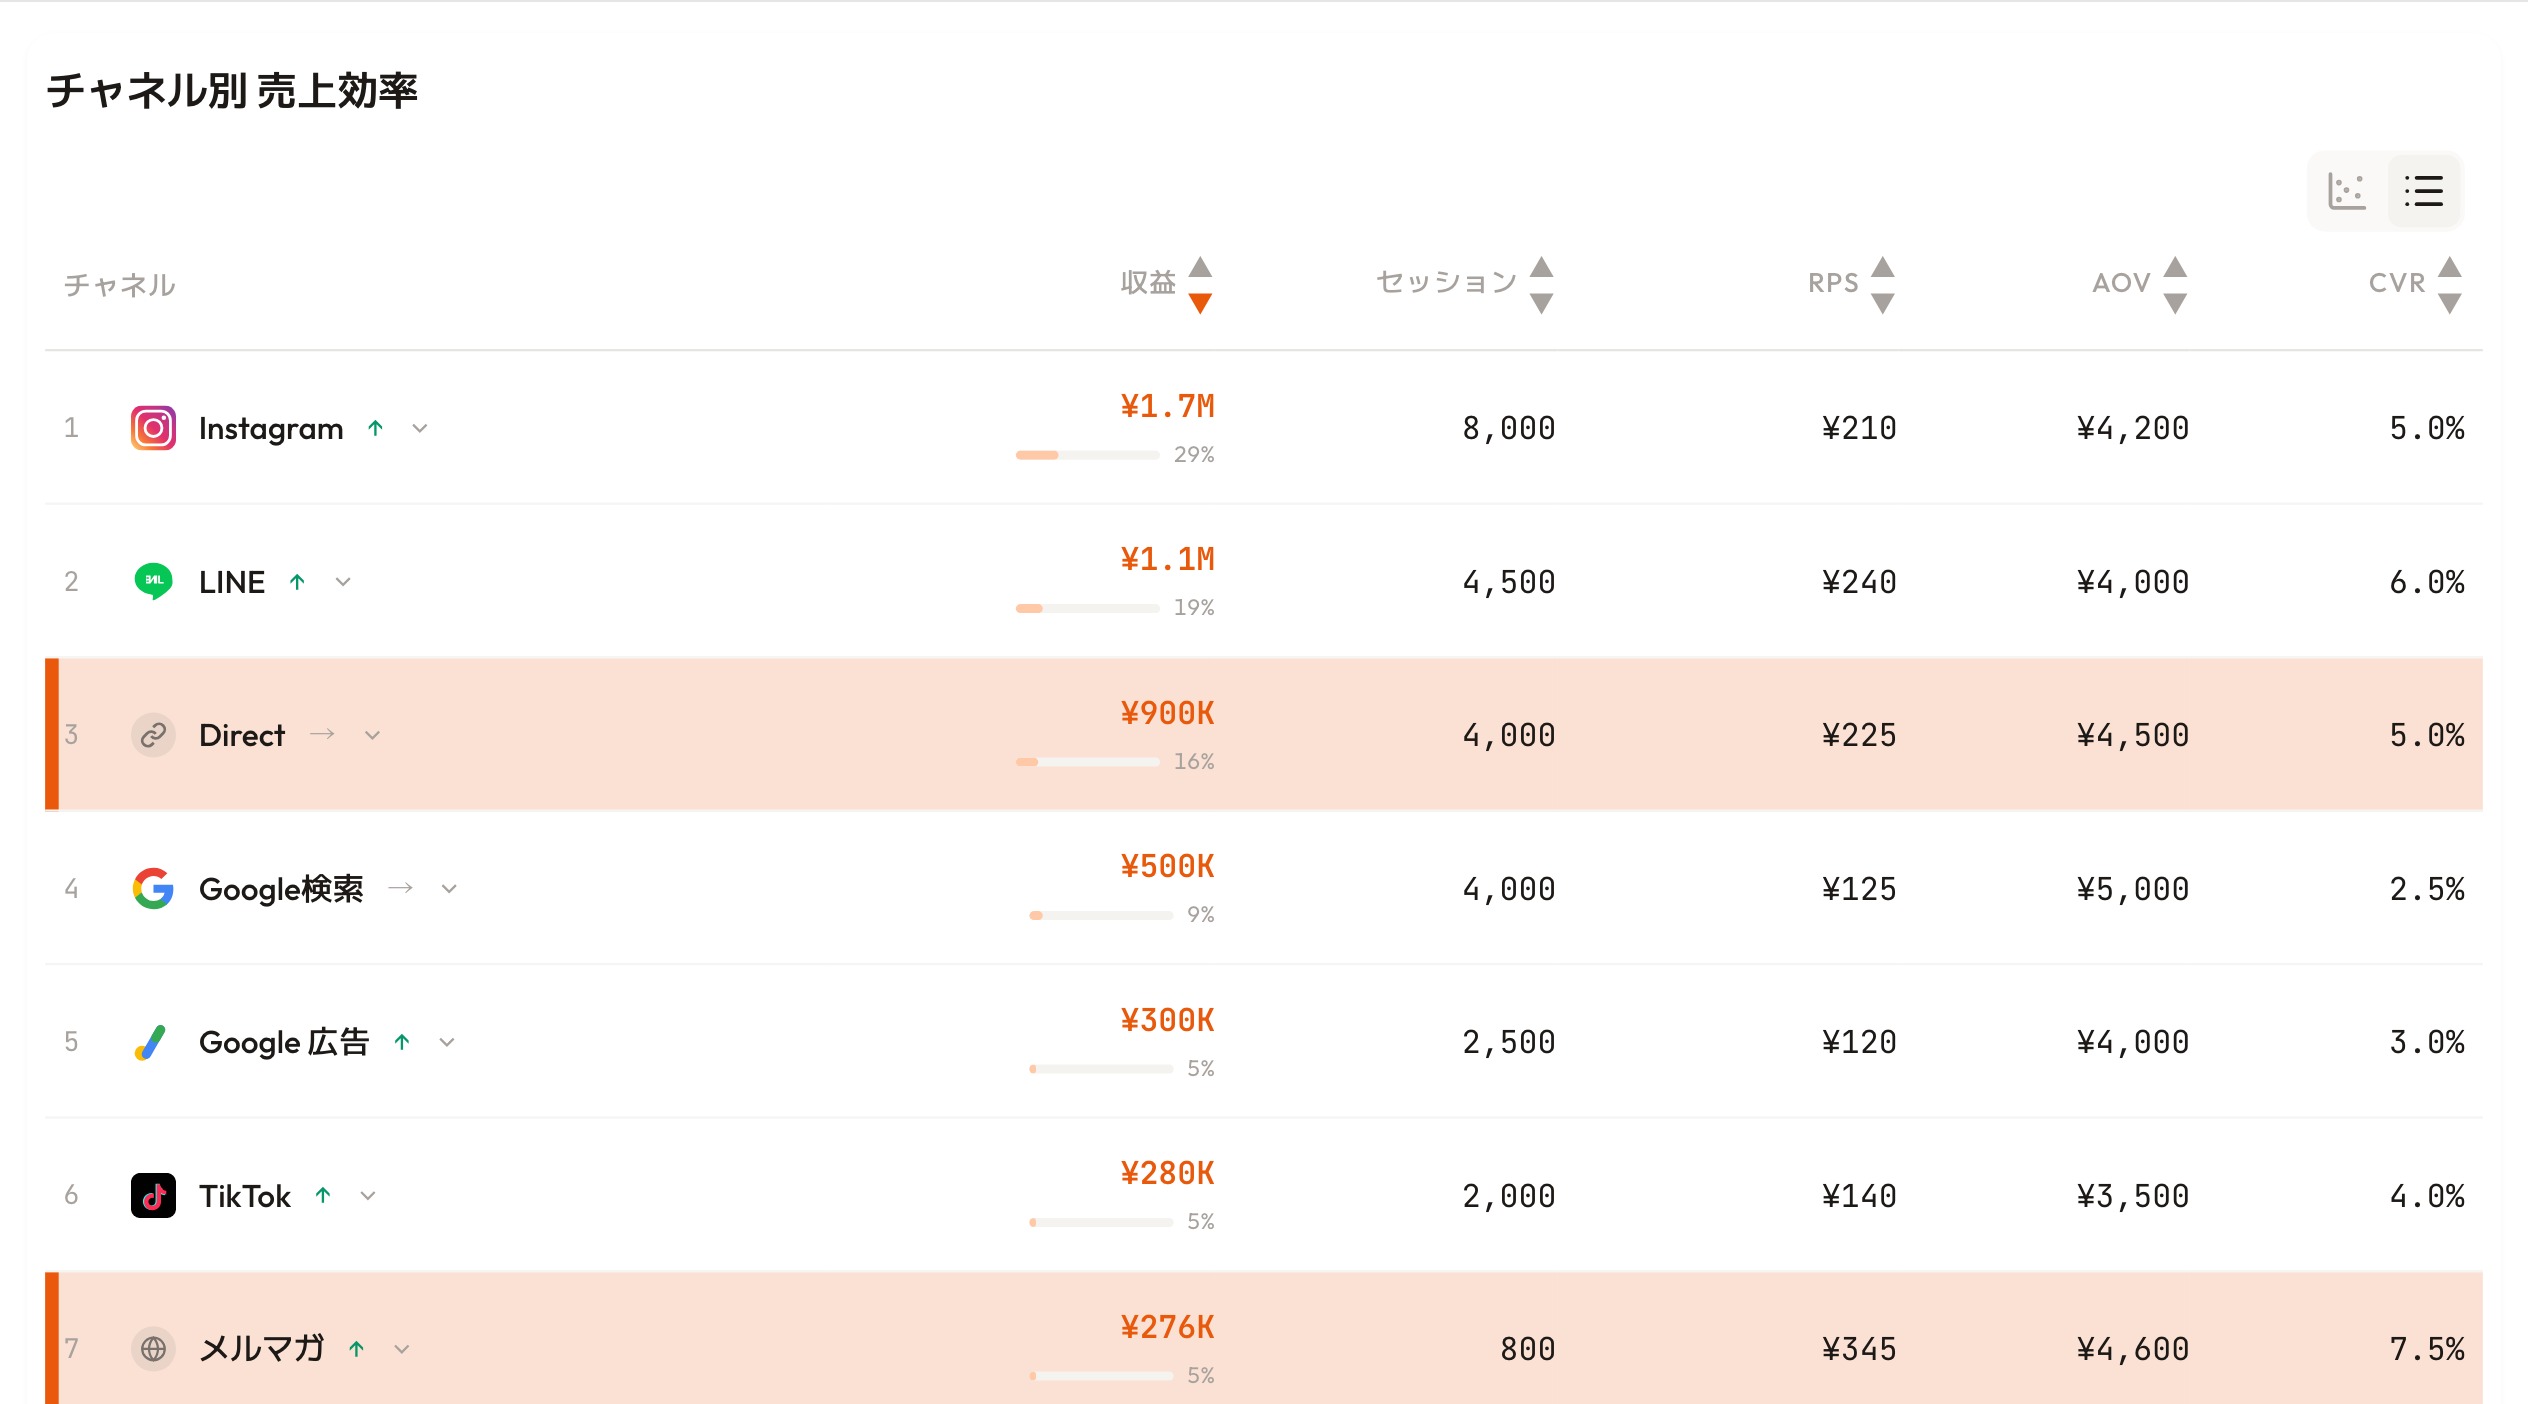
RevenueScope dashboard (demo data shown). The revenue efficiency of organic and direct traffic — which ROAS never sees — lines up on the same yardstick.
In the screen above, alongside the ad channels ROAS watches (Instagram at RPS ¥210, Google Ads at RPS ¥120), it also lines up the channels ROAS ignores: Direct (RPS ¥225) and the email newsletter (RPS ¥345). ROAS only reflects ad-driven revenue, but lining up RPS across every channel shows which one earns the most per session. Multiply each channel's RPS by your gross margin and you get contribution per channel — the starting point for ROI. Judge by revenue efficiency × margin across all channels, not by ROAS alone. That is how you avoid the mix-up.
FAQ#
Q. Should I start with ROAS or ROI?
A. Start with ROAS. Ad platforms report it automatically, so you can act on it right away. Once ad efficiency is stable, layer in ROI by adding labor and production costs to get a full investment picture.
Q. How do I know if ROAS 300% is profitable?
A. Calculate breakeven ROAS: 1 ÷ gross margin × 100. At 30% gross margin, that's 333%. ROAS 300% falls below it — a loss. Make breakeven ROAS a standing reference on every ad report.
Q. What counts as "investment" in an ROI calculation?
A. It depends on scope. Ad ROI: ad spend only. Full marketing ROI: ad spend + production costs + allocated labor hours. Always compare ROI figures calculated on the same scope — mixing scopes makes the numbers meaningless.
Q. Where can I track ROAS?
A. Google Ads and Meta Ads report it natively. GA4 can show channel-level revenue with ecommerce tracking enabled. For a single view comparing ad channel efficiency against organic, direct, and other channels, a tool like RevenueScope provides that cross-channel revenue-per-session baseline.
Conclusion#
ROAS and ROI share a similar formula shape but differ in what the numerator measures — revenue vs profit — and how broad the investment scope is. Use ROAS for daily ad optimization; use ROI for total investment decisions. The practical starting point: calculate your breakeven ROAS from your gross margin rate. Once you have that number, "is ROAS 300% profitable?" becomes a concrete, answerable question.
See which ads actually drive revenue, at a glance
Free up to 5,000 sessions/month, AI analyst included. No credit card required. Up and running in 5 minutes.
References#
- Google Ads Help 「About Target ROAS bidding」2024
- Wikipedia 「Return on investment」2024
- HubSpot 「What Is ROAS? How to Calculate Return on Ad Spend」2024