"So which ads actually worked last month?" If you run an EC store, you've probably opened several dashboards before the monthly budget meeting trying to answer this. The numbers are all there, yet you can't decide where to lean next month — usually because you're only looking at one month's size.
The bottom line: what you should see at a budget meeting is each channel's efficiency compared month over month. Staring at last month's revenue or clicks alone won't tell you whether a channel rose or fell, so you can't set next month's allocation. Only by comparing the same channel between two months ago and last month do the working ads separate from the fading ones.
This guide covers why you should read month over month at a budget meeting, a five-minute three-step prep before the meeting, why repeating it by hand every month is heavy, and a way to fold that effort onto one screen — from an EC operator's practical perspective.
Contents
In short#
-
Read month over month, not a single month
Last month's revenue or clicks alone don't tell you whether a channel rose or fell. Only by comparing the same channel across two months can you see which ads worked.
-
Line up three things before the meeting
Align the periods to last month and the prior month / split by channel / exclude bots and unattributed traffic. These three give you month-over-month channel efficiency.
-
The heavy part is repeating it every month
The thinking is simple. What's hard is realigning every channel on the same basis each month — and GA4 has no standard view that lines up month-over-month channel efficiency on one screen.
1. Read month over month, not a single month#
Bottom line: to set budget allocation, you need to compare each channel's efficiency month over month.
What you want at the monthly budget meeting is to decide which channels to lean into next month and which to pull back. For that, you need to know how each channel moved last month — whether it rose or fell versus the prior month. No matter how long you stare at last month's figures alone, you can't tell whether their size is "baseline scale" or "last month's growth."
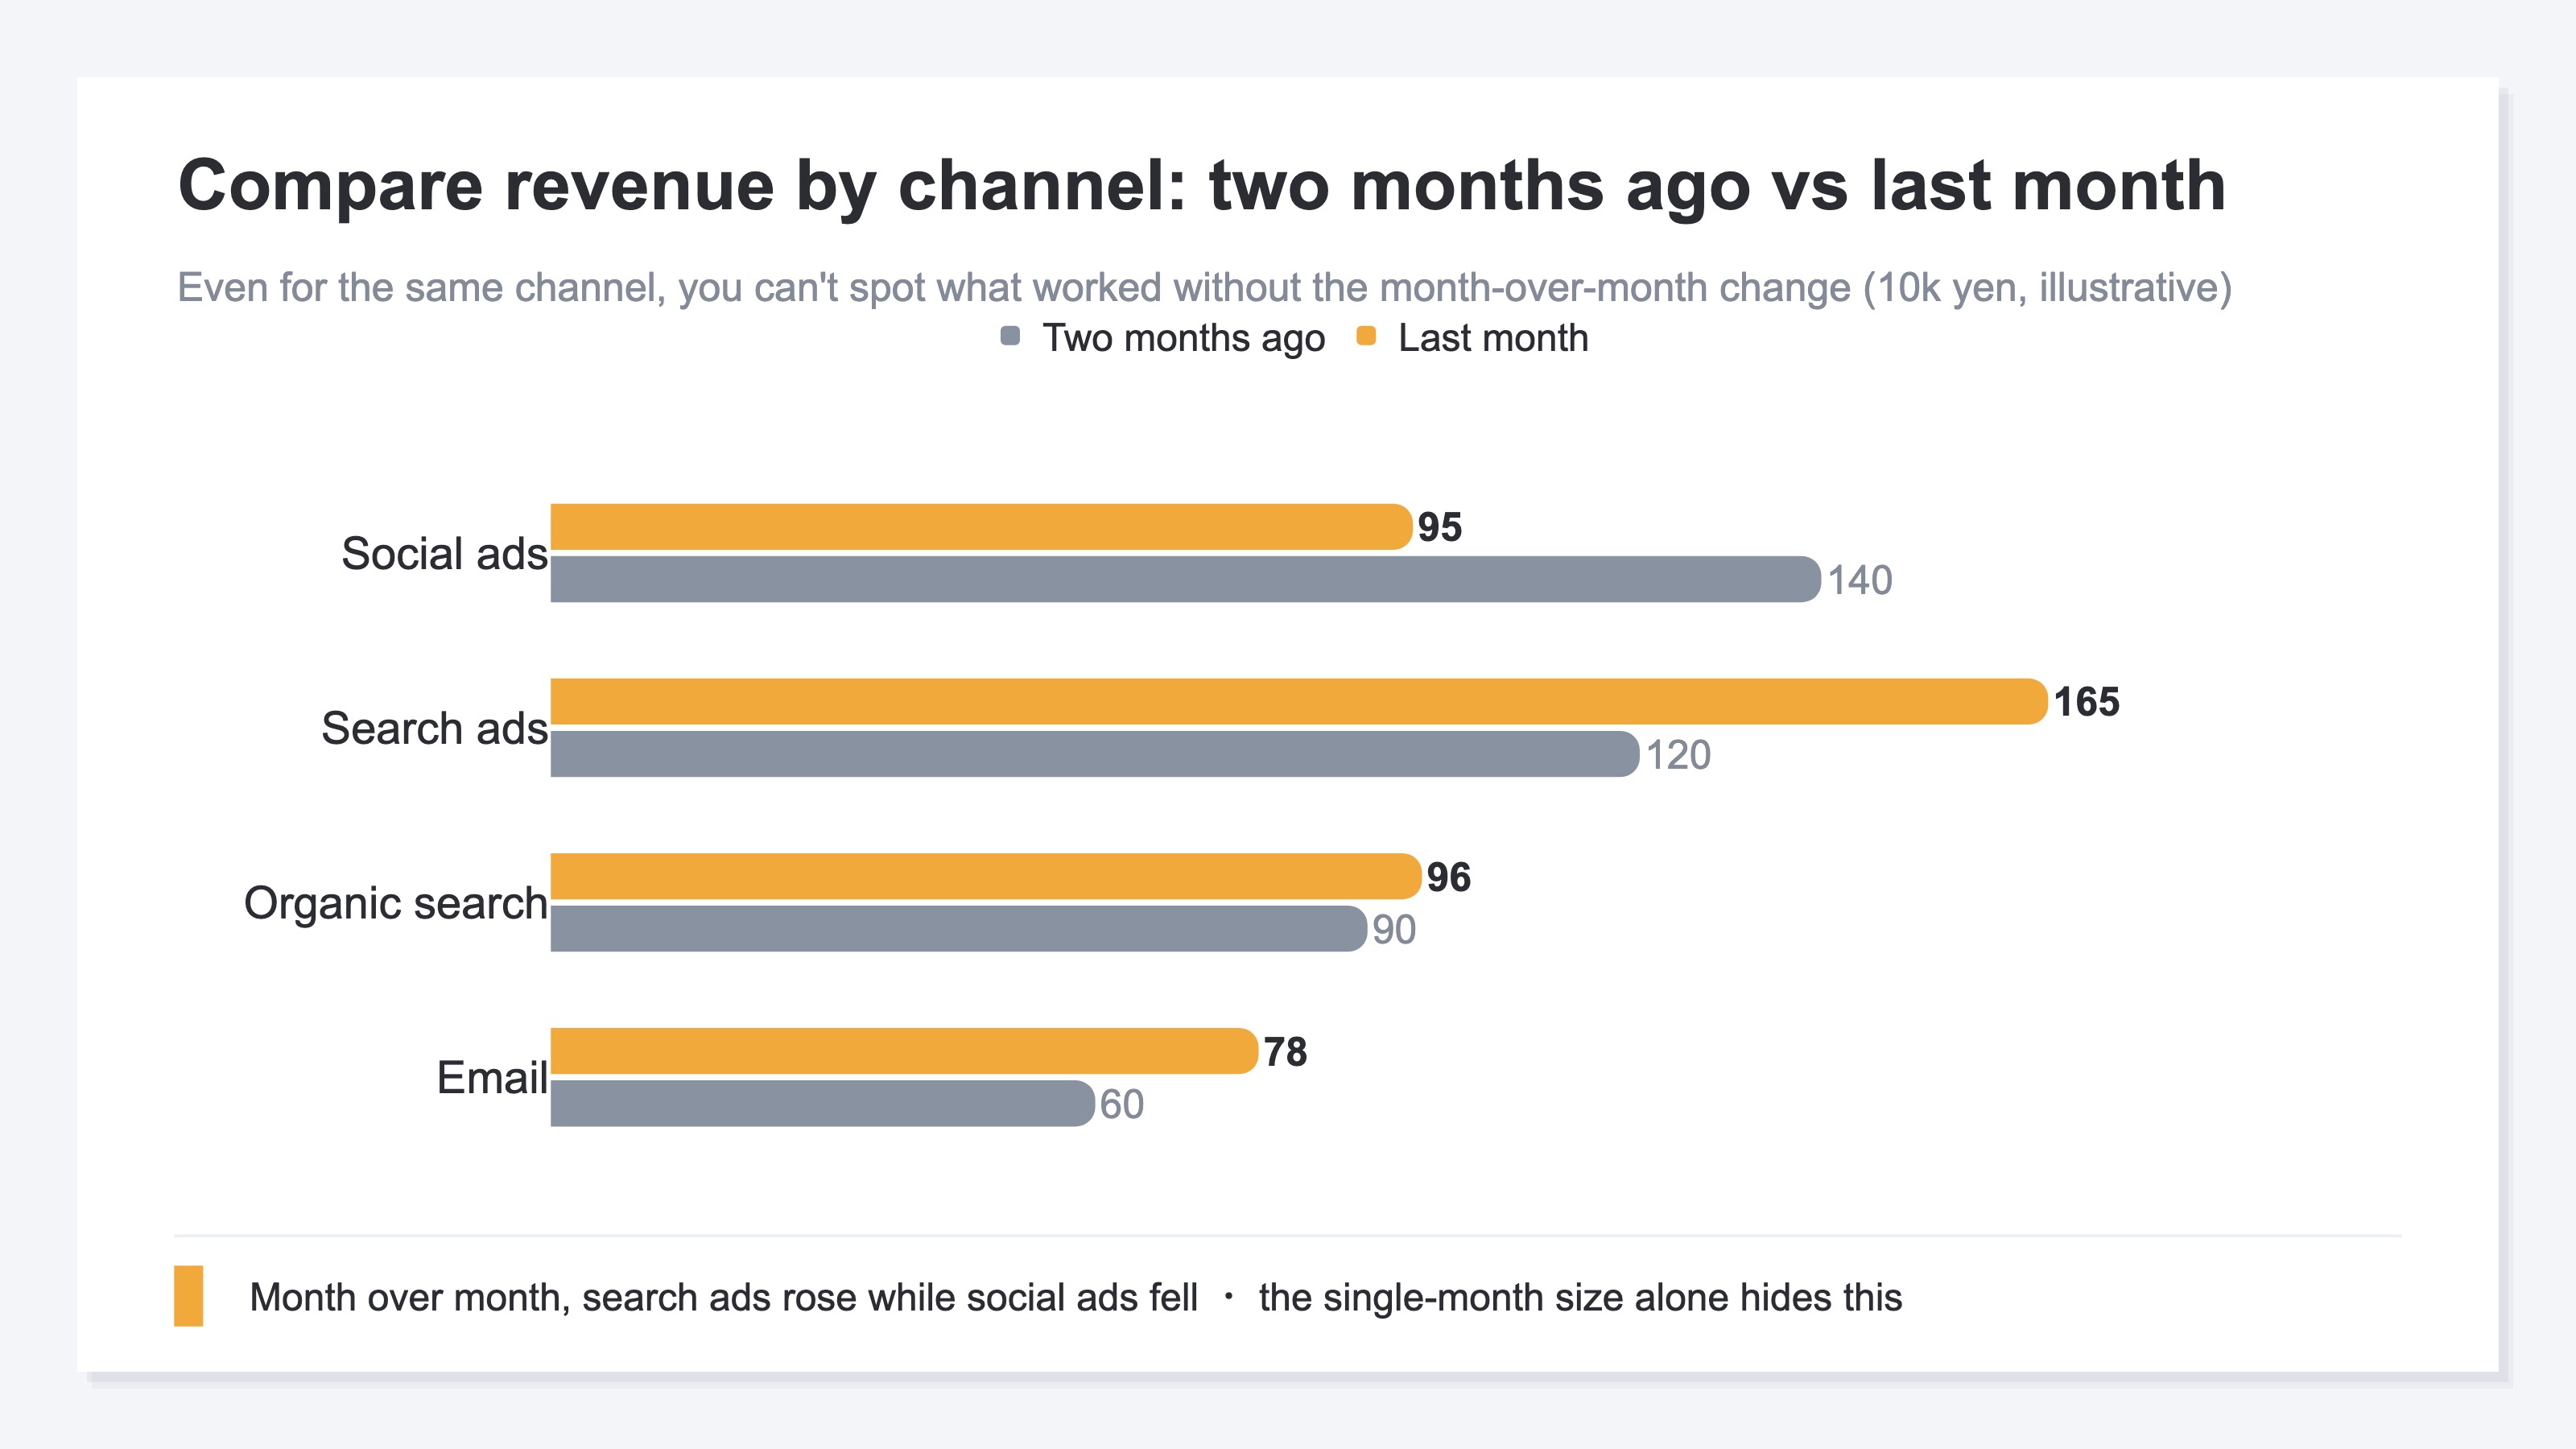
Say last month's revenue was 0.95M yen for social ads and 1.65M yen for search ads. By the single month, search ads are larger, so they look strong. But versus the prior month, search ads rose from 1.2M to 1.65M, while social ads fell from 1.4M to 0.95M. Only month over month does it become clear that search is growing and social needs attention. Lean budget on the single-month size, and you may add spend to a channel that is actually declining.
1.1 Two lenses: revenue and acquisition#
Month over month reads more reliably through two lenses: "revenue" and "acquisition."
- Revenue lens: read revenue by channel, or revenue per session (RPS), month over month to judge whether efficiency rose or fell. The thinking behind revenue per session is in RPS Basics — Measuring Channel Quality by Revenue.
- Acquisition lens: read sessions by channel month over month to see whether reach itself grew or fell. The approach for comparing channels without ad spend (email, organic search) on the same basis is in How to Measure Non-Ad Channel Efficiency: RPS, Not ROAS.
Keeping these two lenses apart helps you avoid confusing "revenue fell but acquisition grew (improve quality)" with "acquisition fell (add exposure)."
2. A five-minute three-step prep before the meeting#
Bottom line: month-over-month channel efficiency comes from three steps — align periods, split by channel, exclude bots.
The thinking itself is simple. Before the meeting, line up your data in this order, and you'll be ready to discuss which channels worked month over month.
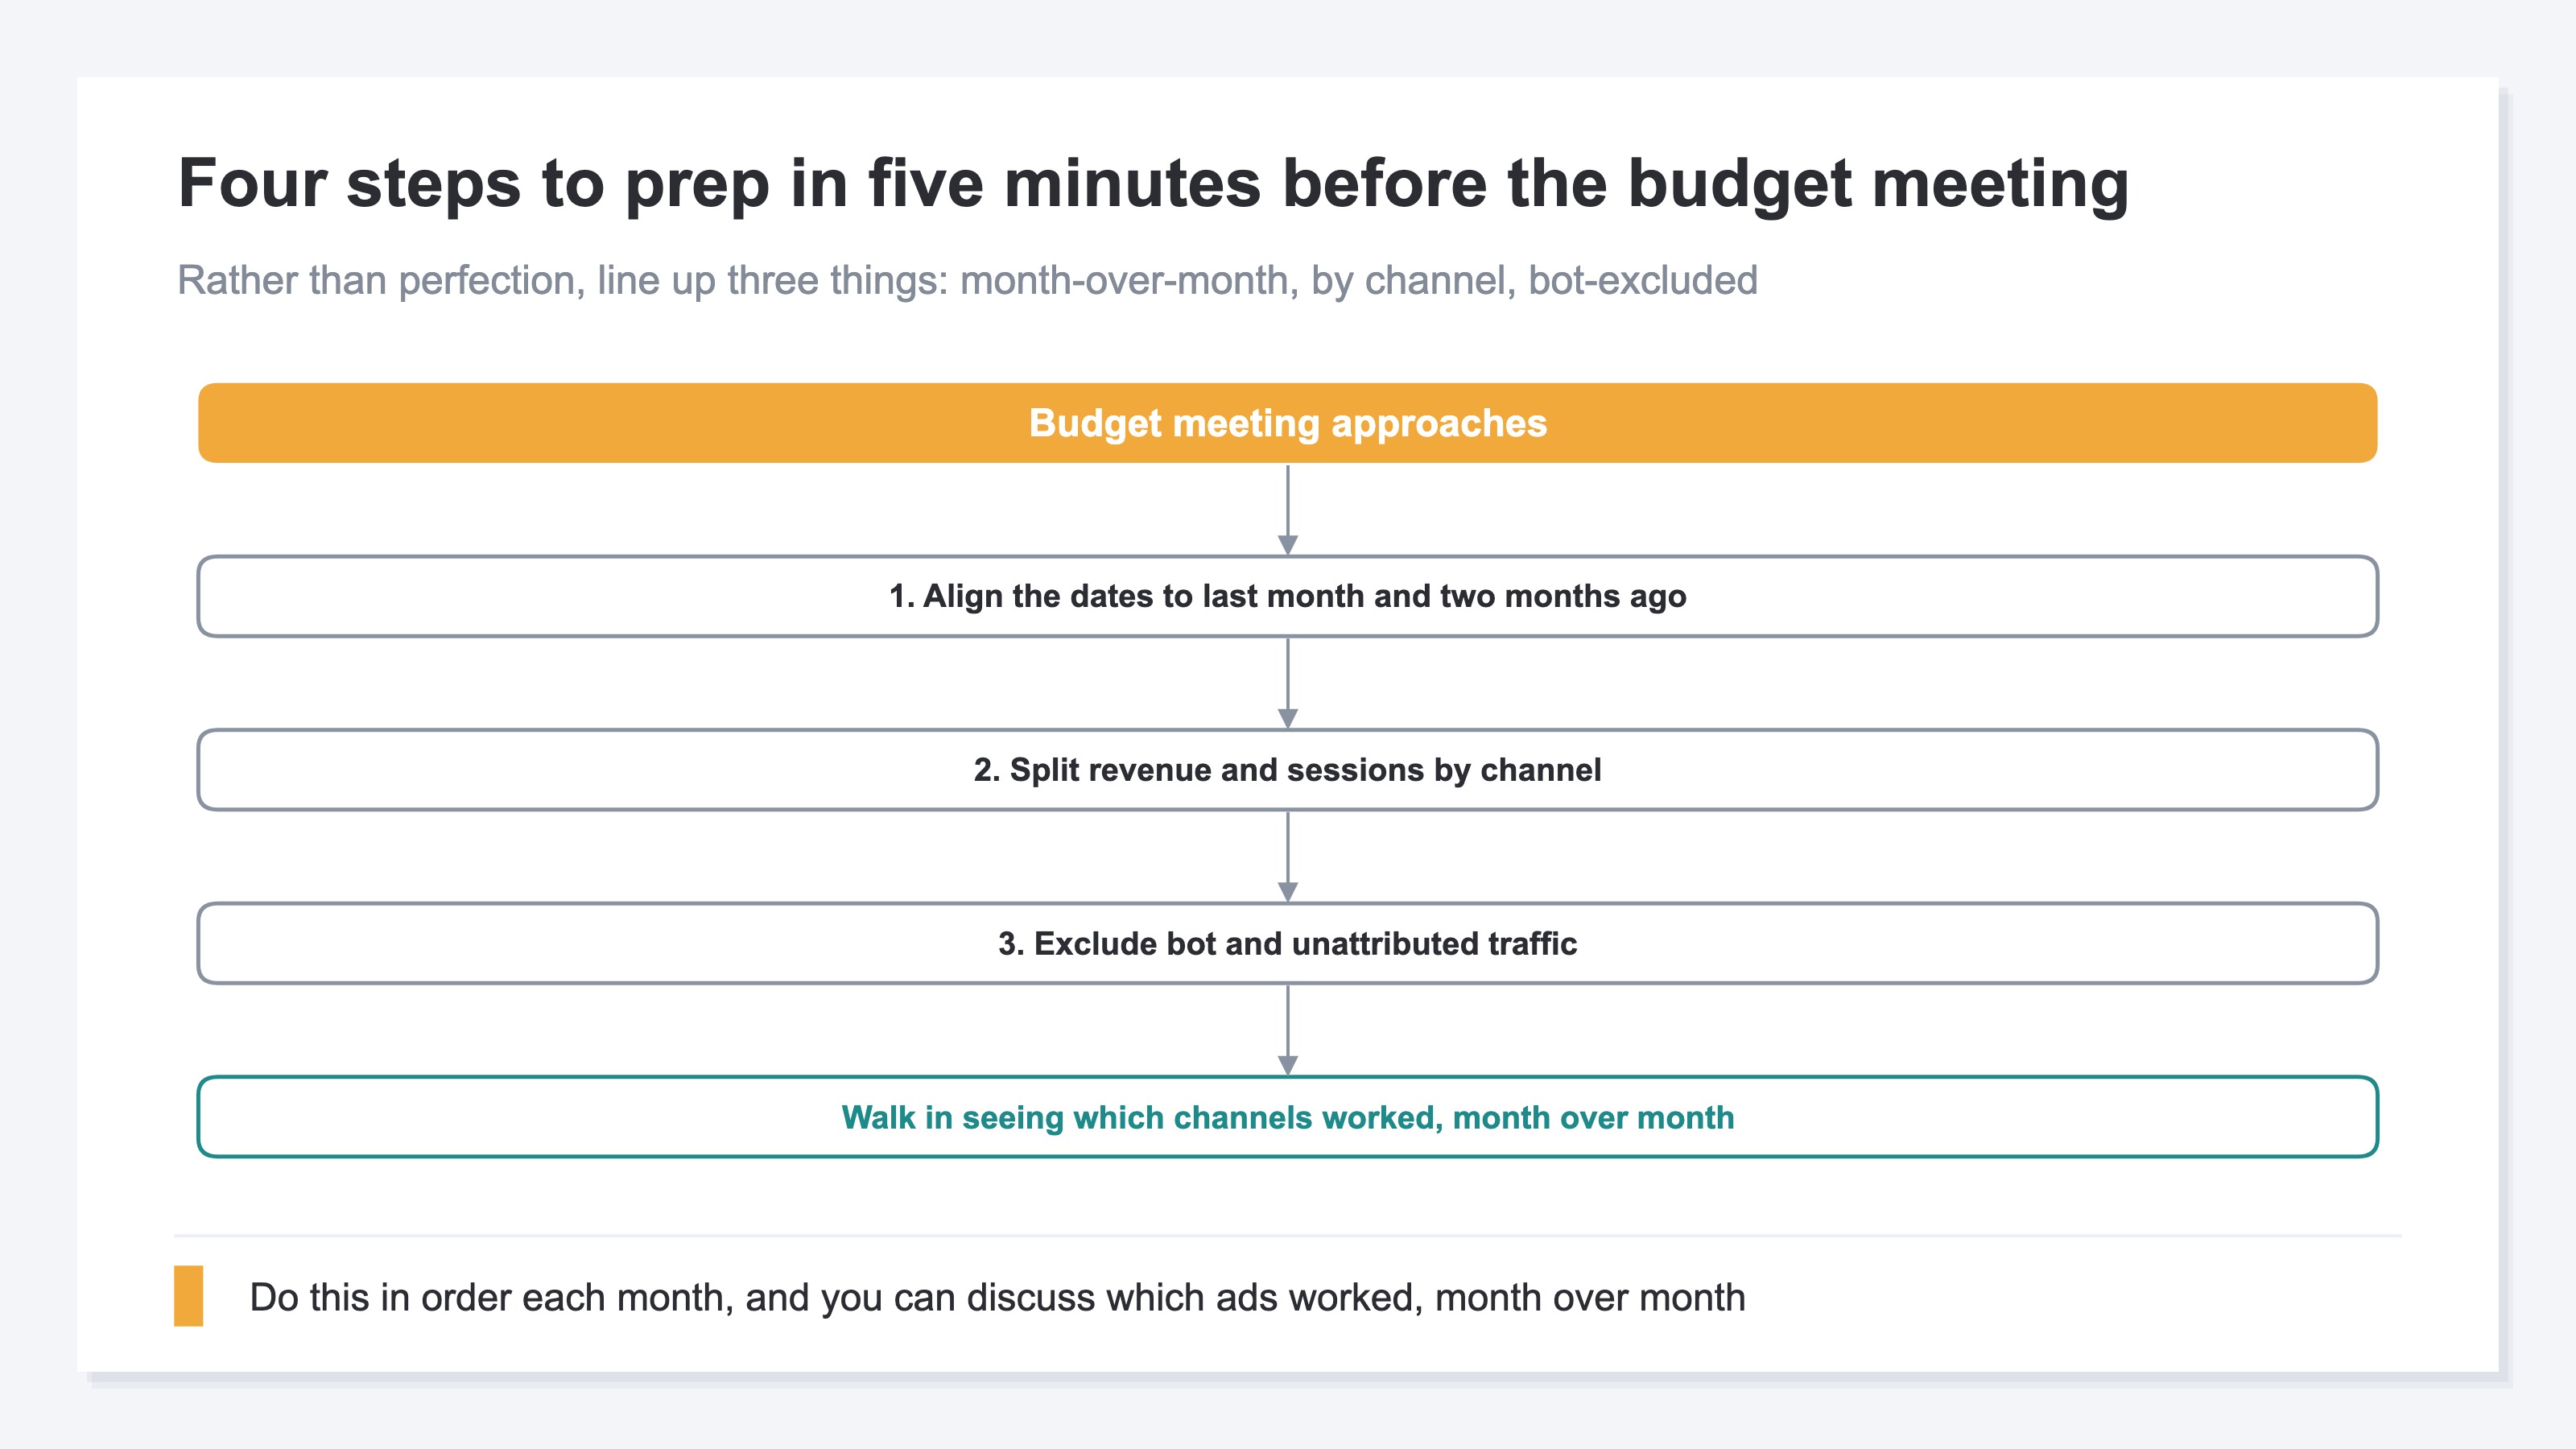
- Align the periods to last month and the prior month: the basis for comparison. If you don't match the same number of days and the same cut, the difference in month length alone makes the numbers wobble.
- Split revenue and sessions by channel: standardize how channels are grouped and put both revenue and acquisition side by side. The channel classification builds on GA4's default channel group[1].
- Exclude bots and unattributed traffic: separate out bot impressions and clicks, and traffic that slipped into Direct with no clear source. Leave them in, and efficiency looks better (or worse) than reality[2].
With these three lined up, two months ago and last month sit side by side by channel, and the month-over-month change becomes readable. Correctly splitting which ad a visit came from also rests on how you tag UTMs[3]. The correct way to set UTMs is in The Correct Way to Use UTM Parameters.
2.1 A note on using channel-level ROAS alongside#
If you only look at ad channels, you can add channel-level ROAS to month-over-month revenue. But unless ROAS is on a consistent basis across platforms, it isn't comparable. The approach for setting channel-level ROAS targets is in How to Set ROAS Targets by Channel, and the difference from a blended view is in MER vs Platform ROAS: Reading Overall and Per-Channel Efficiency Apart.
3. Why repeating it by hand every month is heavy#
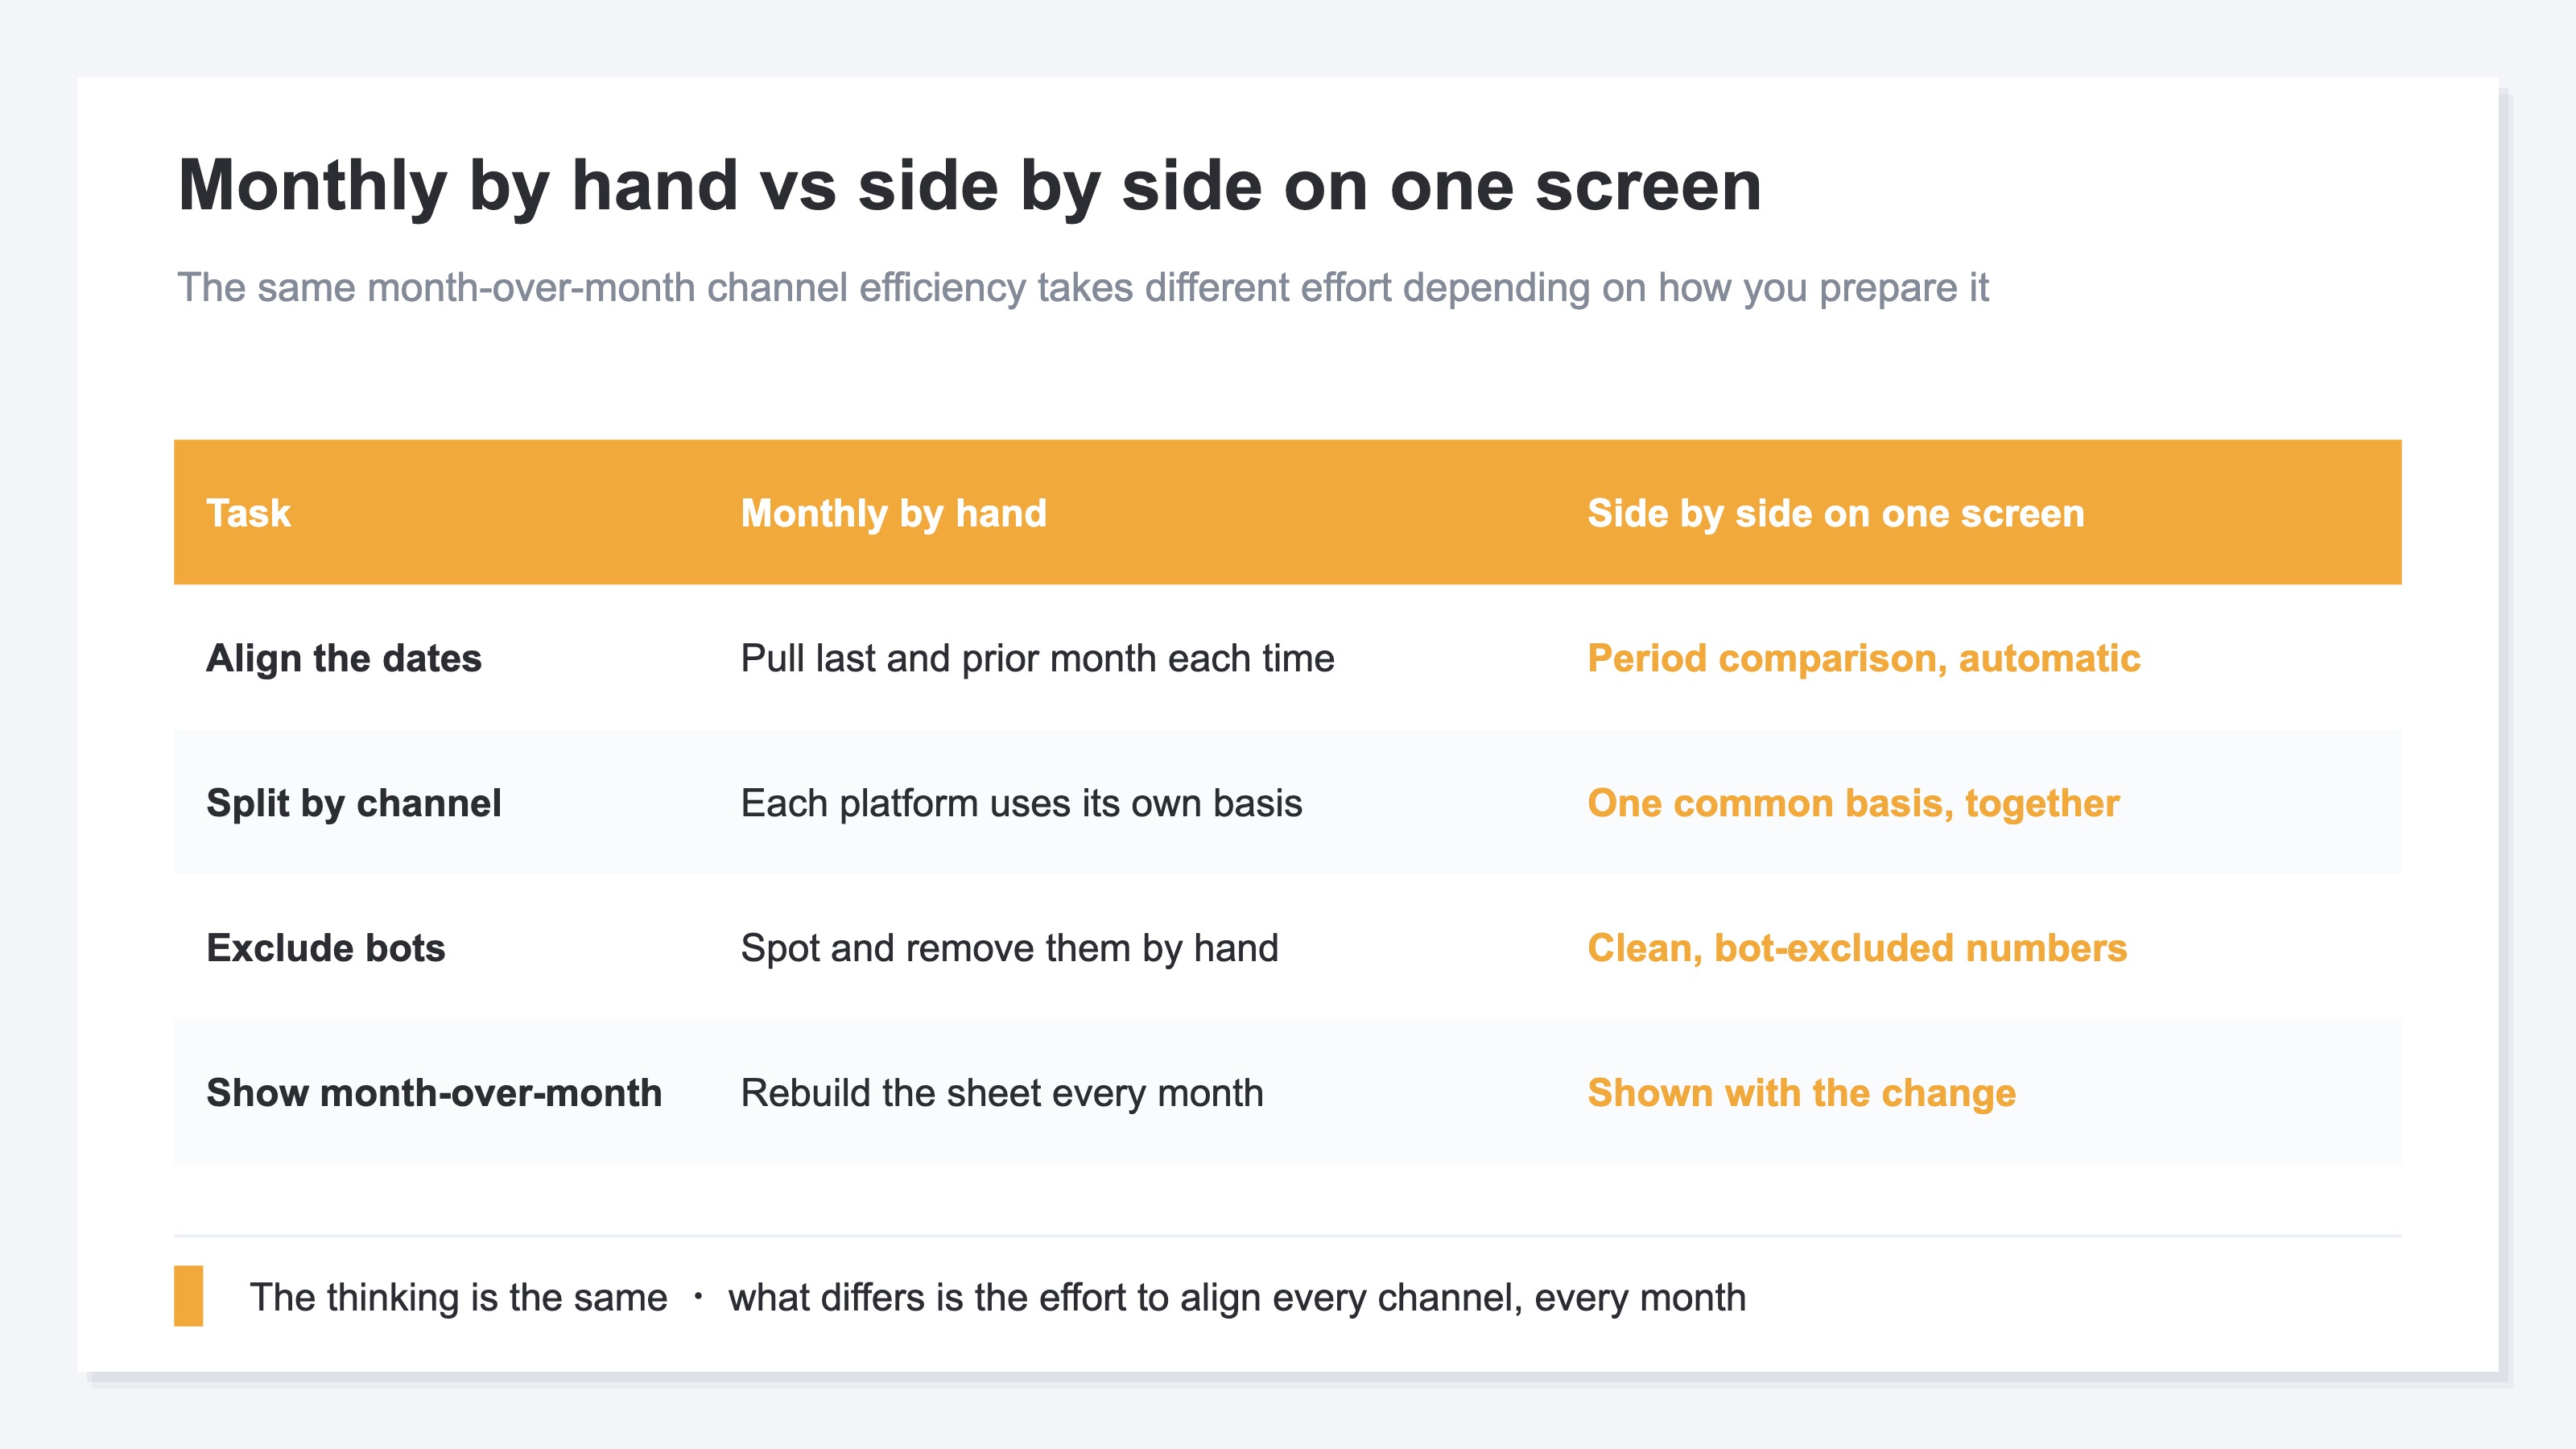
Bottom line: even if the thinking is simple, realigning every channel on the same basis every month is heavy and doesn't last.
The three steps above aren't hard to do once. The heavy part is running them every month, across every channel, on the same basis. Realigning the periods to last month and the prior month, standardizing the channel grouping, spotting and removing bots, and rebuilding month over month in a spreadsheet — keeping this prep up by hand every month doesn't last in the field.
And GA4's standard reports have no view that structurally "lines up channel efficiency month over month, side by side." GA4 gives you single-month revenue and sessions by channel, and it has a feature to compare two specified periods. But a form that lines up channel efficiency (revenue, sessions, RPS, etc.) on one screen with the month-over-month change attached isn't provided by default. As a result, the same manual work recurs before each meeting.
This asymmetry — "the thinking is simple, the monthly repetition is heavy" — is the top reason monthly reviews become a formality. Rather than chasing perfect aggregation, the first move is to have a system that lines up three things each month: month over month, by channel, and bot-excluded. The order in which to suspect causes when revenue drops is laid out in A KPI Diagnosis Procedure for When EC Revenue Drops.
3.1 Bots distort month over month#
When bot impressions and clicks mix in, the month-over-month comparison itself gets distorted. Bot traffic doesn't arrive evenly across channels — it concentrates in particular ones. Compute month over month without excluding it, and sessions get inflated only in months bots rose, leading you to misread "acquisition grew." The distortion from bots mixing differently by channel is laid out in How Bot Traffic Distorts Your Per-Channel Numbers. To make month over month a trustworthy comparison, always build bot exclusion into the monthly prep.
RevenueScope helps
The heavy part of the monthly budget meeting was the prep — lining up month over month, by channel, and bot-excluded. RevenueScope excludes bots with its own tracking, attributes traffic that slipped into Direct back to its true channel, and then lets you compare revenue, sessions, RPS, and conversion rate by channel, with a comparison between the periods you choose.
| Channel | Last month's revenue | Last month's RPS | Overall vs prior month |
|---|---|---|---|
| Search ads | 1.65M yen | ¥210 | +8% |
| Social ads | 0.95M yen | ¥120 | +8% |
| 0.78M yen | ¥340 | +8% | |
| Organic search | 0.96M yen | ¥180 | +8% |
RevenueScope's per-channel view (figures are demo data). It lines up each channel's last-month efficiency (revenue, RPS) on bot-excluded numbers and attaches the overall month-over-month change. It does not return a per-channel month-over-month figure in a single call; rather, it lines up last month's channel efficiency on a common basis and attaches the overall change so it's easier to compare.
Only after excluding bots and lining channels up on the same basis can you decide "which channels to lean into and which to pull back next month" by revenue, not by feel. Note that RevenueScope covers five metrics — Revenue, AOV, RPS, CVR, and Sessions — and their breakdowns (by channel, by new vs returning, and so on). LTV, gross margin, and inventory are out of scope; those belong to other tools.
FAQ#
Q. Why can't I decide from a single month's numbers?
Because a single month's revenue or clicks only tell you "large or small," not "rose or fell." Next month's budget allocation is decided by reading change, so you need last month measured against the prior month. It's not unusual for a large channel to have actually declined last month.
Q. Is GA4's period comparison enough?
Period comparison is a basis for putting two periods' numbers side by side. But the last touch — splitting by channel, excluding bots, and lining up revenue, sessions, and efficiency month over month on one screen — tends to stay manual. Period comparison is a starting point; you still need to line up month-over-month channel efficiency separately.
Q. Can channels without ads (email, organic search) be compared the same way?
Yes. But since ROAS only applies to channels that have an ad cost, to compare ad and non-ad channels on the same basis, use a shared metric like revenue per session (RPS). See How to Measure Non-Ad Channel Efficiency for details.
Summary#
To judge which ads worked at your monthly budget meeting, you need to compare each channel's efficiency month over month, not by a single month's numbers. What you line up before the meeting is three things: align the periods to last month and the prior month / split revenue and sessions by channel / exclude bots and unattributed traffic.
The thinking itself is simple, but realigning every channel on the same basis every month is heavy, and GA4's standard reports have no view that lines up month-over-month channel efficiency on one screen. That's exactly why having a system that lines up month over month, by channel, and bot-excluded each month is the shortcut to keeping the monthly review from becoming a mere formality.
See which ads actually drive revenue, at a glance
Free up to 5,000 sessions/month, AI analyst included. No credit card required. Up and running in 5 minutes.