
Your ecommerce revenue is down from last month. The graph points downward, but you can't tell why it fell—this is the toughest moment many store owners run into. Open your web analytics (GA4 and the like) and you can see the fact that "revenue dropped," but it won't readily tell you "why it dropped."
When you act on whatever comes to mind without knowing the cause, you usually come up empty. What you need when revenue falls isn't guesswork—it's an order for isolating the cause one piece at a time. This article lays out a diagnostic procedure: break revenue down into a few elements to pinpoint "where it fell," then split it further by channel. And at the end, we touch on an easy-to-miss trap—when the numbers are only falling on the surface.
Table of contents
What this article covers#
- Revenue breaks down into "sessions × conversion rate (CVR) × average order value." First pinpoint which element fell, and the range of possible causes narrows fast.
- Once you've identified the element, split it by channel next. Even when the whole looks flat, it's common for just one entry point to be breaking down.
- When revenue is unchanged but only conversion rate (CVR) appears to fall, suspect that the "denominator" has been inflated by automated programs (bots). A surface-level drop and a real drop are two different things.
1. Break revenue into three elements | where did it fall#
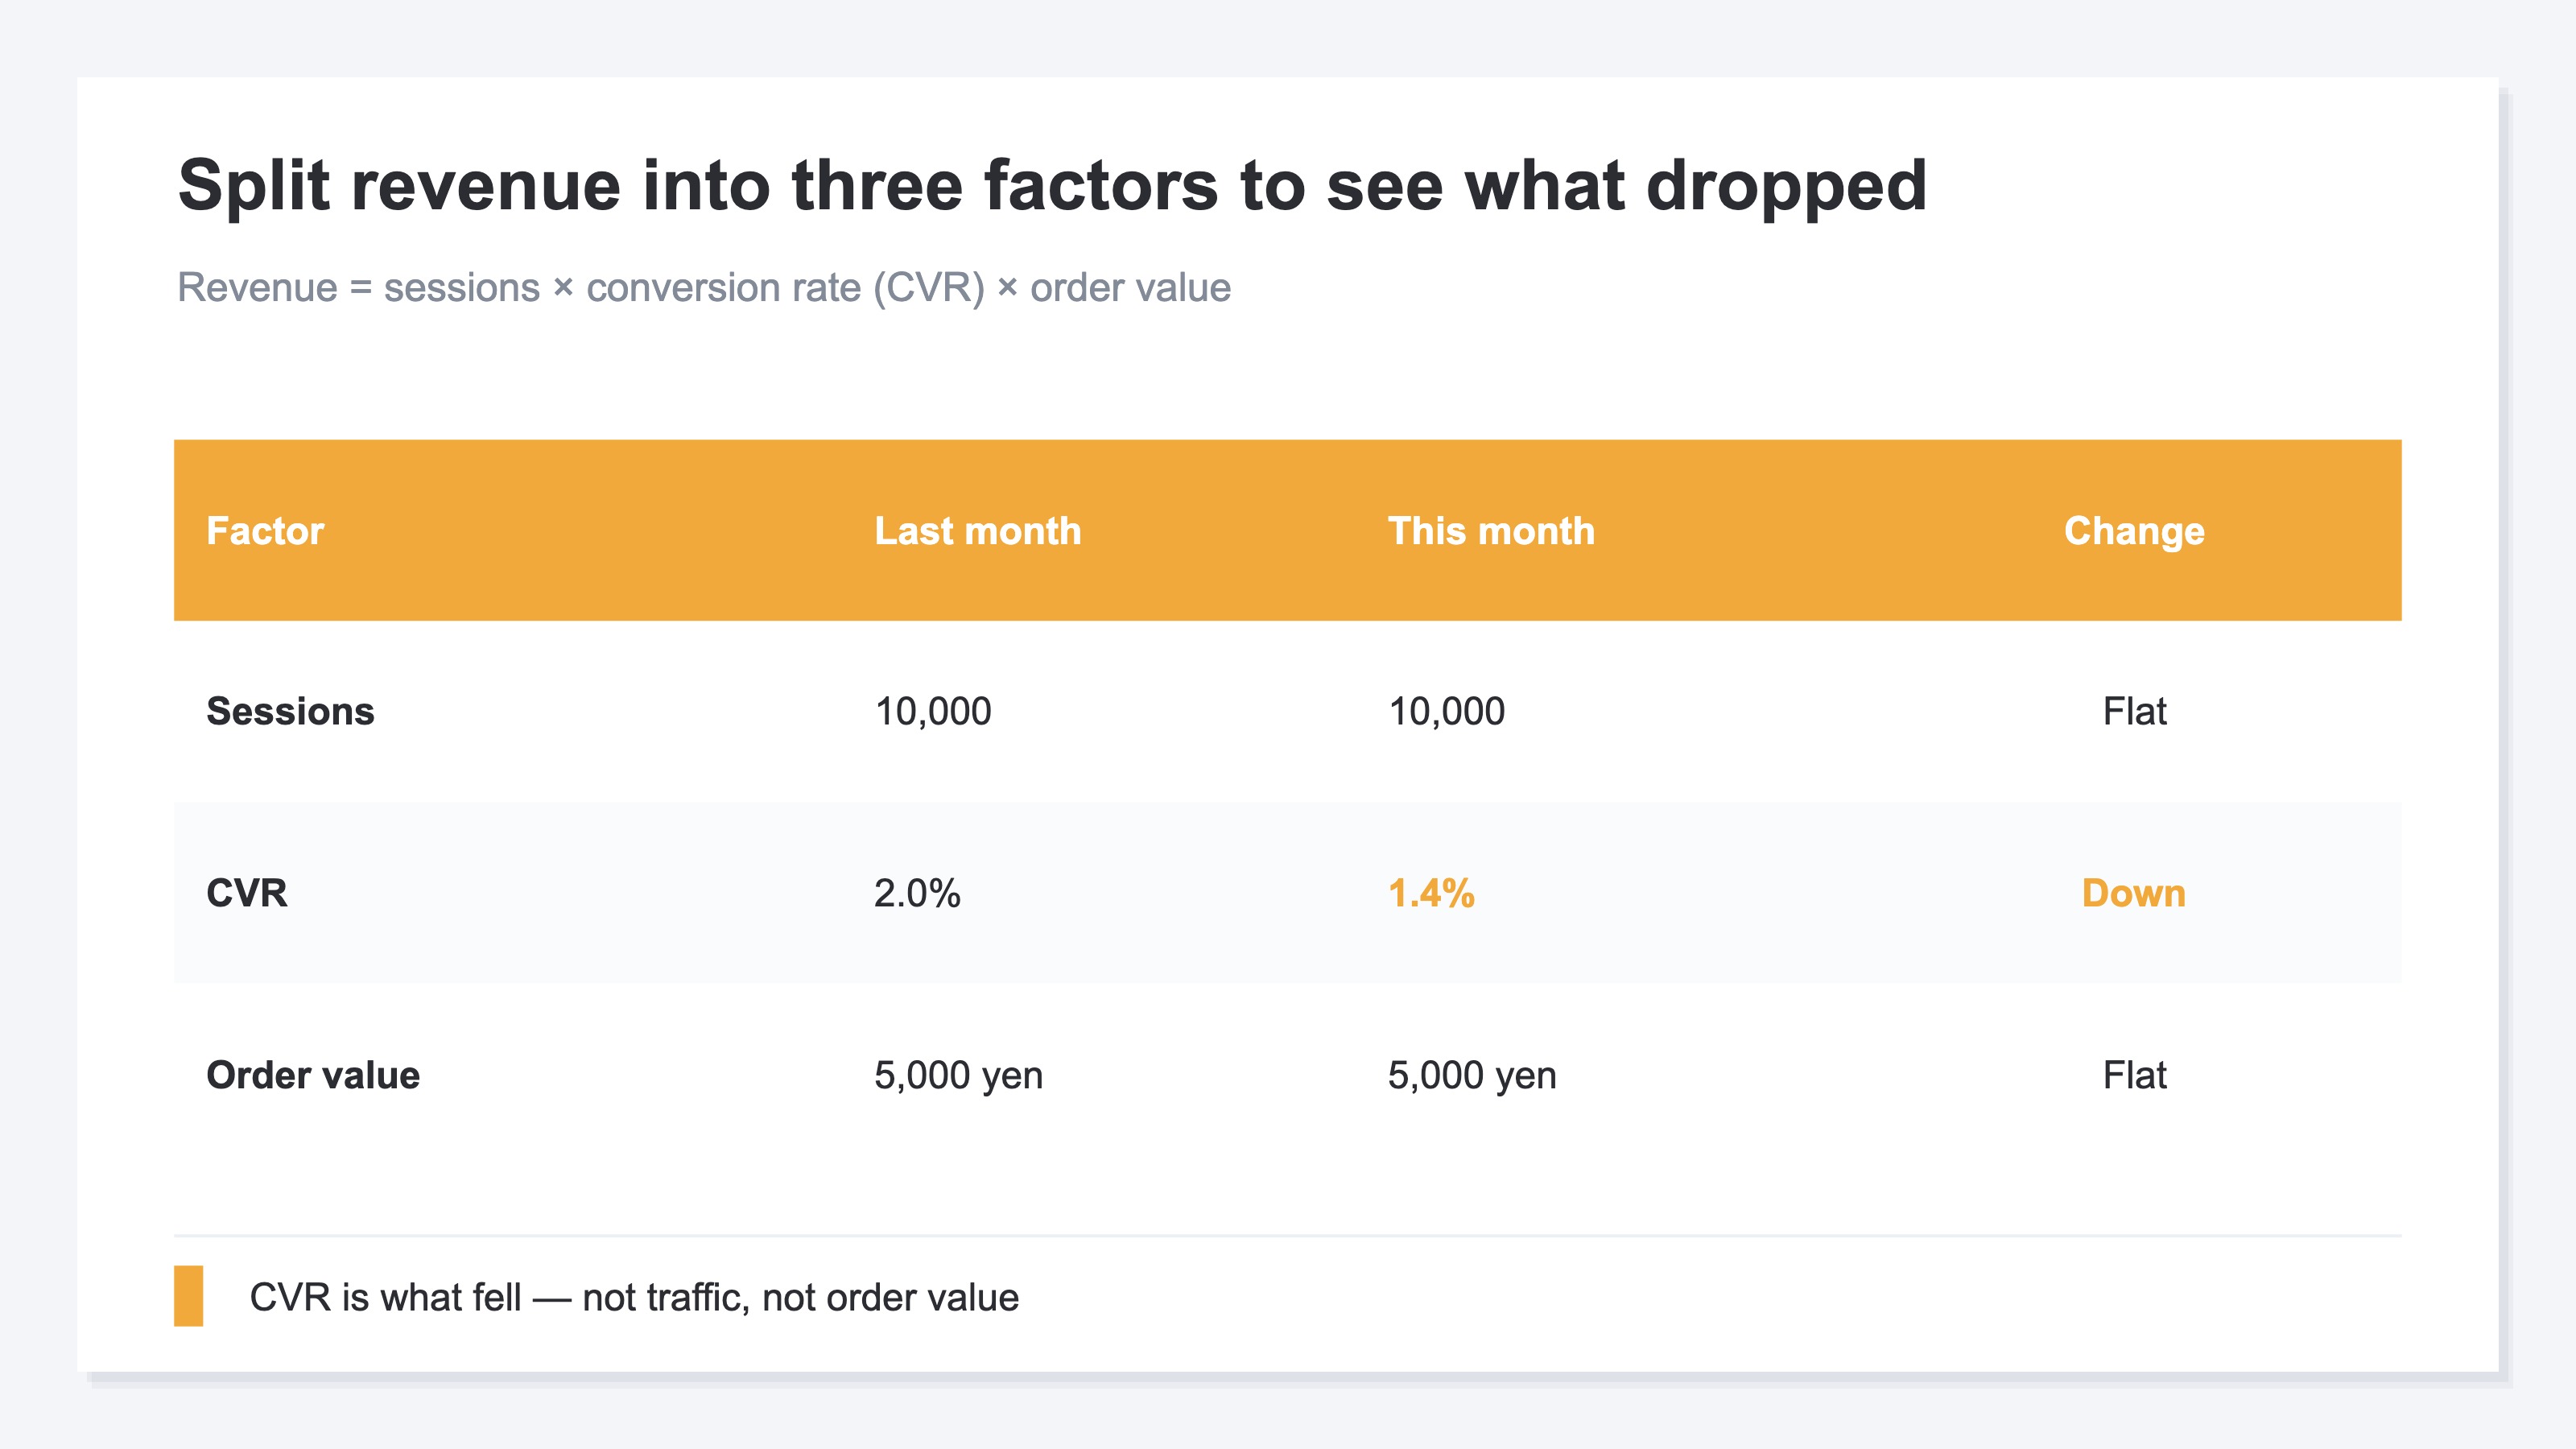
When revenue falls, staring at the single number called "revenue" won't reveal the cause. The first thing to do is break revenue into its elements. Ecommerce revenue can be expressed as the product of these three.
Revenue = sessions × conversion rate (CVR) × average order value
Sessions is "how many people came," conversion rate (CVR) is "what share of those who came bought," and average order value is "how much was bought per purchase." Revenue falling means at least one of these three fell. So first, look at which one dropped.
For example, if sessions are the same as last month but revenue is down, the cause is either conversion rate or average order value. Conversely, if neither conversion rate nor average order value changed yet revenue fell, then simply fewer people came (sessions dropped). This alone separates "a traffic problem" from "a not-being-bought-on-the-site problem." Just narrowing which of the three holds the cause makes it clear where to look next.
2. Split it by channel | the breakdown the whole hides#
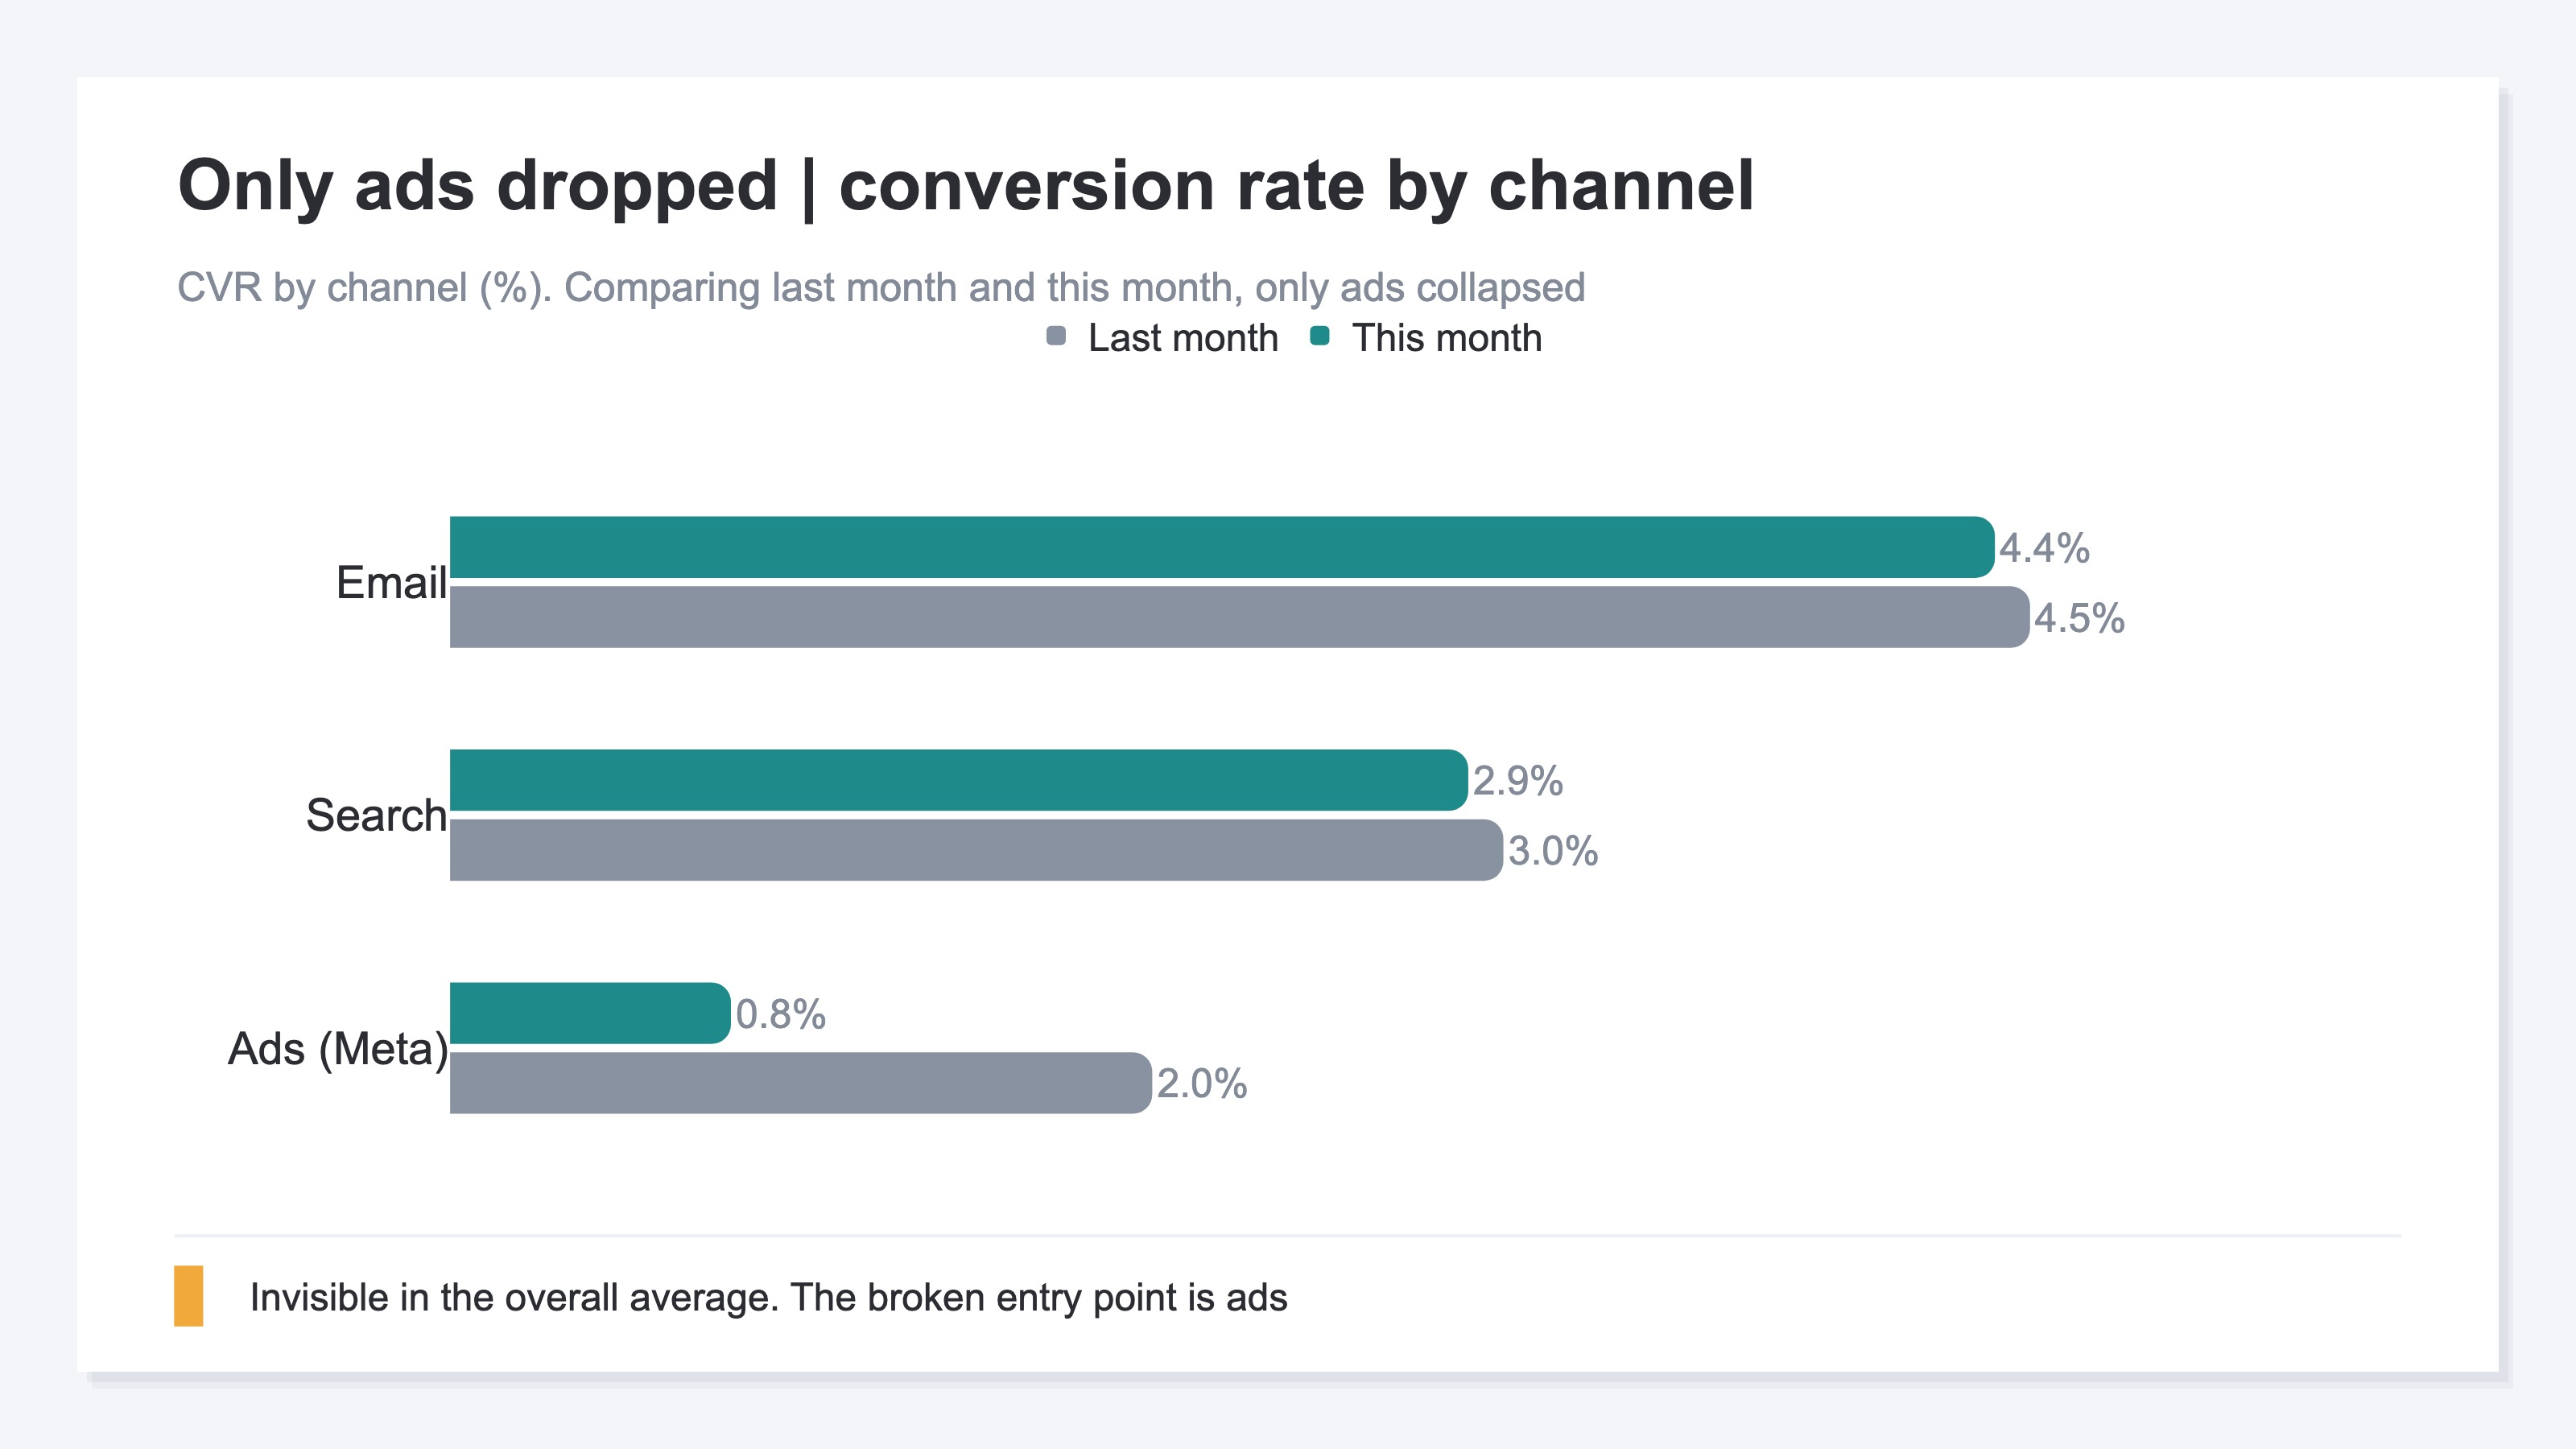
Once you've pinpointed which element fell, split it one level finer next. Look at it by channel (entry point). Here's why: the overall number is an average smoothed across multiple entry points. Even if overall conversion rate fell, it didn't necessarily fall evenly across every entry point. In most cases, just one entry point breaks down badly and drags the whole down.
For example, say overall conversion rate fell from 2.0% to 1.4%. Split by channel, it's common to find that conversion rate from search and email barely changed, while only conversion rate from ads plunged from 2.0% to 0.8%. Only here do you first get a hunch: the cause may not be "the whole site" but "a change in how the ads run." If you only ever look at the overall average, you'll never figure out what happened at which entry point.
Split by channel and the place to investigate narrows further. If only ad traffic fell, you just check whether the ad creative or placement changed, or whether low-quality traffic increased. Instead of blindly reviewing everything, you can hunt for the cause focused on the entry point that broke.
3. Suspect a surface-level drop | the contaminated denominator#
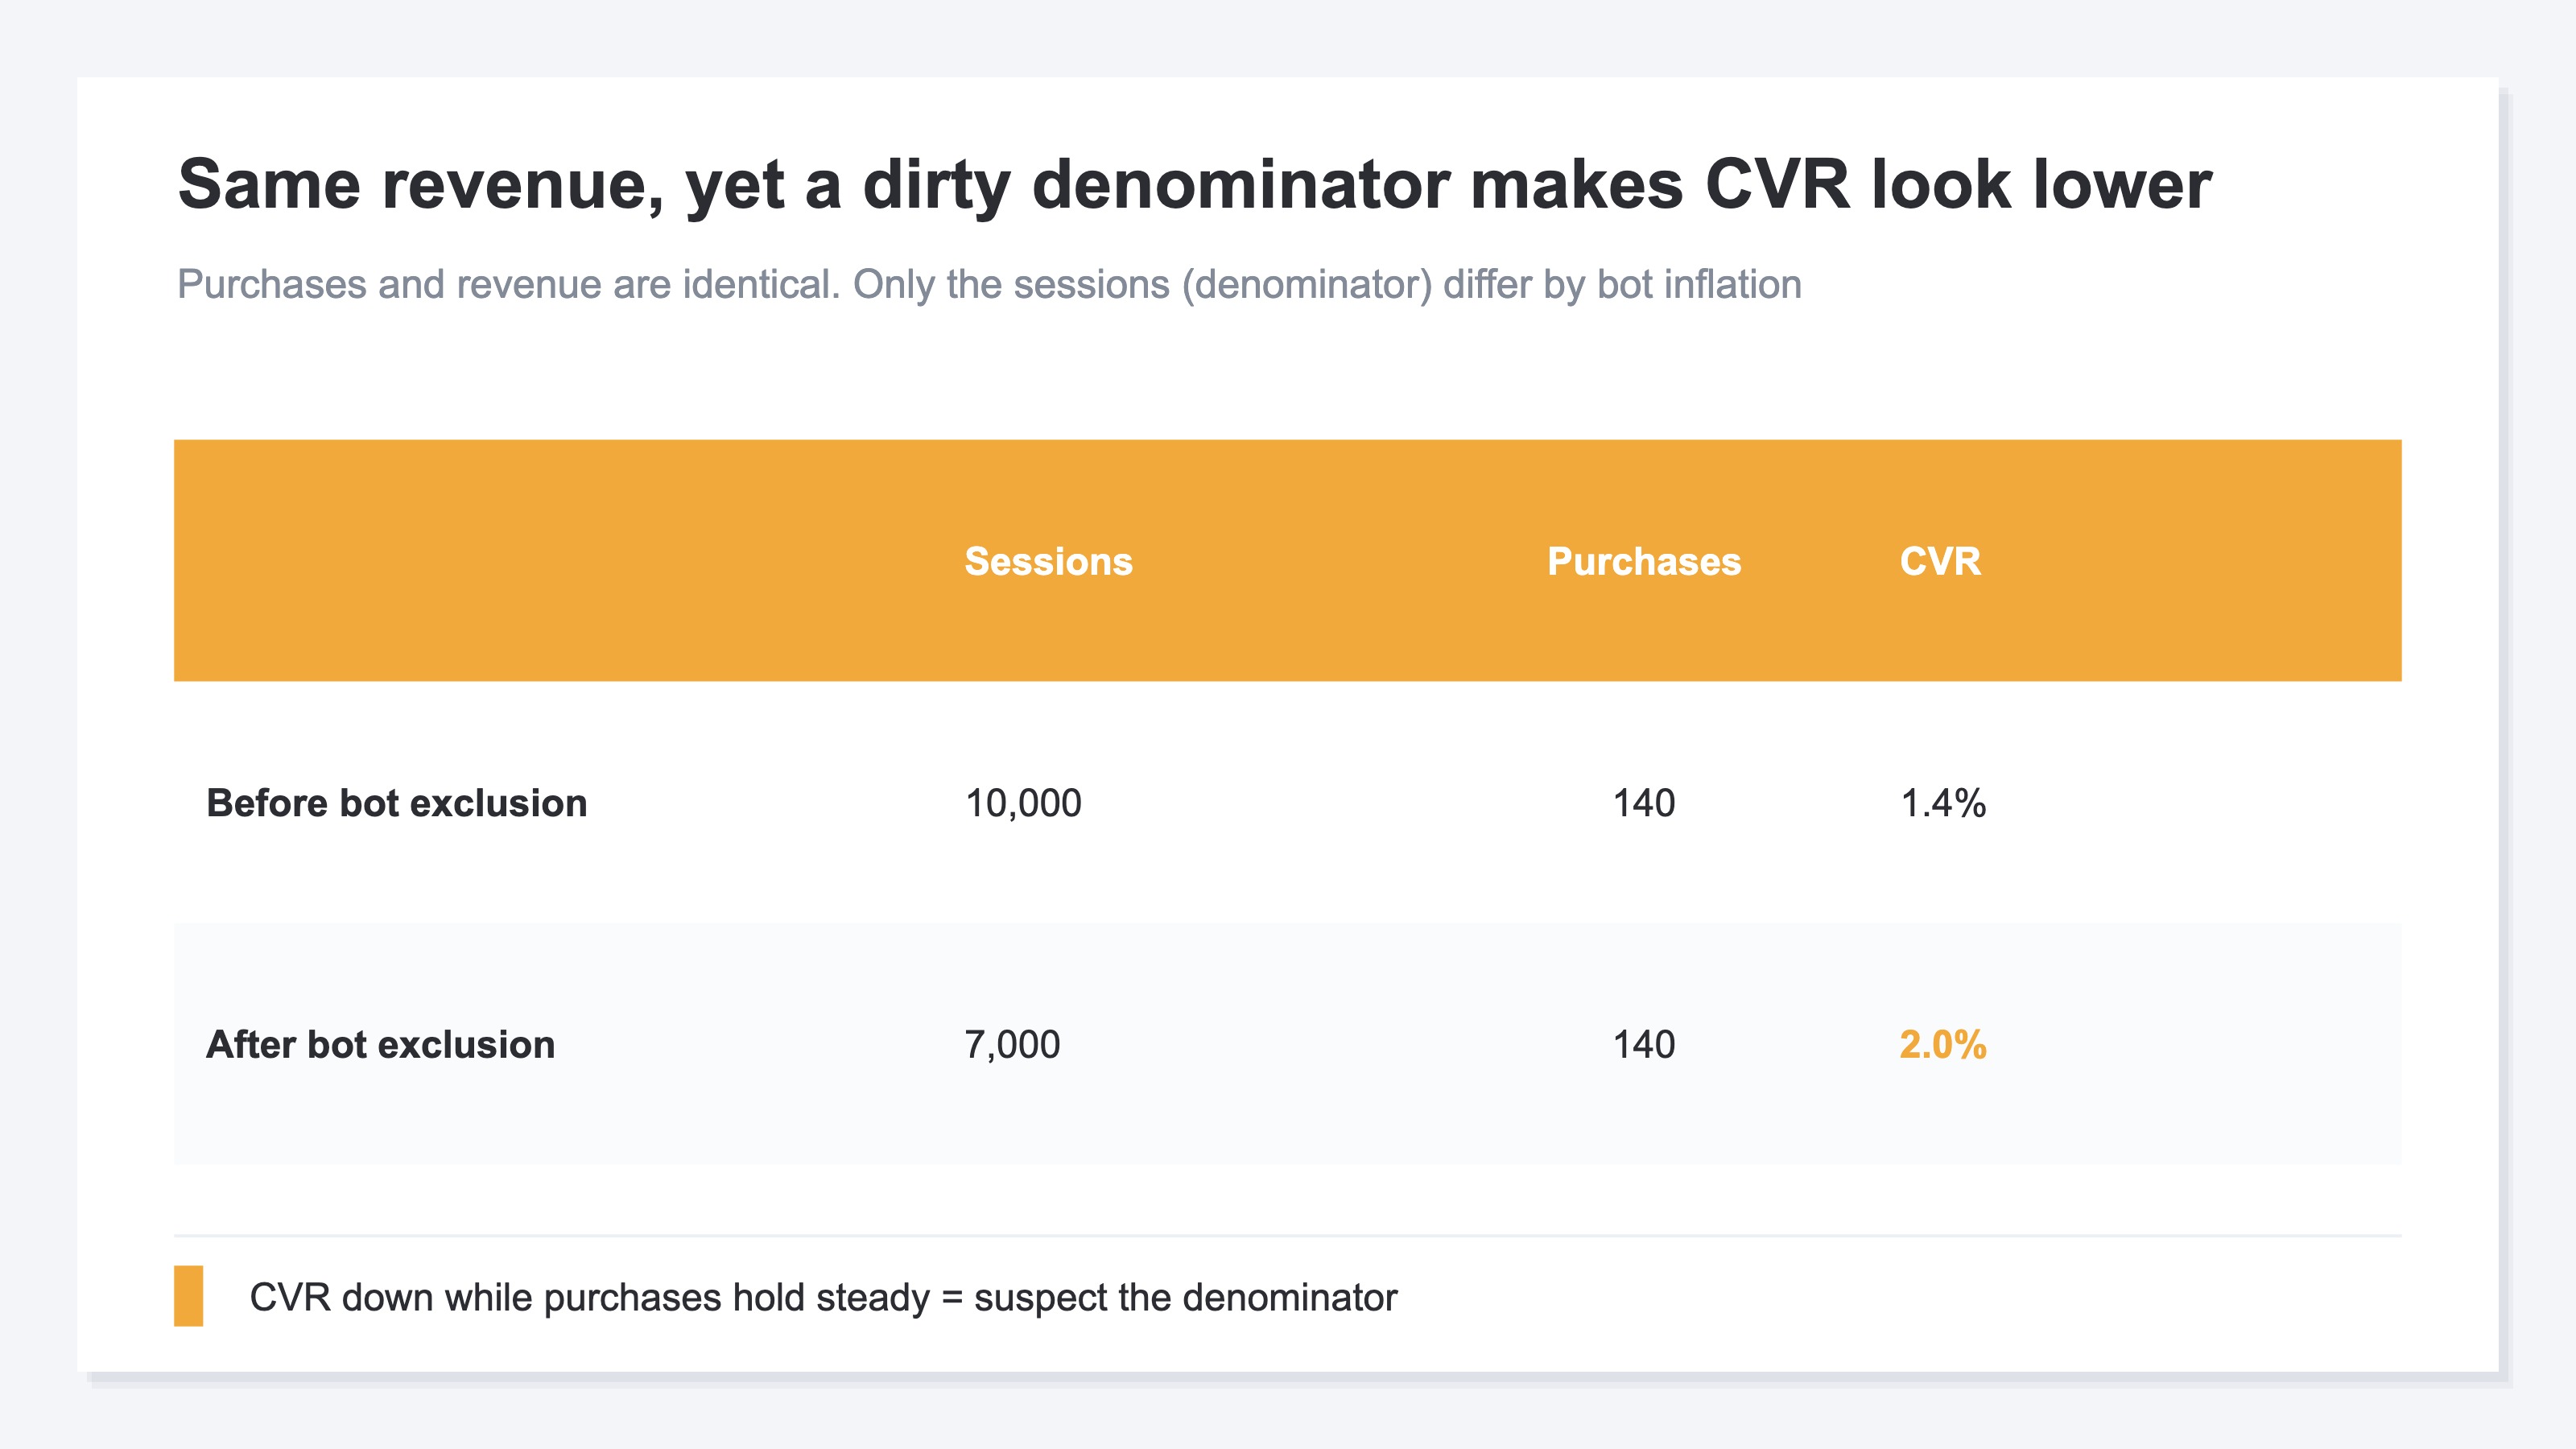
Here's an easy-to-miss trap. When conversion rate (CVR) appears to fall, the cause is sometimes not "people genuinely stopped buying" but "the counting went off."
Conversion rate is calculated as purchases ÷ sessions. When this denominator, sessions, is inflated above reality, conversion rate falls on the surface even though purchases are unchanged. The classic source of inflation is traffic from automated programs (bots). Bots don't shop, so they raise sessions only and don't add purchases. As a result, real revenue hasn't fallen at all, yet only the conversion rate graph points downward.
So when conversion rate appears to fall, you need to tell apart "did people genuinely stop buying" from "did the denominator just get contaminated." The way to tell is simple: confirm whether revenue and purchases actually decreased. If revenue and purchases are unchanged but only conversion rate fell, that's a surface-level drop, and the denominator is what to suspect. Check whether bots or low-quality traffic with no intent to buy suddenly increased. Conversely, if purchases themselves decreased, that's a real drop—follow the procedure in chapters 1 and 2 to track which element and which channel fell.
The idea itself isn't hard. The real wall is elsewhere. Your web analytics (GA4 and the like) has automated programs (bots) that don't shop and low-quality traffic mixed straight into its session counts, and removing only the bots accurately by hand is nearly impossible. If you can't get the denominator right, you can't judge whether your channel-level conversion rates or revenue efficiency are real numbers. Telling apart "a surface-level drop" from "a real drop," channel by channel, every single time—pulling that off in a hand-built spreadsheet is, realistically, beyond reach.
RevenueScope — how it helps
When you try to isolate a revenue drop, you hit the same wall at the end. You want to know "which element, in which channel, genuinely fell," but the numbers for that are scattered across multiple places, and the crucial bots can't be removed accurately by hand. As long as the denominator stays contaminated, you can never finally confirm which channel "genuinely" fell.
RevenueScope consolidates those scattered numbers onto a single screen and, after excluding automated programs (bots), compiles sessions, conversion rate (CVR), revenue efficiency (RPS, revenue per session), and revenue for each channel into a form you can compare on one screen (figures are demo data).
| Channel | Sessions | Conversion rate (CVR) | Revenue | Month over month |
|---|---|---|---|---|
| Search (organic) | 2,500 | 2.9% | ¥320,000 | Roughly flat |
| Ads (Meta) | 4,000 | 0.8% | ¥130,000 | −60% |
| 800 | 4.4% | ¥180,000 | Roughly flat |
Read this table on one screen and the cause you couldn't see by guessing surfaces at once. Search and email are roughly flat. The one falling is only Ads (Meta), where conversion rate plunged to 0.8% and revenue is down 60% month over month. And since these are figures after excluding bots, it's not a "surface-level drop" but the real thing. What to investigate next—whether the ad creative or placement changed—narrows to just one target.
Let's be clear about one thing. What RevenueScope does is split the after-bot-exclusion numbers by channel and by element and line them up on one screen. It assembles the material for where it fell, but the investigation of why it fell (what changed in the ads) and the decision of how to recover are yours to make. Also, metrics like inventory and customer lifetime value (LTV) are not handled by RevenueScope.
FAQ#
Frequently asked questions#
Q. When revenue falls, which number should I look at first?
A. First break revenue into "sessions × conversion rate (CVR) × average order value" and see which of the three fell. This separates "did traffic fall," "did people stop buying on the site," and "did the amount per purchase drop." Next, split the element that fell by channel to narrow down which entry point broke. Rather than staring at a single revenue number, breaking it down first gets you to the cause far faster.
Q. I'm looking at the overall numbers but can't find the cause. Why?
A. Because the overall numbers are an average smoothed across multiple channels. Even if just one entry point breaks down badly, when other entry points prop it up, the whole looks like only a gentle decline. To find the cause, you need to split by channel rather than the whole, and name which entry point fell.
Q. Revenue is unchanged, but only conversion rate (CVR) fell. Why?
A. Conversion rate is calculated as "purchases ÷ sessions," so when the denominator, sessions, is inflated, conversion rate appears to fall even though purchases are the same. A common cause is a sudden increase in automated programs (bots) that don't shop, or low-quality traffic with little intent to buy. If revenue and purchases haven't fallen, that's a surface-level drop. What you should really address is the traffic contaminating the denominator.
Summary#
When ecommerce revenue falls, isolate the cause in order before acting on guesswork. First break revenue into "sessions × conversion rate × average order value" to pinpoint which element fell. Next split it by channel to name which entry point broke. These two stages narrow the place to investigate at once.
And when only conversion rate appears to fall, confirm whether revenue and purchases genuinely decreased; if they haven't, suspect a "contaminated denominator." Not getting swept up by surface-level drops is the first step to recovery. The more anxious you feel about falling revenue, the more you should stop glaring at one number and split it into elements and channels. The cause is always hidden in one of the combinations.
See which ads actually drive revenue, at a glance
Free up to 5,000 sessions/month, AI analyst included. No credit card required. Up and running in 5 minutes.