"I installed web analytics, but the screen filled up with numbers and I can't tell which ones to actually look at." It's a wall many people hit when they've just started out in ecommerce.
Bottom line: the first things to look at are three — visits, traffic source, and revenue. How many people came, where they came from, and how much they bought. These three give you a rough read on where your site stands today. But being able to see these three isn't the goal in itself. What really matters is using those numbers to decide where to put your effort next.
The three metrics are like a health checkup that shows what happened up to yesterday. Anyone can see them by opening the screen. But the prescription — "where should I invest next to grow revenue" — doesn't fall out of that same screen. This guide lays out what the first three metrics mean, why looking alone leaves you stuck, and how to connect the numbers to your next move, from an ecommerce operator's perspective.
Table of contents
Key takeaways#
-
The first things to look at in web analytics are three: visits, source, and revenue
"How many came, where from, and how much they bought." These three give a rough read on where you stand. Before adding more metrics, first put the numbers that tie directly to revenue on a single page.
-
The three only answer "what happened." "What to do next" is a separate question
The three metrics are a health checkup, not a prescription. Anyone can see them by opening the screen, but looking alone doesn't decide where to focus next.
-
The key to turning numbers into a move is revenue per session, by source
Even at the same visit count, revenue per session (RPS) varies widely by source. Only when you compare by revenue per visit — not by count — does the next place to invest come into view.
1. The first three metrics to watch: visits, source, and revenue#
Bottom line: for web analytics, the first three to look at — visits, source, and revenue — are enough to start.
When there are countless metrics, beginners especially get stuck on "which number should I trust." Start by narrowing to just these three:
- Visits: how many people (or times) came to the site. In web analytics this is counted as "sessions"[1]
- Traffic source: where those people came from — search, social, email, ads, and so on[2]
- Revenue: how much the people who came bought. The amount that turned into the result of a purchase
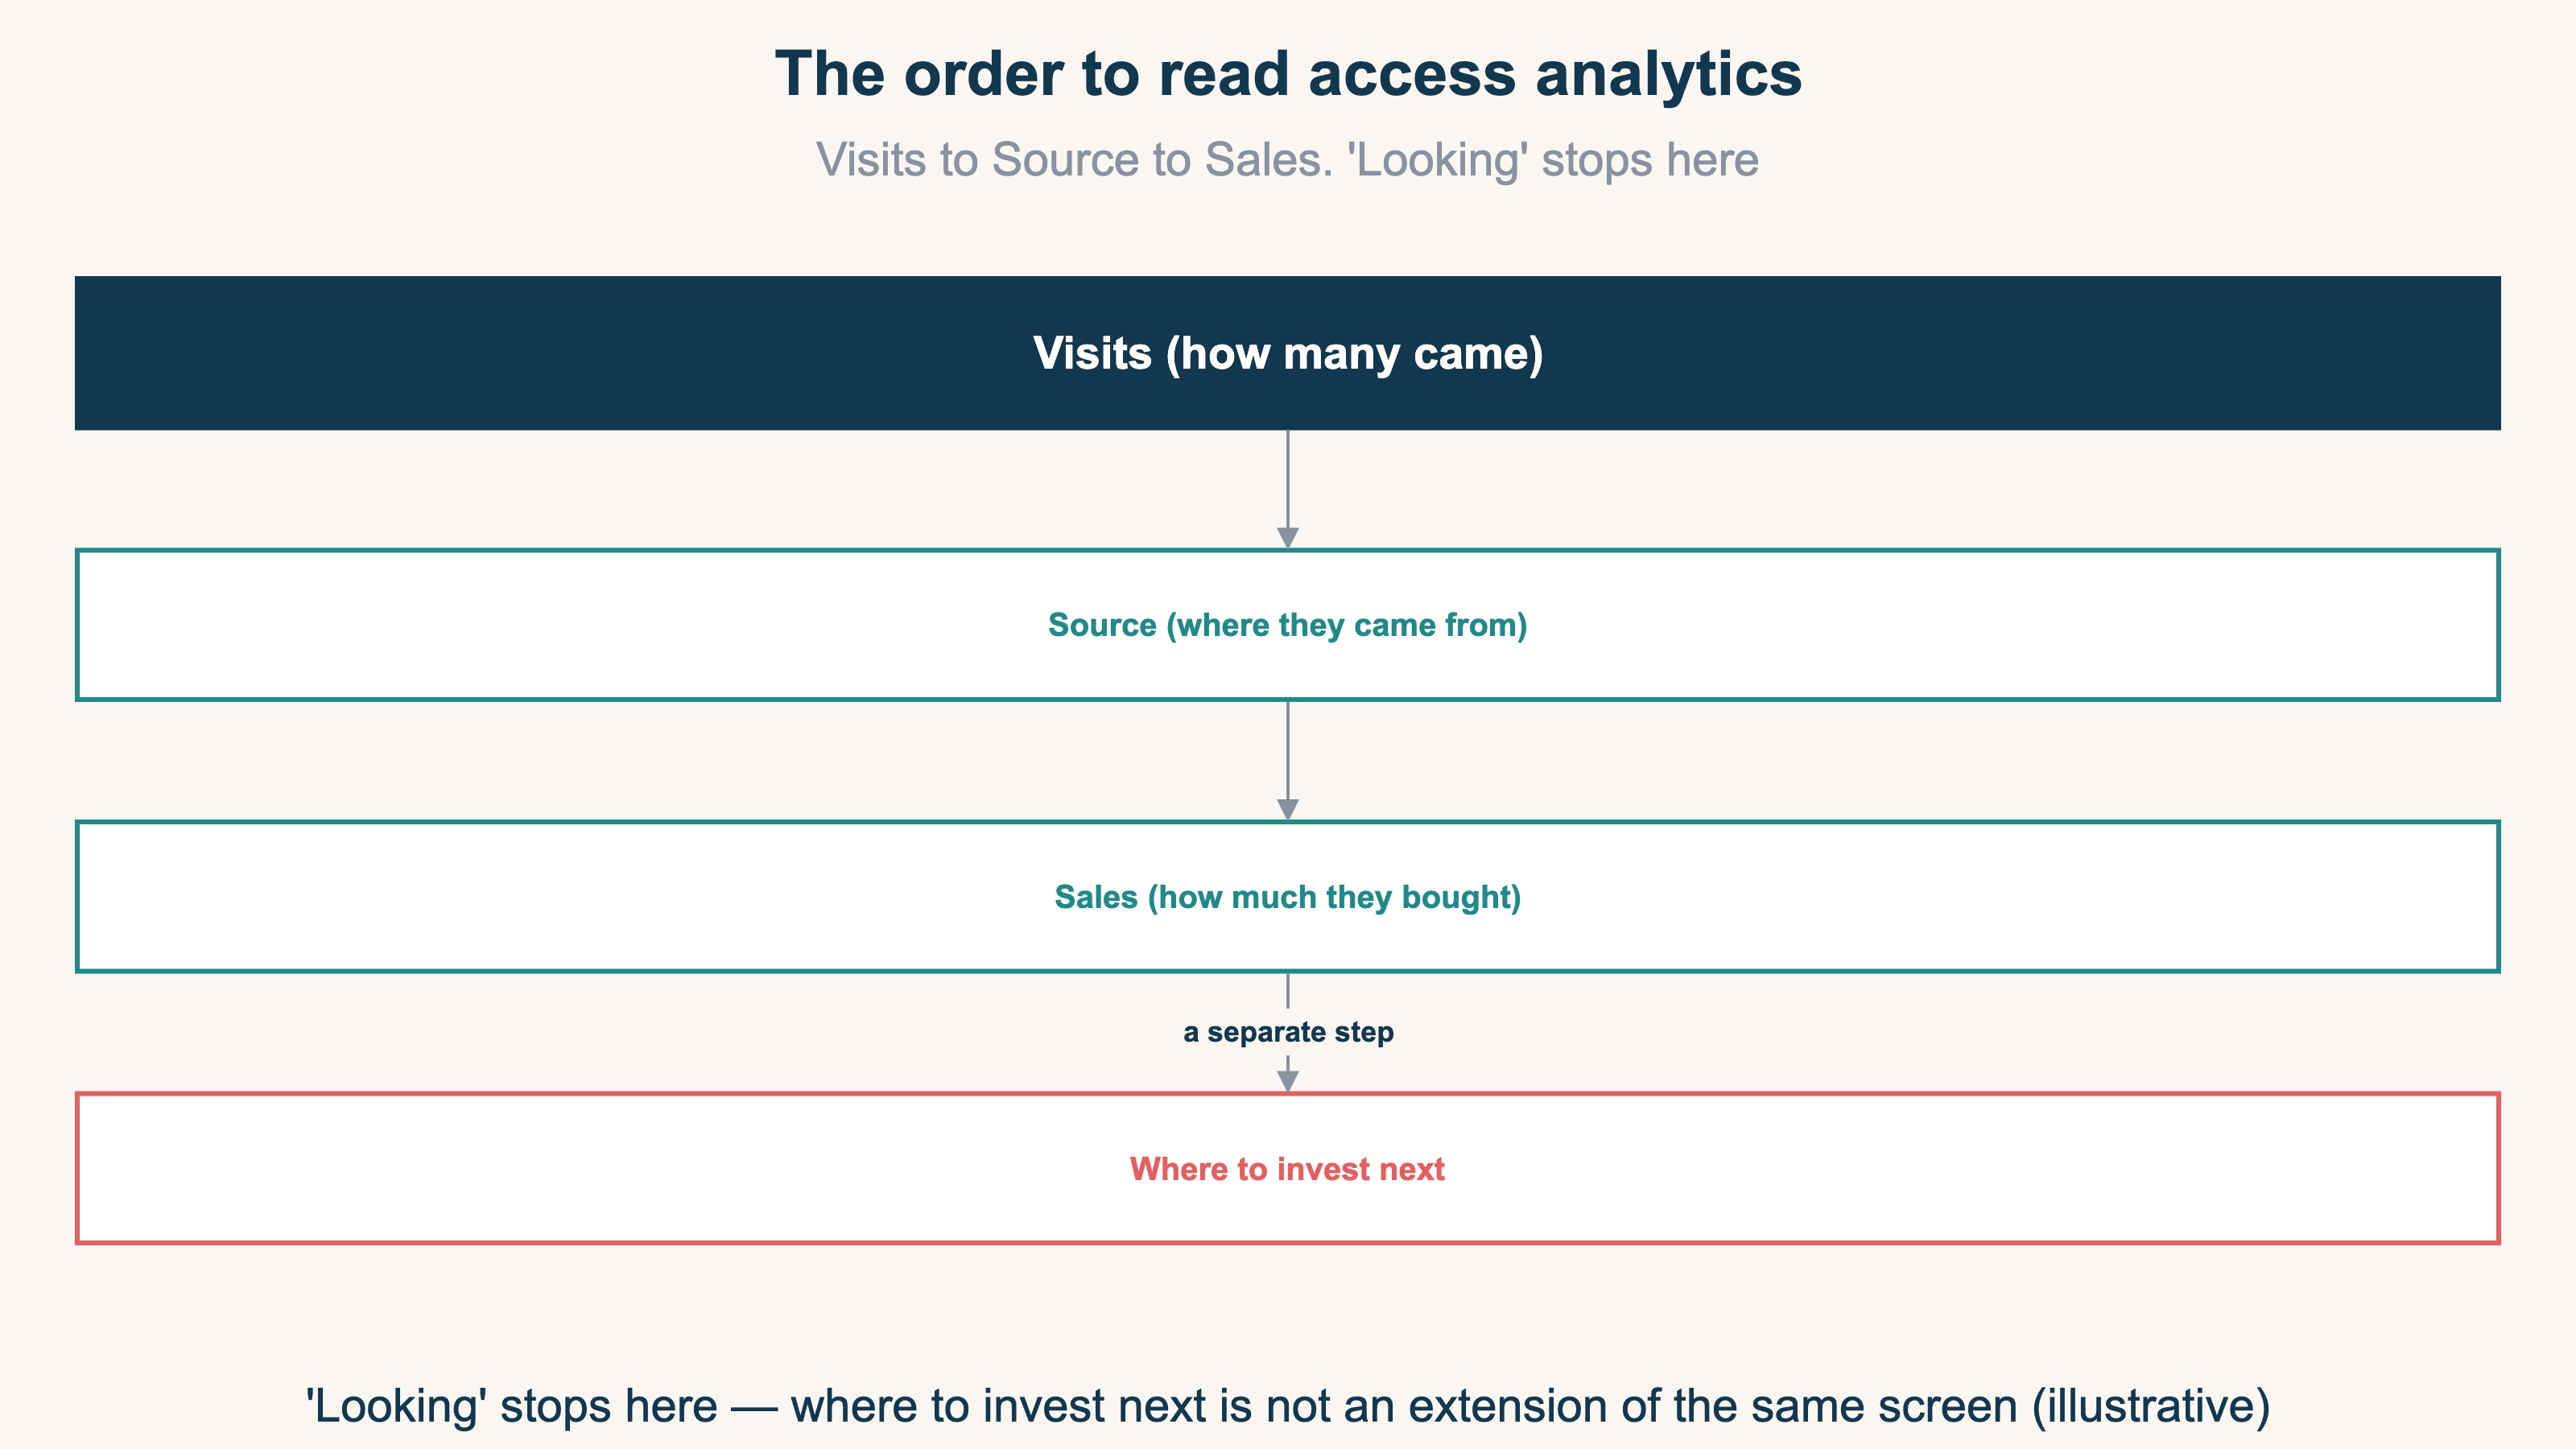
These three sink in more easily when you read them as one flow: "arrival → source → result." How many came, where they came from, and how much they bought in the end — in that order.
Which screen shows these three depends on the tool you use. For which report to open specifically, see How to read GA4 reports: the top 3 for ecommerce; for choosing the tool itself, see How to choose an ecommerce analytics tool: GA4, free analytics, and revenue dashboards. The starting point is building the habit of always lining up these three.
2. What the metrics answer, and what they don't#
Bottom line: the three metrics answer "what happened," but they don't answer "what to do next."
Visits, source, and revenue accurately reflect what happened in the past. But this is where many people stumble. Opening several screens and tabs every morning just to confirm "how did yesterday go" leaves you tired before the day even starts. You can grasp the situation, but what to do from there doesn't come into view. This is the state of stopping at "just looking."
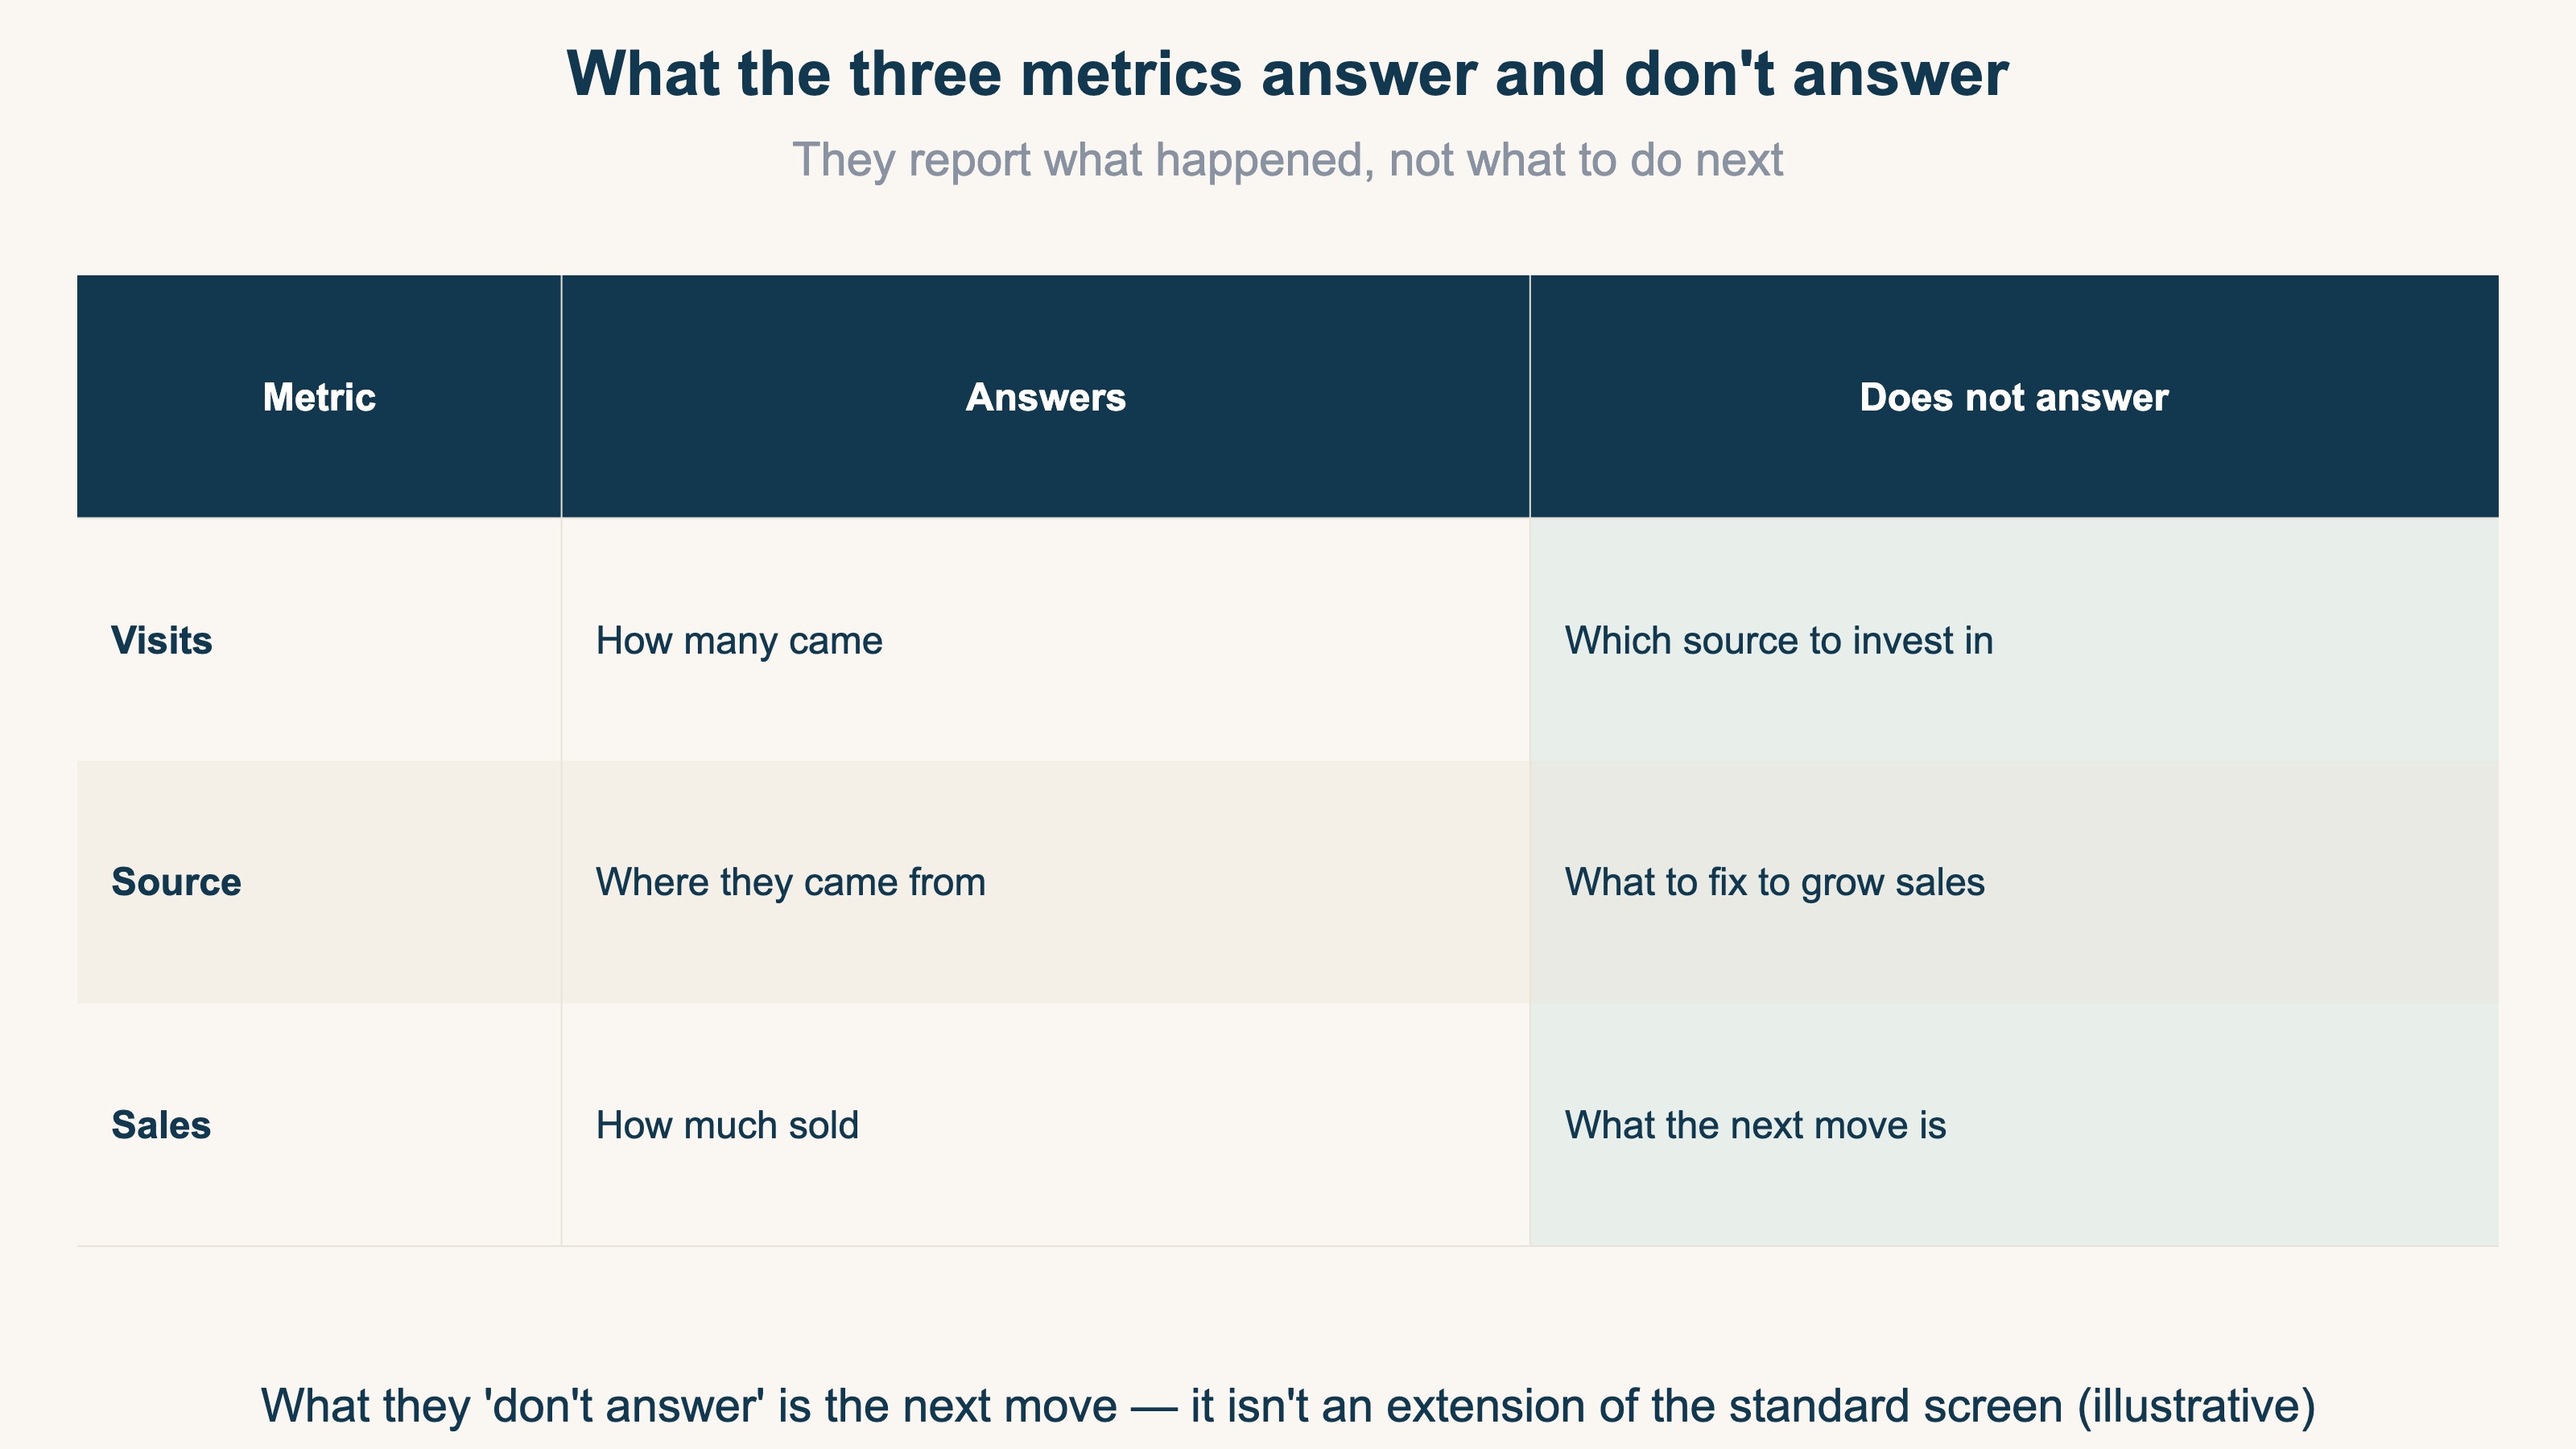
As the table shows, the three metrics can answer "how many came," "where from," and "how much sold." They don't, on their own, answer "which source should I put effort into next" or "where do I fix to grow revenue." That's exactly why it's better not to pile on metrics, but to narrow to the ones that move revenue. For how to narrow metrics, see Narrow ecommerce KPIs to five: how to choose among too many metrics. What matters isn't looking at numbers for its own sake — it's connecting the numbers you saw to the next decision.
3. Why looking alone doesn't surface the next move#
Bottom line: as long as you look at visits and source as "counts," you can't decide where to put your effort. Only when you look at revenue per session (RPS) by source does the next move appear.
Here we go one level deeper. RPS (Revenue Per Session) is a source's revenue divided by its visits — it shows "how much revenue one visit produced, on average." Even at the same visit count, RPS differs completely by source.
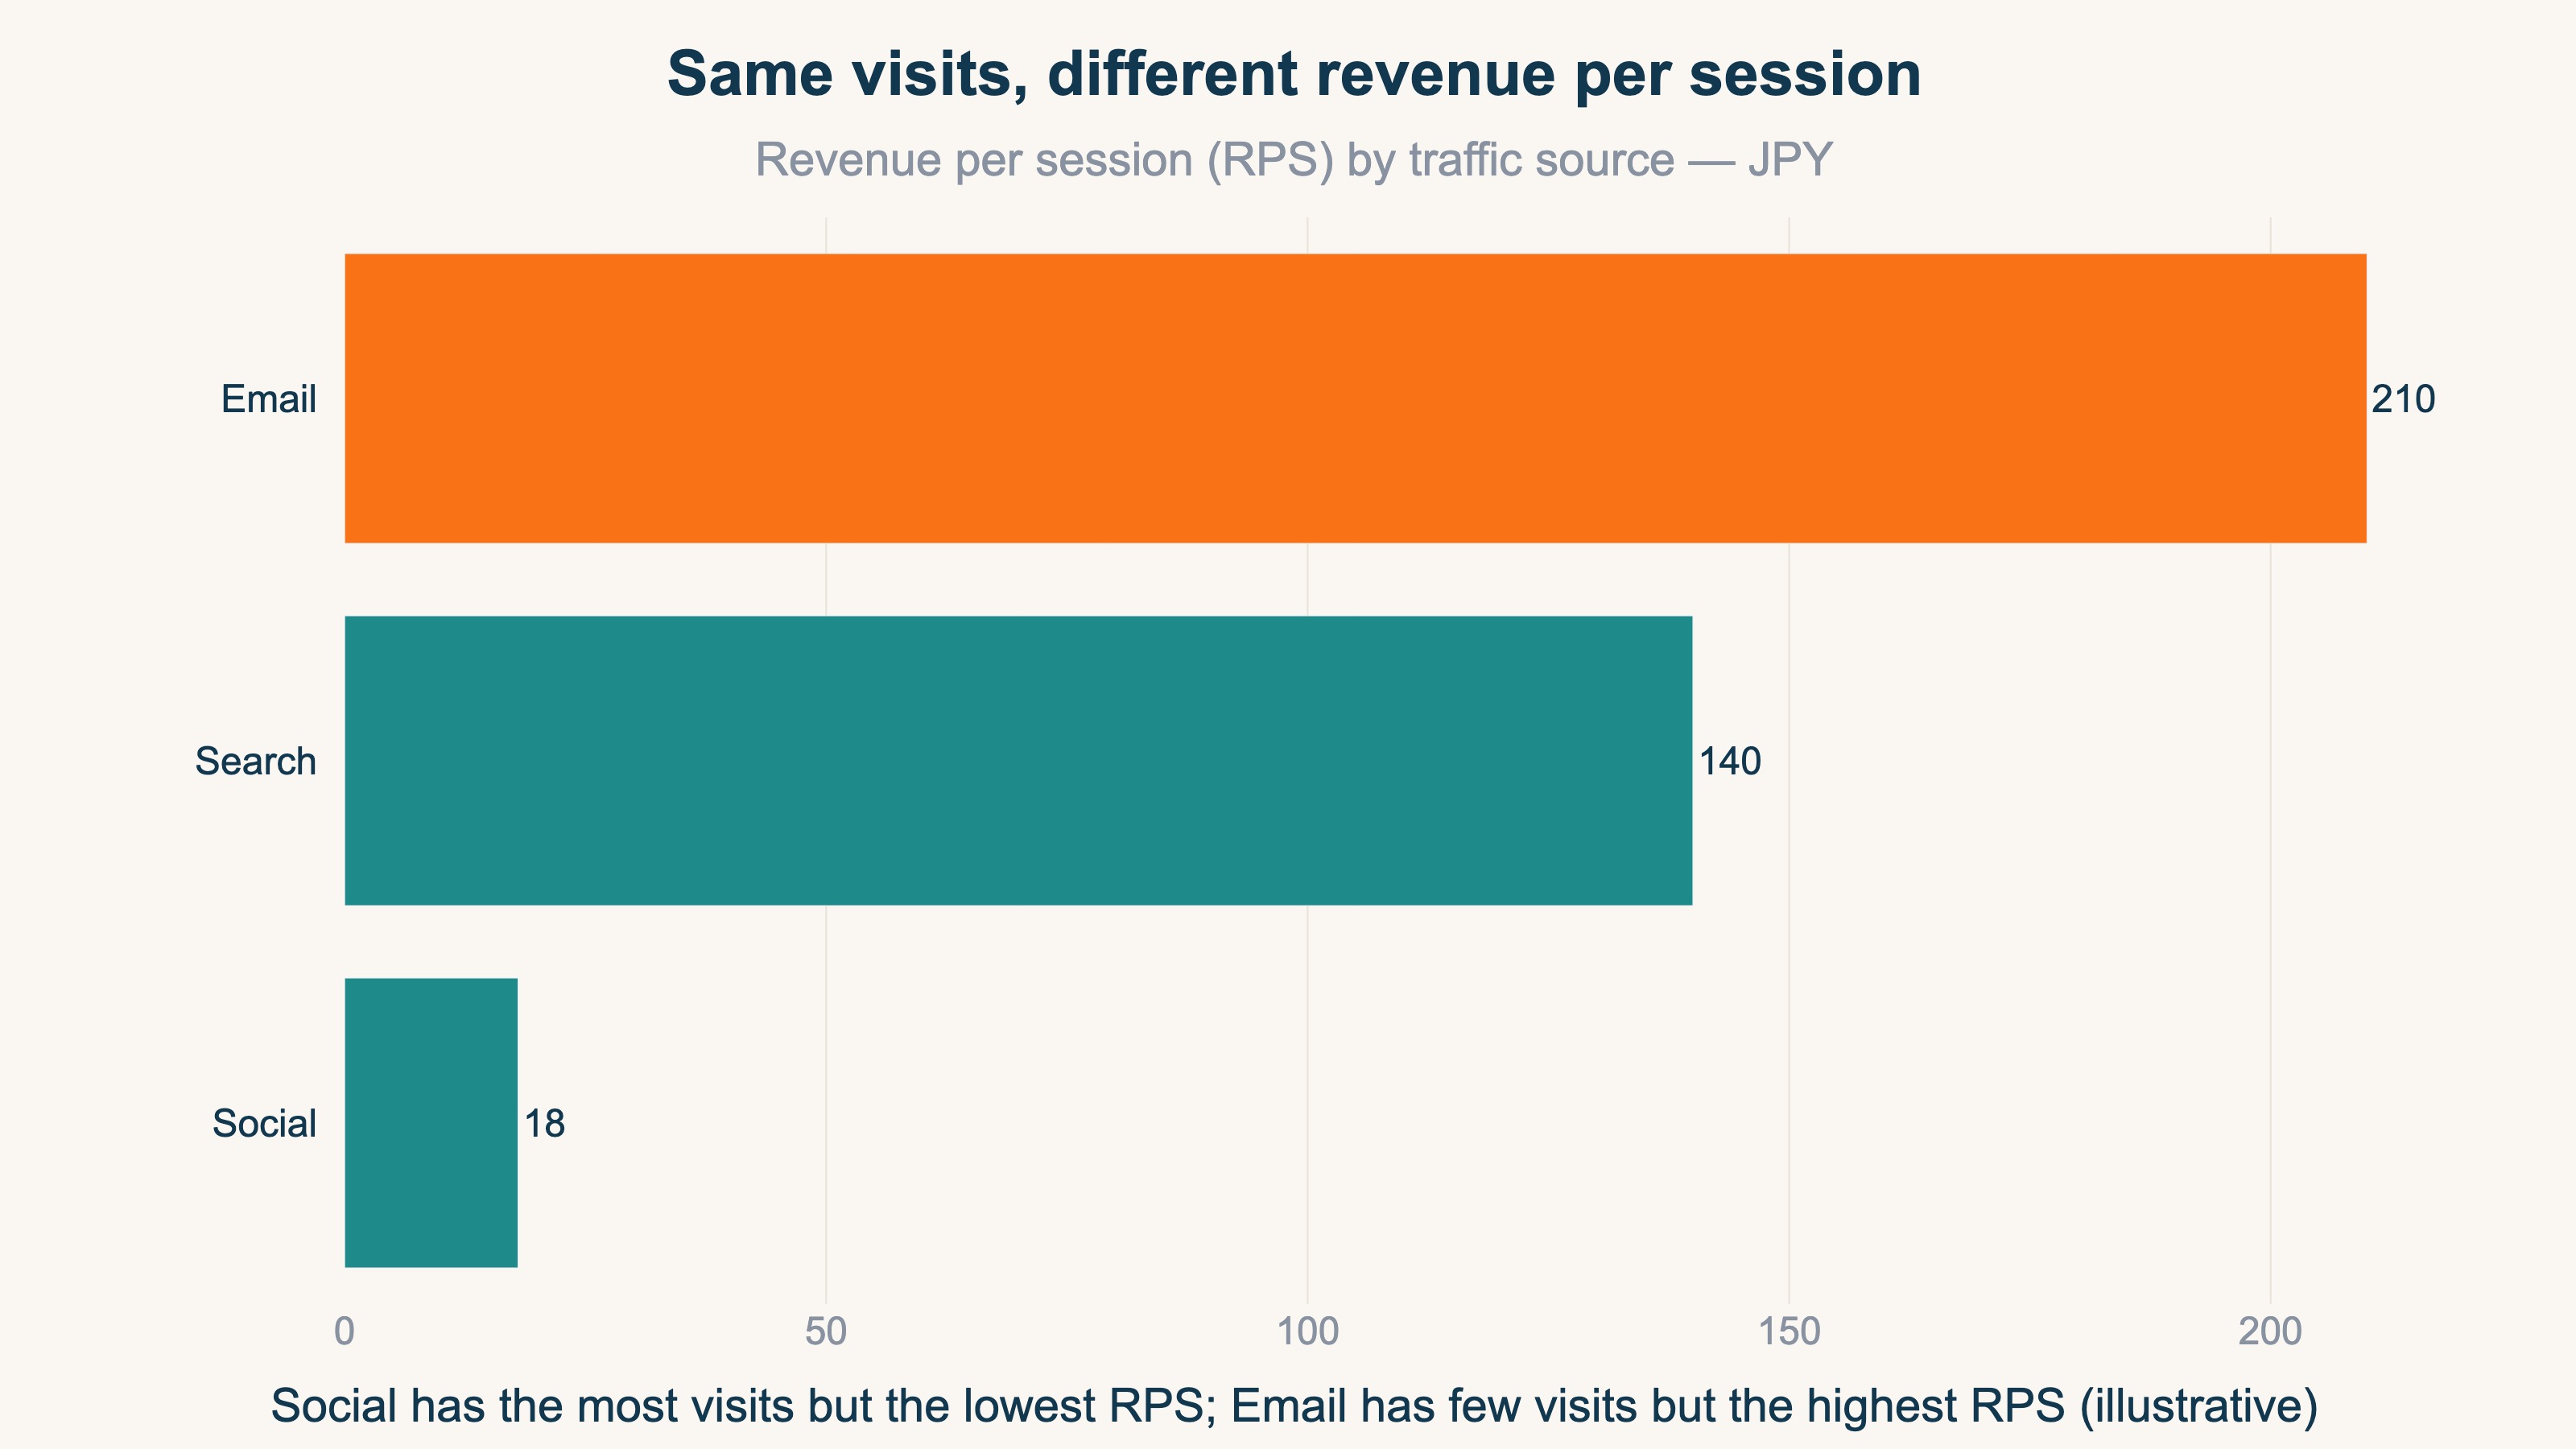
For example, even if social brings the most visits, if revenue per visit is low, revenue won't grow in proportion to the count. Conversely, search or email often have high RPS even with fewer visits. Judge by visit count alone and conclude "social is growing," and you'll keep pouring effort into a source that rarely produces revenue. The gap where traffic rises but revenue doesn't is covered in Traffic is up but revenue isn't: the number to watch is RPS; how to calculate and produce RPS is covered in detail in What is RPS: the metric for comparing channels, the formula, and how to get it in GA4.
The idea itself isn't hard. What's hard is that even after adding a high-spec tool or AI, it won't automatically tell you "which number should I look at in my own situation right now." Tools help with the part that calculates the metrics, but which one matters most right now isn't decided until a person supplies the context of their own revenue. And lining up RPS across sources, then translating what the numbers mean for the business — repeating that every time — is the heavy part.
RevenueScope solution
Bottom line: comparing revenue per session by source on a single screen, and pointing to the one thing to tackle next — that's not in GA4's standard reports; it's RevenueScope's domain.
Looking at visits, source, and revenue only as "counts" won't decide your next investment. RevenueScope rebuilds web analytics starting from revenue, lining up revenue and RPS by source on the same screen. Which source is truly producing revenue becomes obvious at a glance.
For example, here's what "asking RevenueScope" looks like (demo data):
| Source | Visits | Revenue per session (RPS, JPY) |
|---|---|---|
| Search | 620 | 140 |
| Social | 1,180 | 18 |
| 240 | 210 |
Social has the most visits, but by RPS it's the lowest — it isn't producing revenue in proportion to its count. Email, by contrast, has few visits but high revenue per visit. By visit count alone you'd say "let's grow social," but compared by RPS, where to put your effort changes. RevenueScope also returns "what to do this week" ordered by revenue impact, so the one thing to tackle first is decided. Connect it to ChatGPT or Claude and the AI reads your own numbers directly and answers "where should I focus right now." It's read-only, so there's no worry about your data being rewritten.
Note that what RevenueScope produces stops at revenue-based metrics; it doesn't measure gross margin or customer lifetime value (LTV). It isn't a replacement for GA4 — it's a complementary relationship, adding "so where do I invest next" on top of the "what happened" that GA4 shows.
FAQ#
Q. In the end, is it enough to just look at these three in web analytics?
To start, the three — visits, source, and revenue — are enough. But the three only cover grasping the situation. As you get used to it, also looking at revenue per session (RPS) by source makes the next move easier to decide. Adding too many metrics from the start actually makes it easier to get lost.
Q. If I add a high-spec tool or AI, will it automatically tell me which metrics to watch?
Tools help with the part that calculates the metrics, but "which one matters in my situation right now" doesn't come out without the context of your own revenue data. So first, put the numbers that tie directly to revenue on a single page.
Q. Why isn't revenue growing even though visits are increasing?
Because revenue per session (RPS) varies widely by source. If only low-RPS sources increase, revenue won't follow even as visits rise. Comparing RPS by source shows you where things aren't growing.
Summary#
The first things to look at in web analytics are three: visits, source, and revenue. Once you know "how many came, where from, and how much they bought," you have a rough read on where your site stands today. But these three are a health checkup, not a prescription. Anyone can see them by opening the screen, but looking alone doesn't decide where to put your effort next. The key to the next move is comparing revenue per session (RPS) by source. Because RPS differs by source even at the same visit count, the place to focus is decided only when you look at revenue per visit rather than count. First build the habit of always lining up the three; once you're used to it, step up to the revenue-based view.
See which ads actually drive revenue, at a glance
Free up to 5,000 sessions/month, AI analyst included. No credit card required. Up and running in 5 minutes.