
You put effort into SEO, ran ads, worked hard on social—and sure enough, traffic went up. Yet revenue barely changed. "Traffic is growing, but it isn't turning into sales." Run a shop online and you'll hit this situation often.
Most of the time, the cause is the "quality" of the added traffic. Even if traffic grows, if those visits don't buy, revenue won't grow. The number that reveals this is revenue per session (RPS). RPS stands for Revenue Per Session—revenue divided by the number of visits (session count). Even if traffic doubles, if the added visits have thin RPS, revenue won't grow. This article walks through, in order, why more traffic doesn't translate straight into revenue, how to split out where things got diluted, and why keeping that split aligned every month turns out to be heavy.
Table of contents
This article in brief#
- More traffic doesn't always mean more revenue. If the added visits don't buy, revenue stays the same
- What to look at is revenue per session (RPS). If traffic grows but RPS falls, that's a sign the added visits aren't generating revenue
- You can split out where it got diluted with RPS by channel. In many cases, the newly added traffic (ads or social) has low RPS and is diluting the whole
1. More traffic doesn't always mean more revenue#
In short, the reason revenue doesn't grow even though traffic did is that the added visits are "visits that don't buy."
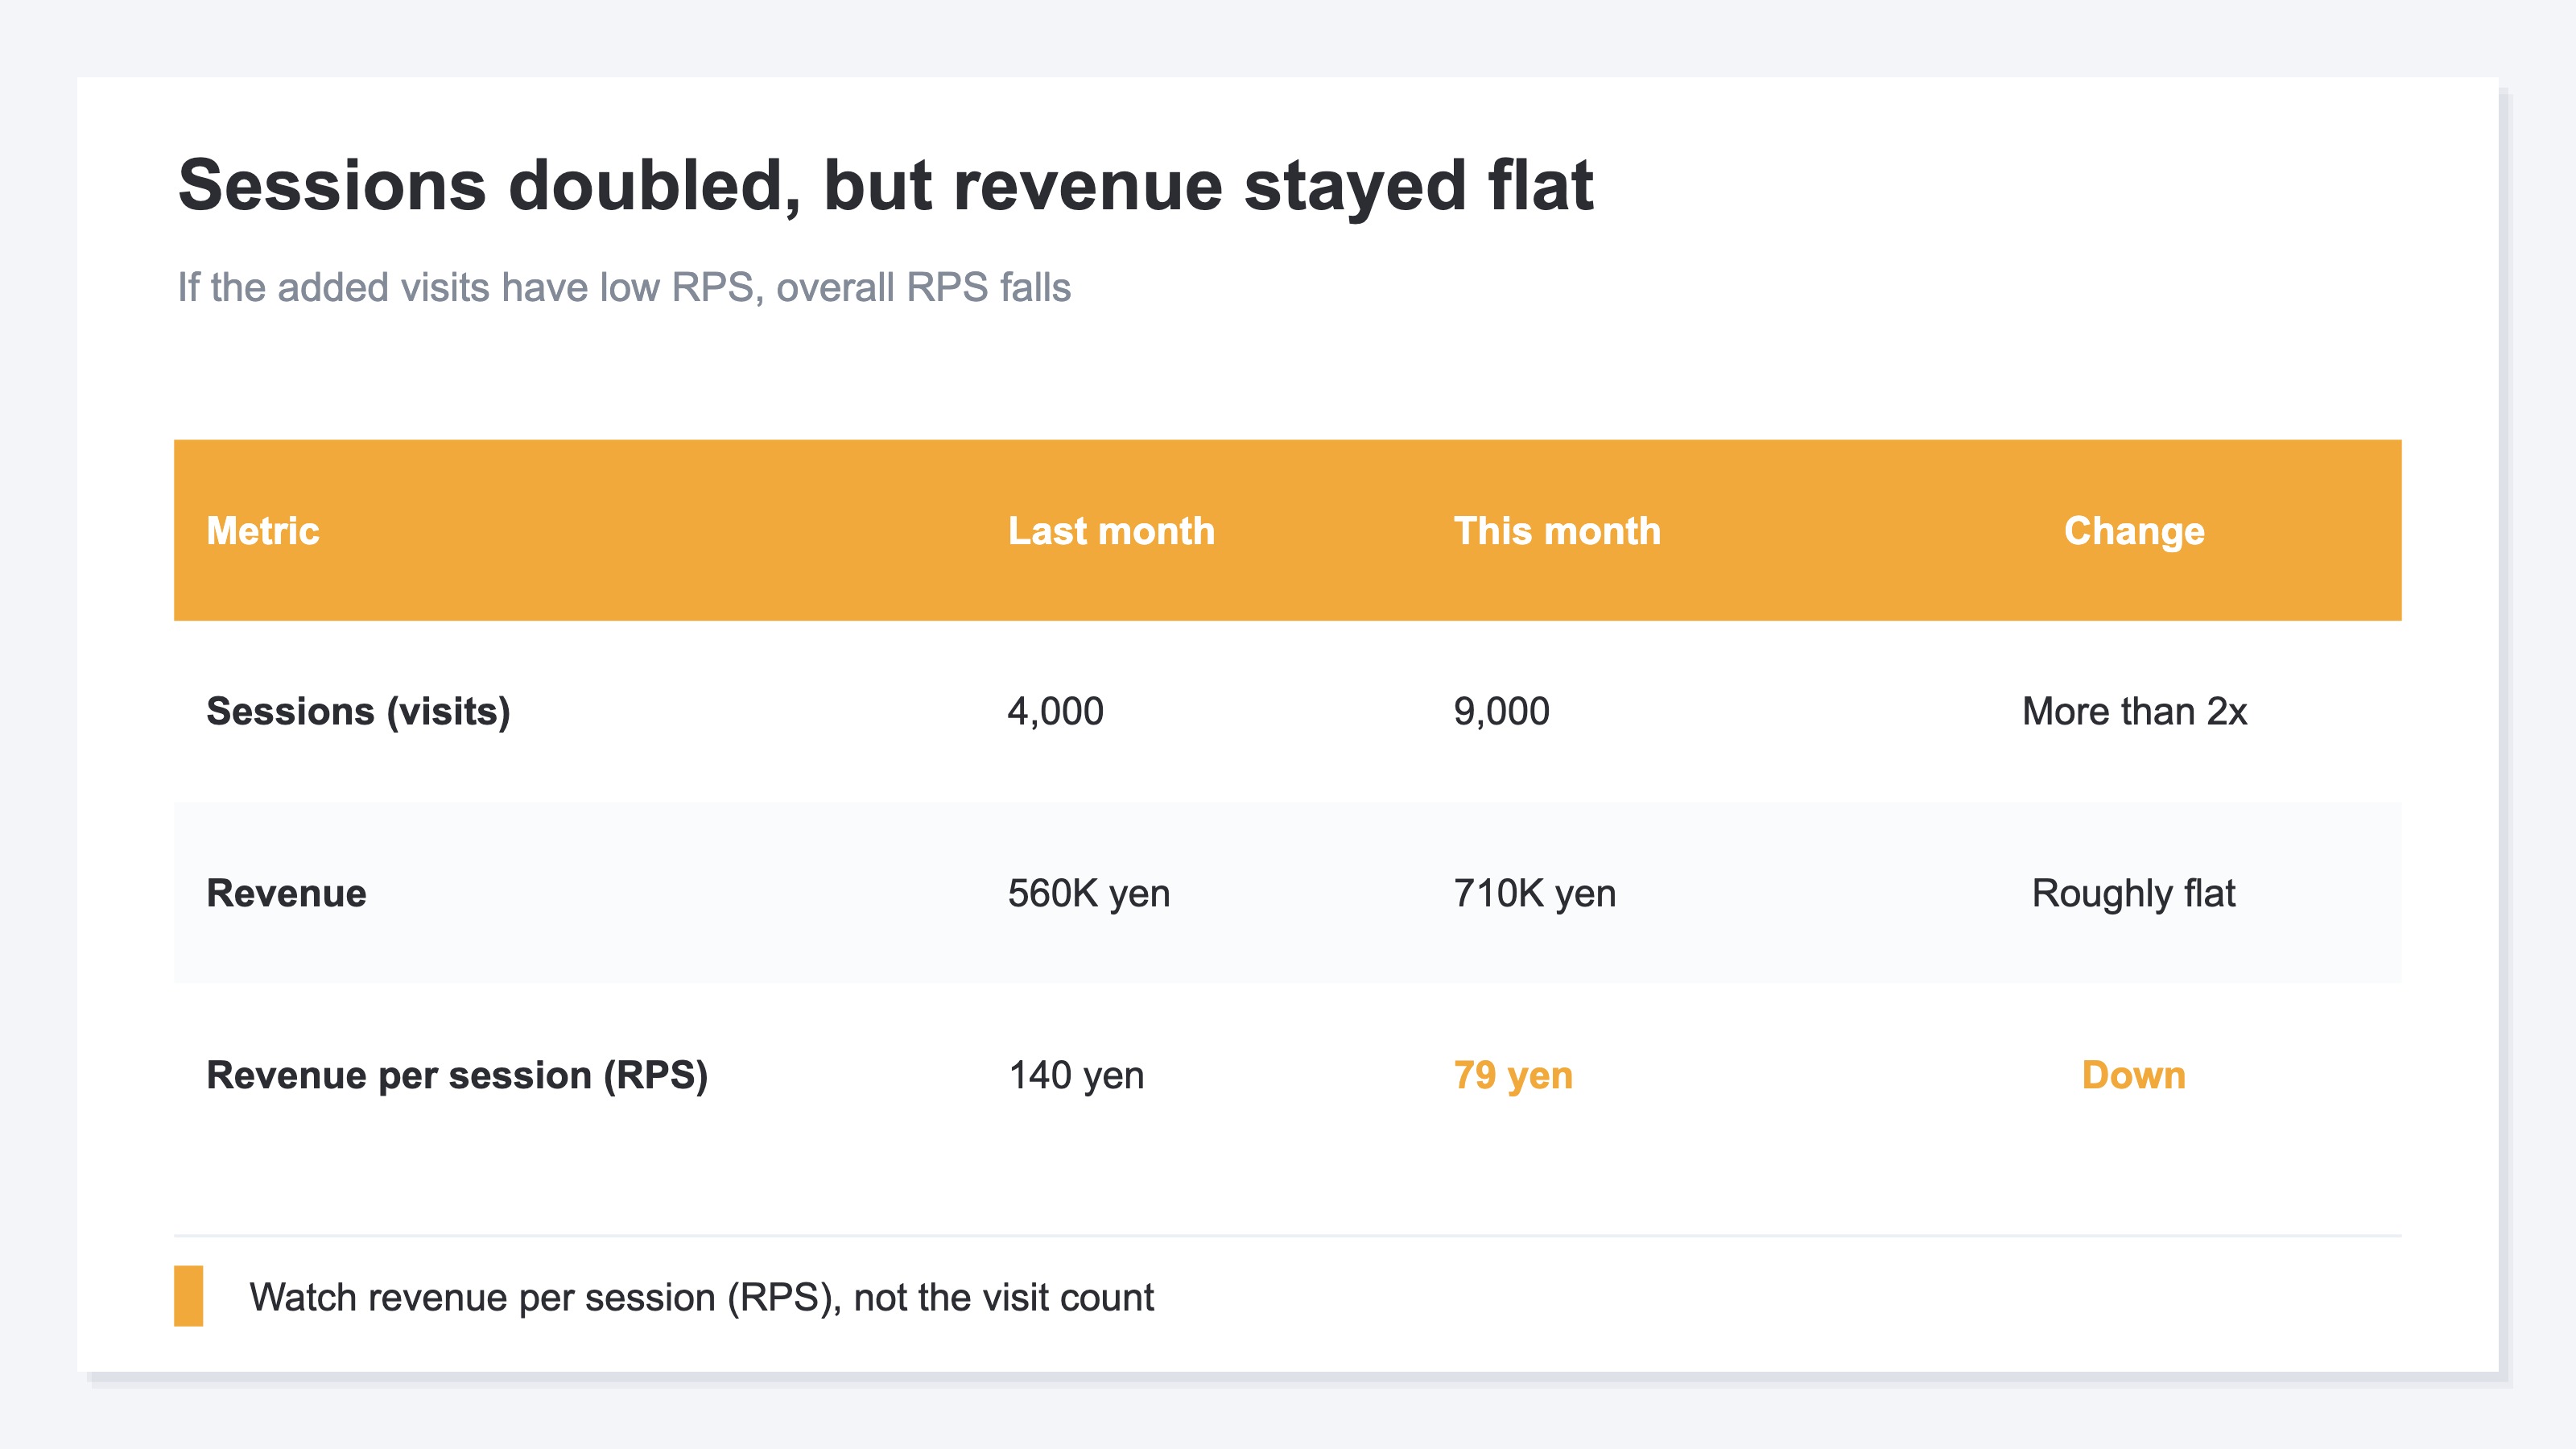
Revenue is roughly decided by "the number of visits × revenue per session (RPS)." So it's tempting to think that if traffic (the number of visits) grows, revenue will grow too. But if the added visits have low RPS, the answer to that multiplication barely increases. For example, say a shop had 4,000 visits at an RPS of 140 yen, then added 5,000 visits through ads for a total of 9,000 visits. Traffic more than doubled. But if those added 5,000 visits had an RPS of 30 yen, the added revenue is only 150,000 yen worth. Overall RPS (the average) actually falls—from 140 yen to 79 yen.
What matters here is the fact that overall RPS is falling. Watch the visit count alone and you'll be satisfied that "traffic grew," but if RPS fell, that's a sign you only added "visits that don't generate revenue." So when traffic grew but revenue didn't, the starting point is to first check whether overall RPS has fallen.
2. RPS by channel shows where it got diluted#
In short, the cause of falling overall RPS can be pinned down by splitting RPS out by channel (the entry point of your traffic).
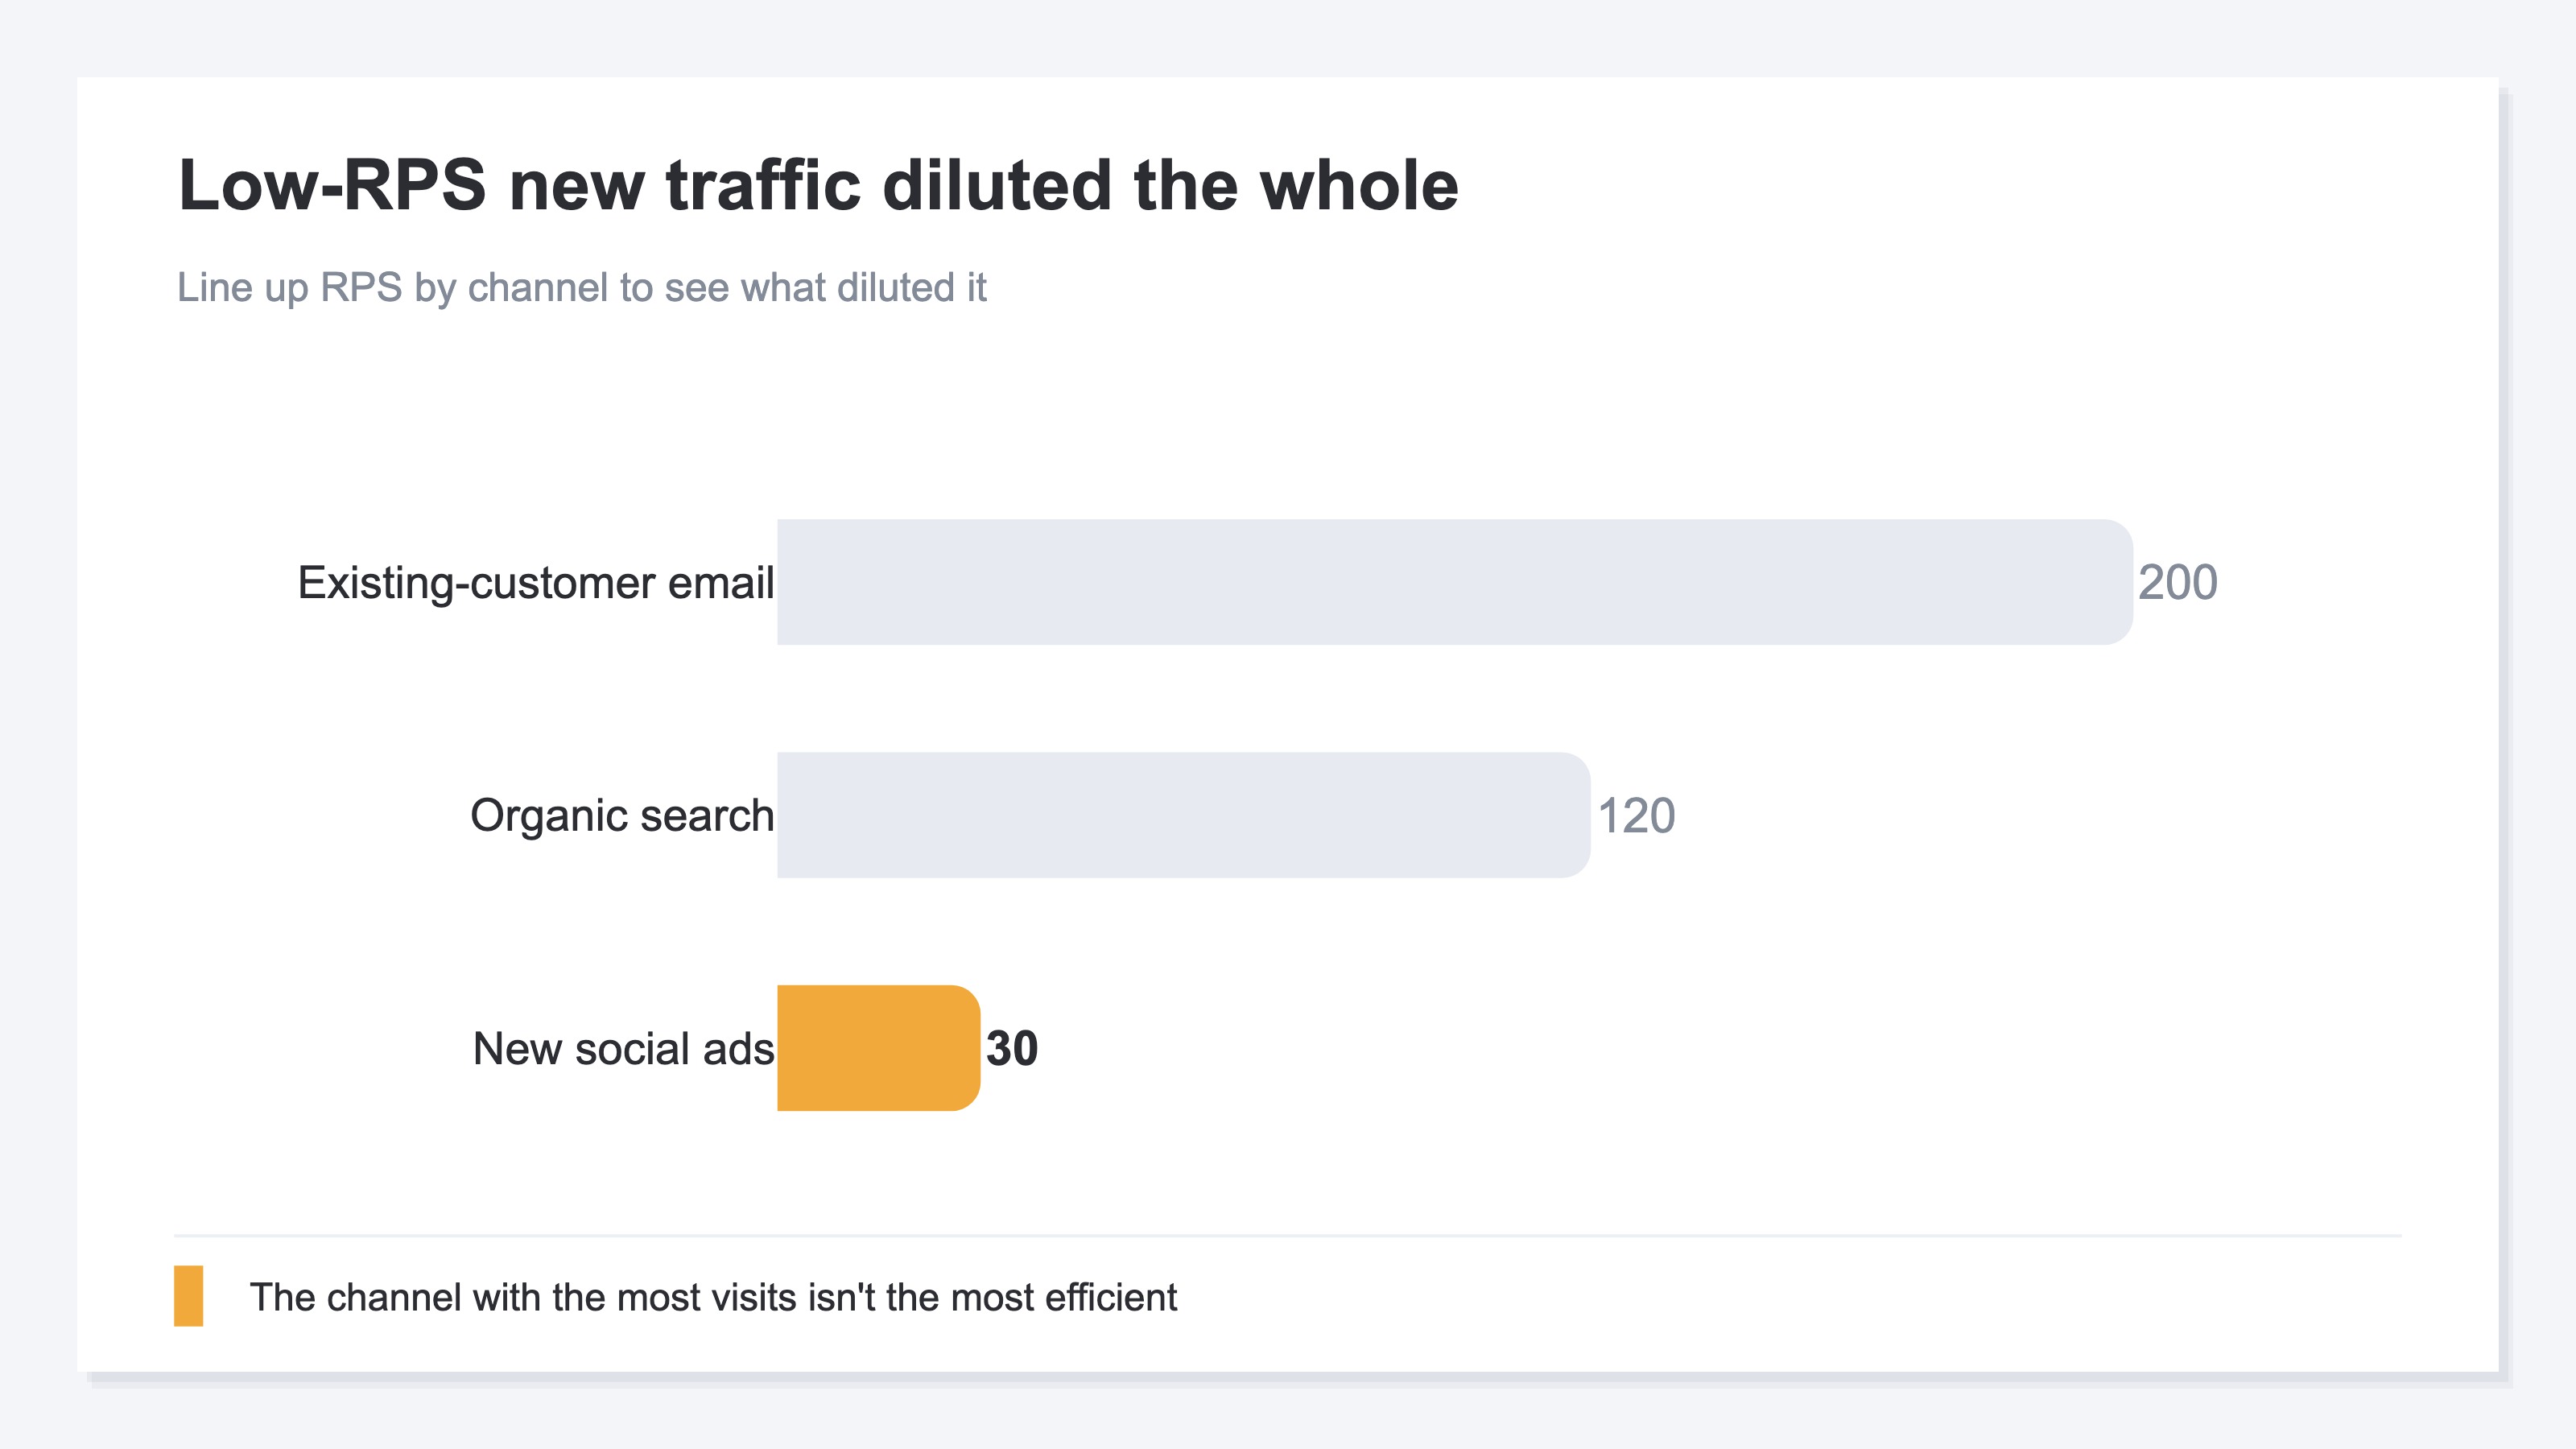
Overall average RPS is a number that mixes together visits from all sorts of entry points. Visits from organic search, from email, from ads—each has very different RPS. Look only at the mixed-together average and you can tell that "the whole fell," but not "which entry point is dragging it down." So you line up RPS by channel and compare.
For example, say organic search RPS is 120 yen, existing-customer email is 200 yen, and the newly added social ads are 30 yen. At a glance, you can see that the social-ad visits are diluting the whole. Social ads do rack up volume, but they bring a lot of "just took a look" visits before intent to buy has set in, so RPS tends to come out low. This isn't a case for "drop social ads." Because the base is large, lifting that low RPS even a little has a big revenue impact. Put the other way: if you only look at total traffic without splitting by channel, you miss the crucial signal of where things got diluted.
3. Leveling on the same terms every month is heavy by hand#
In short, the idea of comparing RPS by channel is simple. What's heavy is aligning that comparison to the right conditions and repeating it every month.
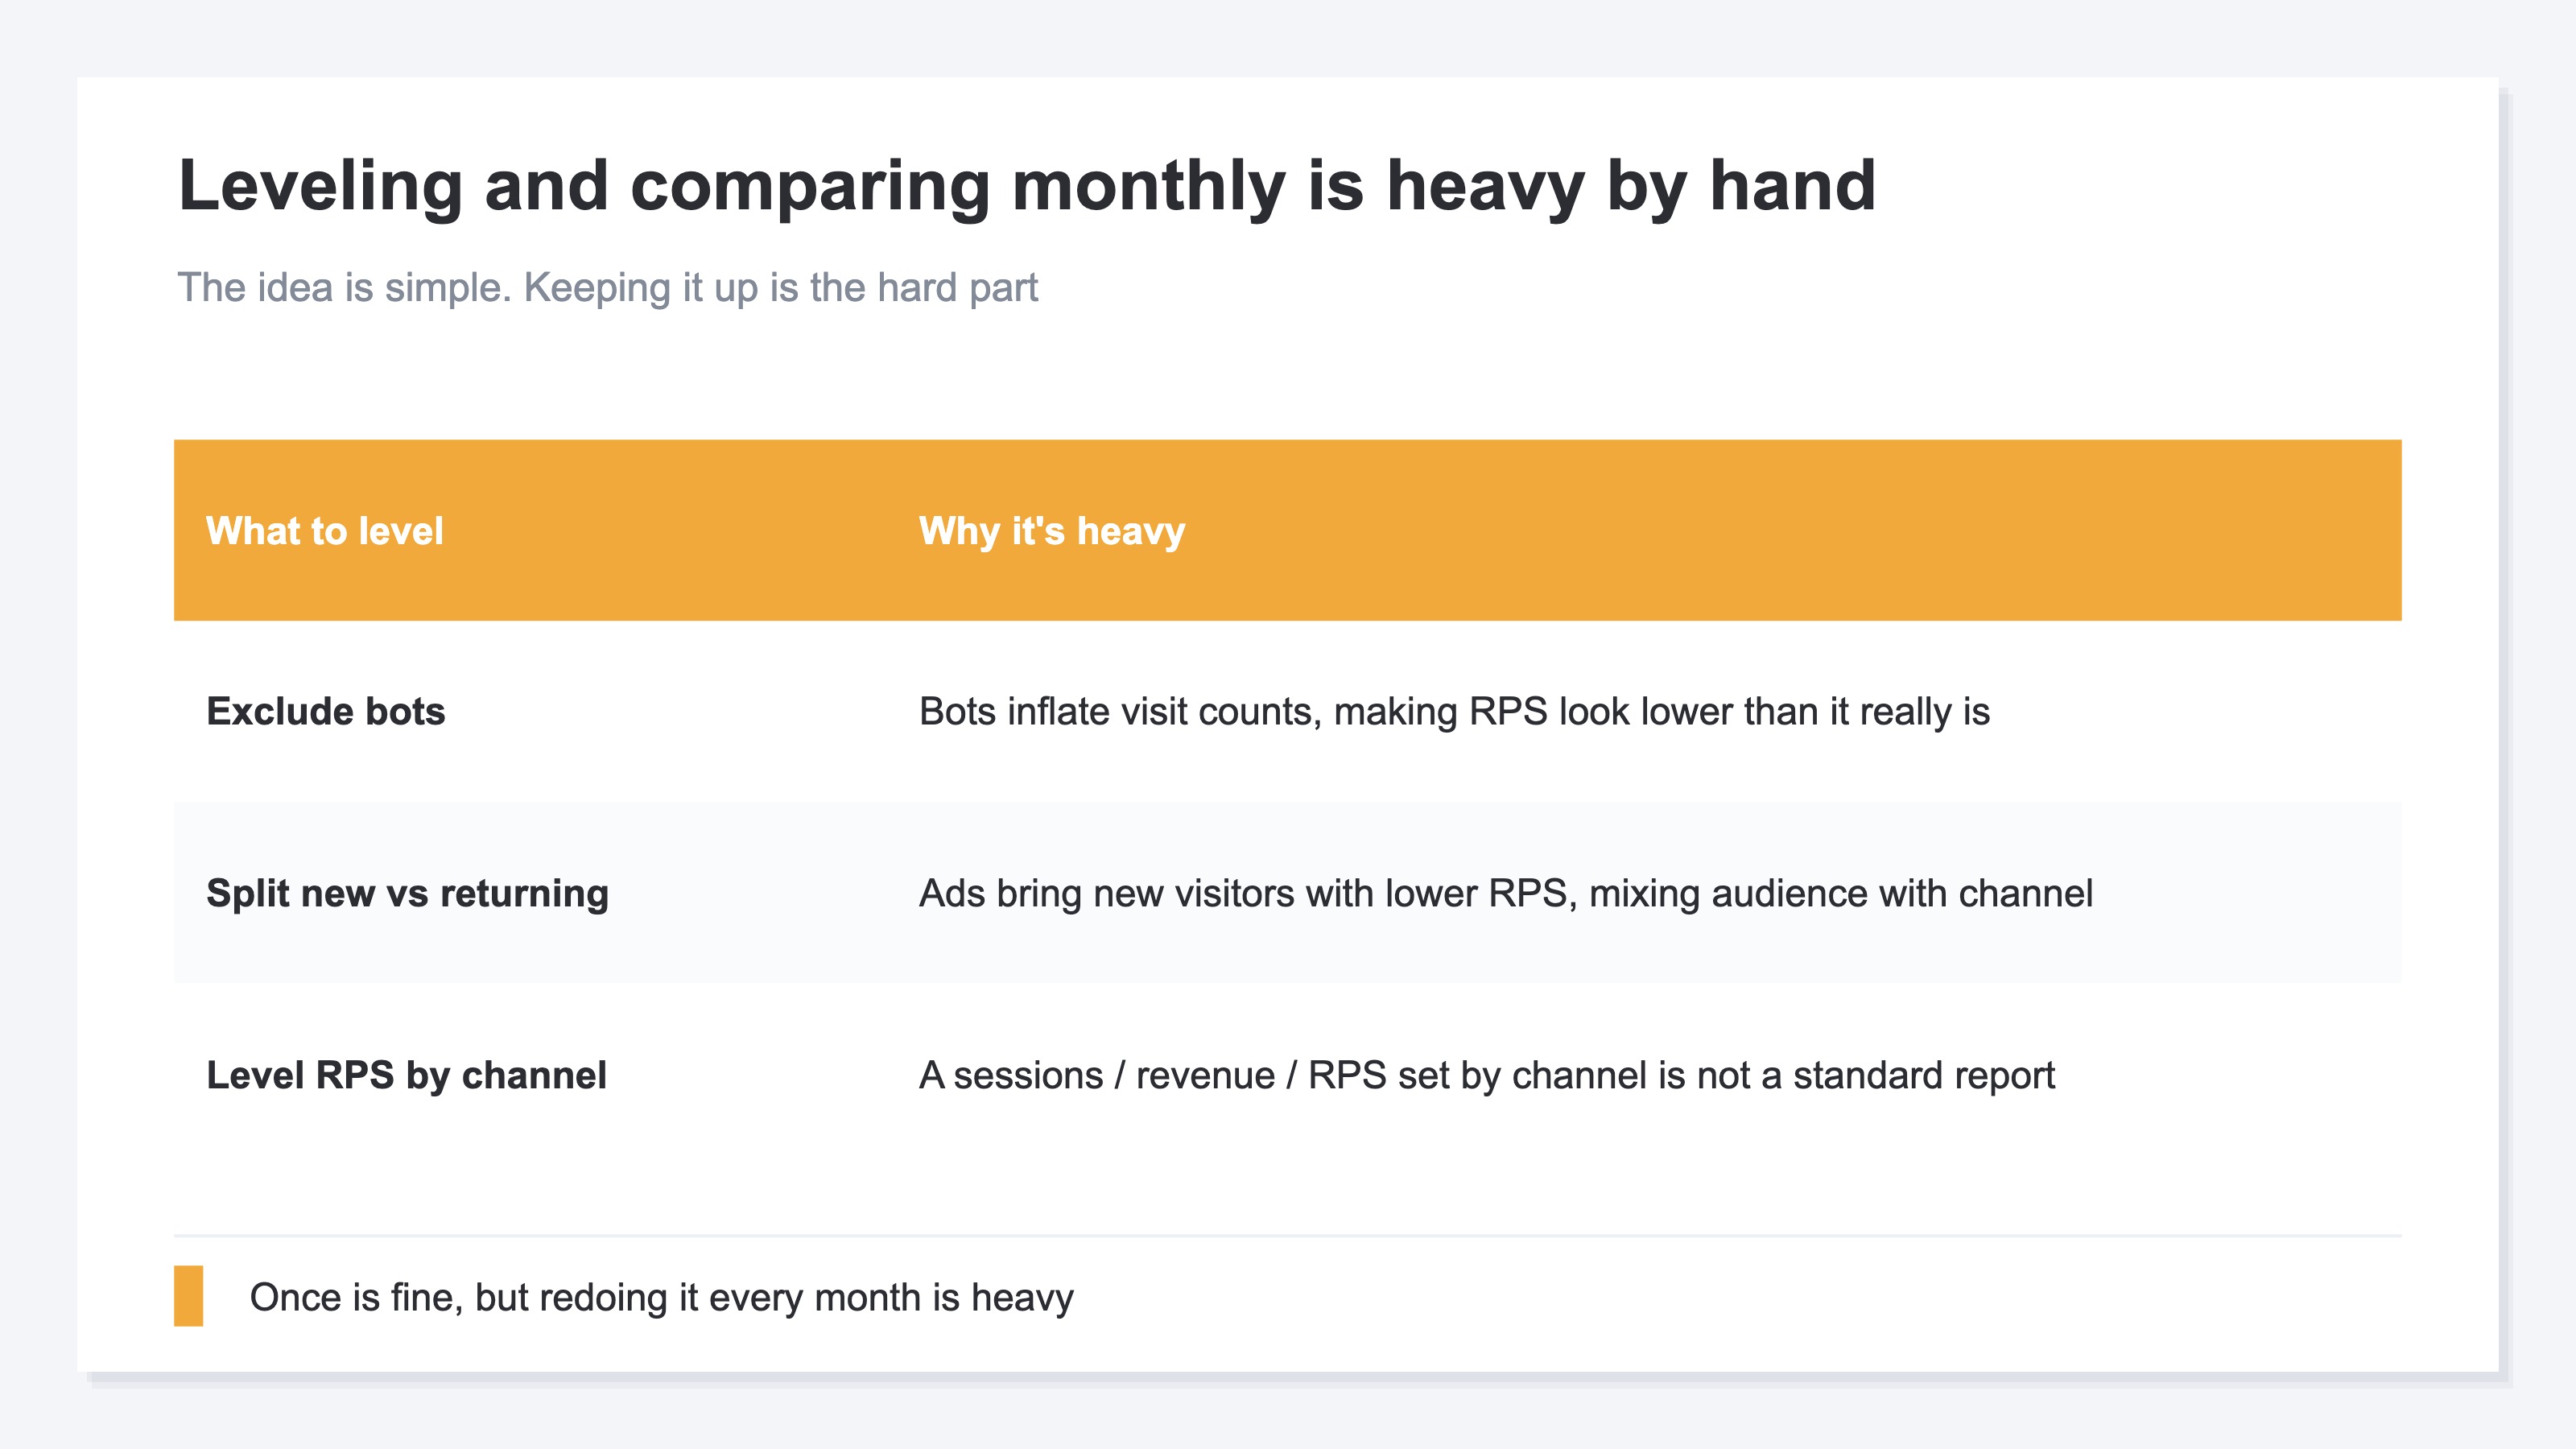
First, there's the work of cleaning the numbers. When automated-program (bot) traffic mixes in, only the visit count swells, making RPS look lower than it really is. The more suddenly traffic grows, the more you need to suspect whether bots have mixed into that increase. Next, the work of separating new from returning. What grows through ads is usually new visitors, and new visitors tend to show lower RPS than returning ones. Look without splitting them and you can no longer tell whether a gap is a channel difference or a customer-mix difference. On top of that, there's the work of aligning the metrics. A table that sets "sessions, revenue, and RPS" together by channel isn't offered in standard reports. So you have to combine the numbers and arrange them yourself.
Once is doable. But redoing this prep (excluding bots, splitting new/returning, aligning RPS by channel) every month, every time you run a campaign, and keeping the comparison going, is quietly heavy. The idea is simple, but keeping it up is hard—and that's why it's easy to lose sight of what the traffic growth really is.
RevenueScope — the solution
When you try to pin down why revenue isn't growing even though traffic did, you keep hitting the same wall. Exclude automated programs (bots), split new from returning. And then, can you compare each channel's revenue per session (RPS) on one screen, month after month? That's where the wall is.
RevenueScope takes that comparison off your hands. It shows each channel's (organic search, ads, email, and so on) sessions, revenue, conversion rate (CVR), and revenue per session (RPS) on one screen. The figures are after excluding automated-program (bot) traffic (the figures shown are demo data).
| Channel | Sessions | Revenue | CVR | Revenue per session (RPS) |
|---|---|---|---|---|
| Existing-customer email | 1,000 | ¥200,000 | 3.0% | ¥200 |
| Organic search | 3,000 | ¥360,000 | 1.5% | ¥120 |
| New social ads | 5,000 | ¥150,000 | 0.4% | ¥30 |
The thing to read in this table is what the added traffic really is. New social ads have the most sessions (5,000), yet their RPS is 30 yen—lower by an order of magnitude. This low-RPS traffic diluted last month's average RPS (140 yen) all at once—that's what's behind "traffic grew but revenue didn't." Align RPS by channel and you can see in numbers where it got diluted. From there, you have two moves. Go lift the RPS of social ads, where the base is large (fix the mismatch at the entry point), or invest more in the high-RPS email and organic search. Look at total traffic alone and you don't get this material to decide.
Let me be clear about one thing. What RevenueScope shows is efficiency on a revenue basis; the return on ad spend (ROAS) is calculated when you connect each channel's ad spend. It also does not calculate gross margin (profit after cost of goods) or inventory. What RevenueScope takes off your hands is excluding bots, splitting new from returning, then aligning RPS by channel on the same terms and preparing the material to tell where things got diluted. Where to start is your call.
FAQ#
Frequently asked questions#
Q. If traffic grew but revenue is flat, will it eventually catch up and grow?
A. It depends on the quality of the added visits. If what grew was "visits with intent to buy," they can turn into revenue later through return visits and browsing. But if all that grew was low-RPS traffic (like "just took a look" social visits), waiting won't naturally make it grow. That's exactly why the shortcut is to first check whether overall RPS has fallen and which channel diluted things, then fix the mismatch at the entry point.
Q. RPS or conversion rate (CVR)—which should I look at?
A. Both are useful, but the one that ties straight to revenue is RPS. Conversion rate looks only at "the share of people who bought" and doesn't include how much they bought (order value). RPS reflects both conversion rate and order value—the revenue per single visit. When traffic grows but revenue doesn't, the easiest order is to look at the change in RPS first, then split out its breakdown afterward (whether conversion rate fell or order value fell).
Q. Do bots really mix in that much?
A. It depends on the site and the period, but they can mix in at a share you can't ignore. Especially right after running ads, or when traffic suddenly grows, it's worth suspecting whether that increase includes bots or invalid clicks. If you calculate RPS before excluding bots, only the visit count swells and RPS looks lower than it really is, which can lead you to wrongly judge that "the traffic quality is poor."
Summary#
The reason revenue doesn't grow even though traffic did is that the added visits are "visits that don't buy." Revenue is decided by "the number of visits × revenue per session (RPS)," so even if the count grows, if RPS is thin, revenue barely increases.
So the first thing to check is overall RPS. If traffic grows but RPS falls, that's a sign you added visits that don't generate revenue. Next, split RPS out by channel and pin down which entry point diluted the whole. In many cases, the newly added ad or social traffic shows low RPS.
Exclude bots, split new from returning, and align RPS by channel on the same terms. Because repeating that every month is heavy by hand, taking it off your plate lets you judge—by numbers, not by gut—whether the added traffic is really generating revenue.
Related articles#
- How to Pin Down Why EC Revenue Dropped
- Spotting LPs That Sell: Compare by Revenue Efficiency
- What Is RPS (Revenue Per Session): Calculation and Use
References#
- [1] Google Analytics Help "About ecommerce metrics" (2026)
- [2] Google Analytics Help "[Traffic acquisition] report" (2026)
See which ads actually drive revenue, at a glance
Free up to 5,000 sessions/month, AI analyst included. No credit card required. Up and running in 5 minutes.
Start measuring for free