
You put time into SEO, and traffic from organic search has been climbing. When you open your analytics, organic search has the most sessions of any channel. Surely, with this much traffic, SEO is working—that's what you want to believe.
But it's worth pausing here, on one question: is organic search actually contributing to revenue? Because having a lot of traffic and that traffic generating revenue are two different things. If most of those visitors just look and leave, there's no revenue. This article walks through, in order, why traffic count alone can't tell you about contribution, what it means to look at a channel's value through revenue per session (RPS), and why doing that comparison by hand turns out to be heavy.
Contents
This article in brief#
- Organic search having a lot of traffic and that traffic contributing to revenue are two different things. Even with plenty of visits, if many just look and leave, there's no revenue
- Whether a channel is earning shows up not in visit count but in revenue per session (RPS, the average revenue generated per visit). Compare organic search's RPS against other channels like ads and social, and its standing becomes clear
- But lining channels up and comparing them on the same RPS basis is heavy work by hand. Automated-program (bot) traffic and revenue of unknown origin both add to the effort of leveling things out
1. Why "more traffic" doesn't always mean "more contribution"#
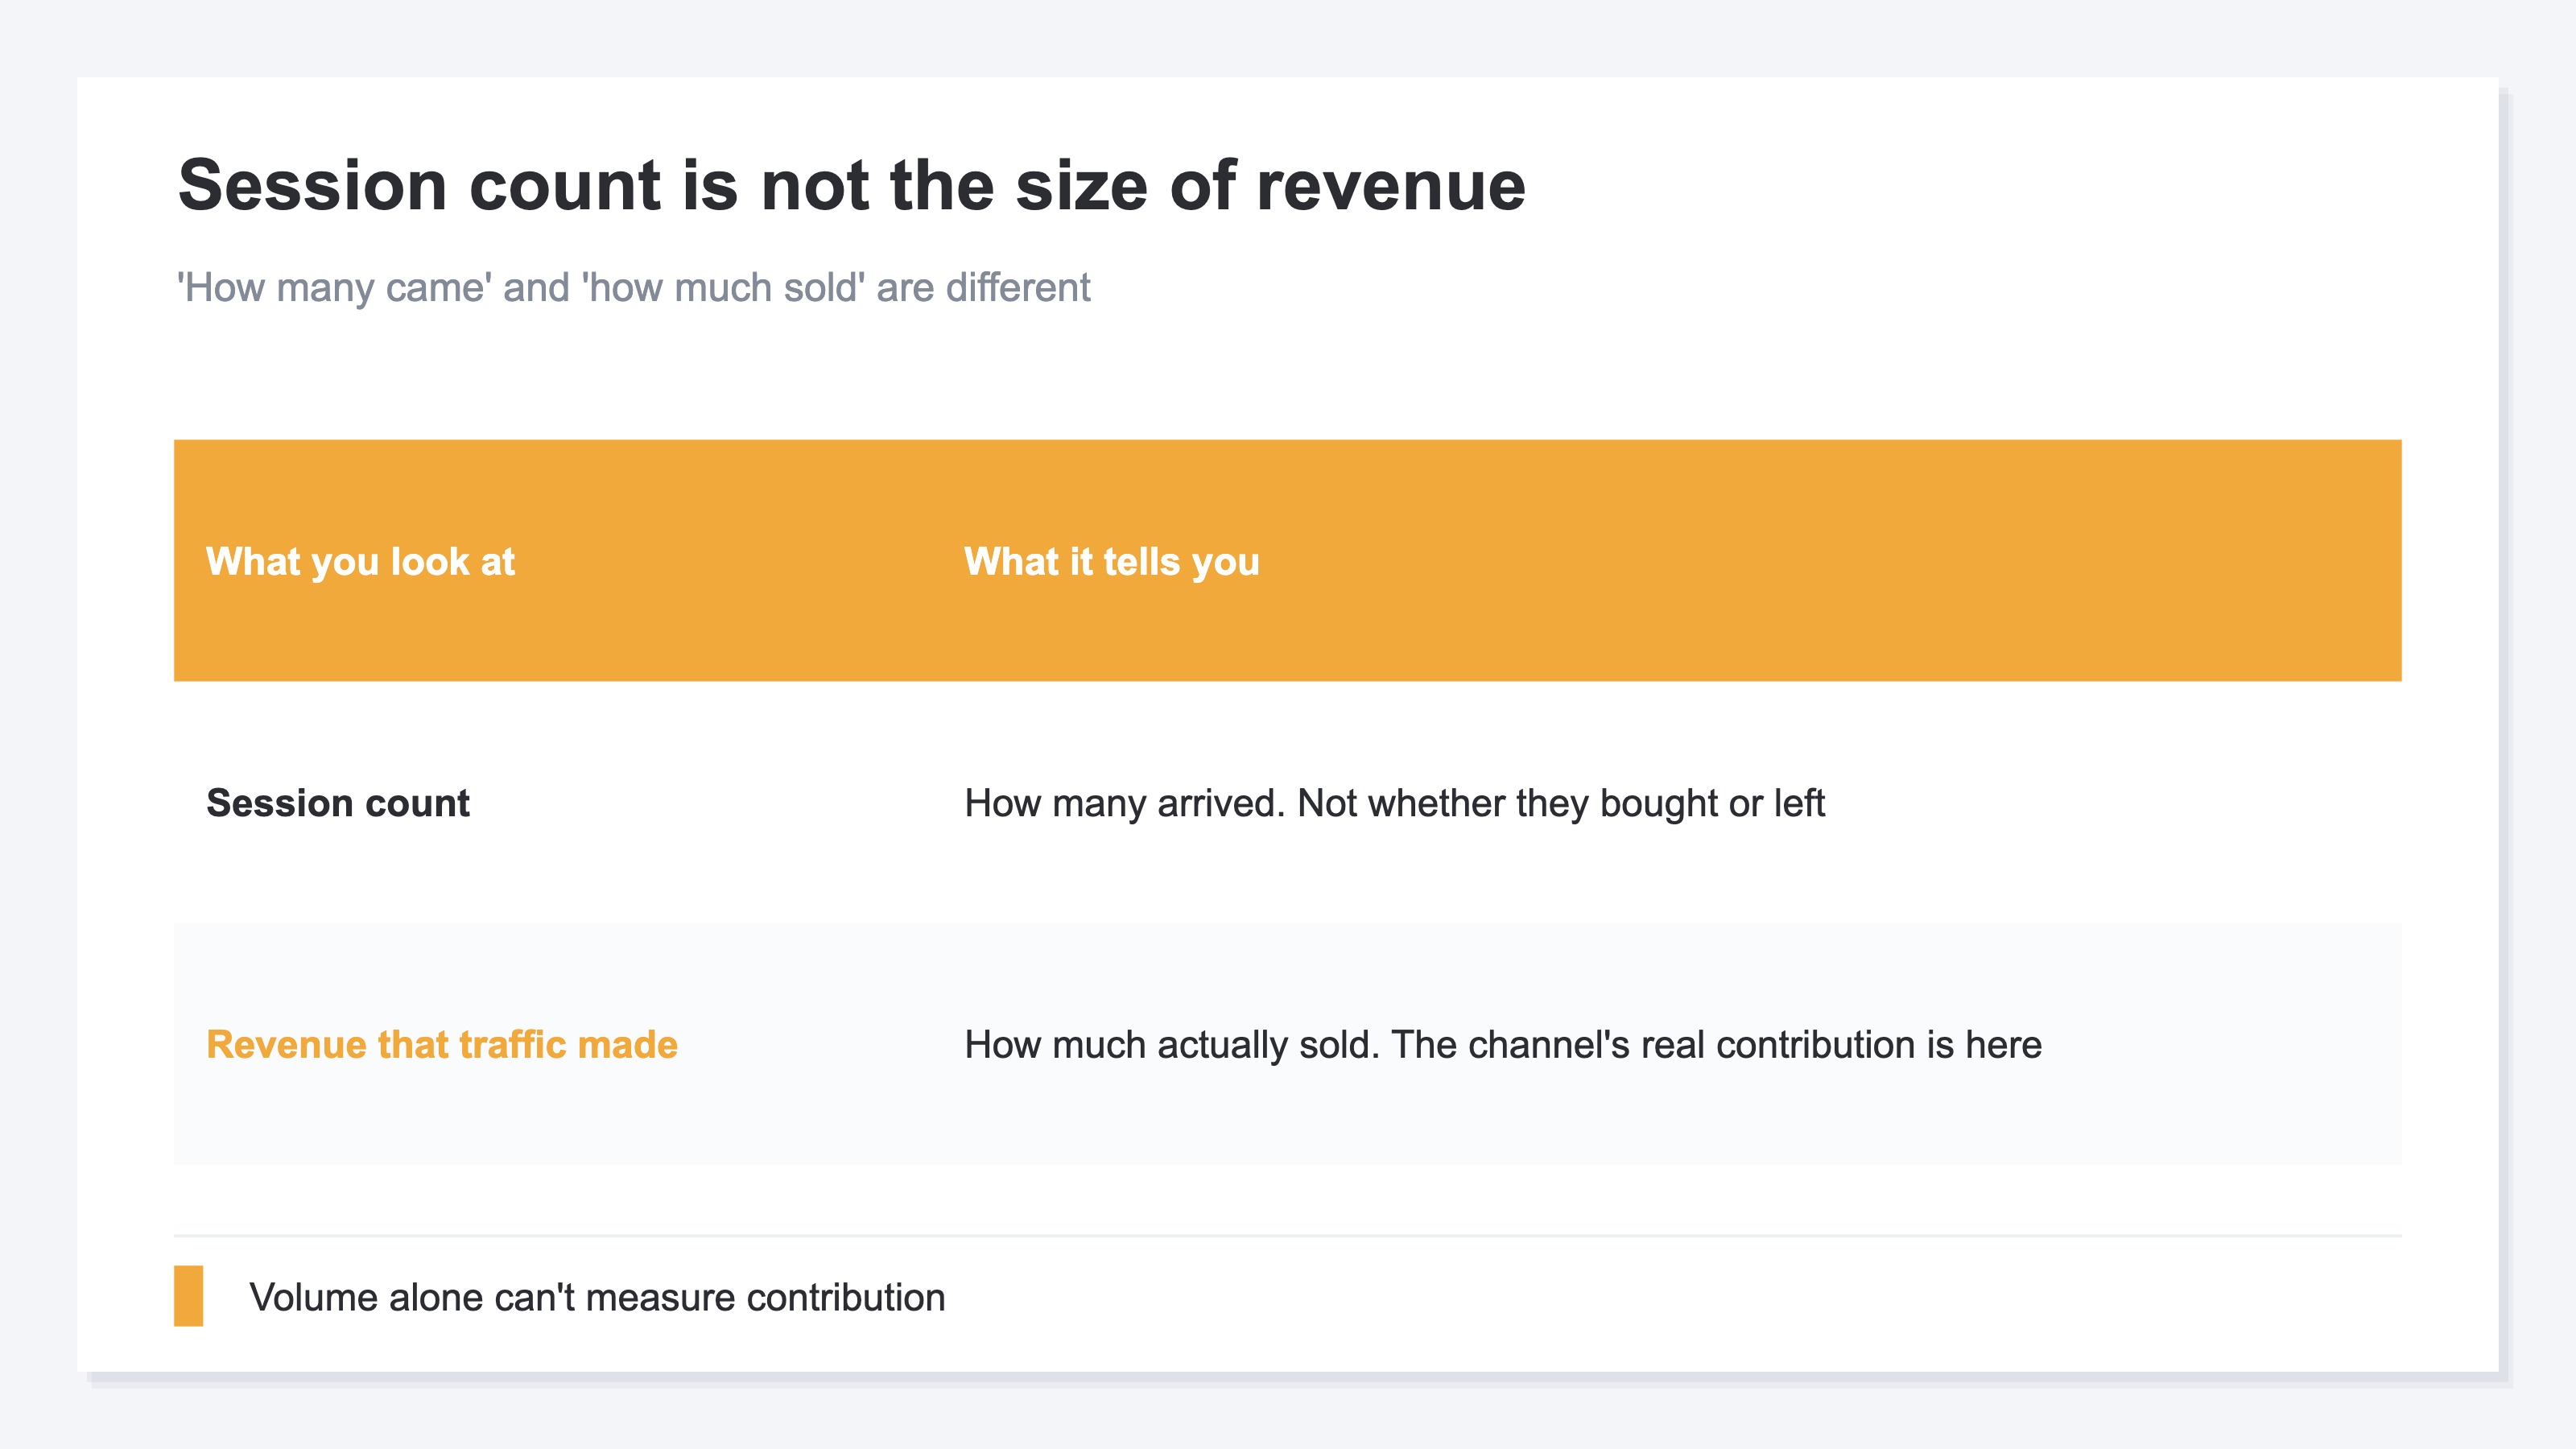
In short, even if organic search has the most traffic, it isn't necessarily the biggest contributor to revenue.
When you open your analytics, session counts line up by channel. When organic search sits near the top, it's tempting to read it as "this is what's working best." But a session count is "how many came," not "how much sold." Whether the people who came just looked and left, or actually bought—you can't tell from session counts alone.
In fact, some people say they don't even mind when traffic drops. The way people search has shifted: those who were only looking things up now get satisfied by AI answers and stop coming, while the people who still bother to visit the site are narrowed down to more "buy-minded" visitors. In other words, even if traffic falls, if the quality of the people coming rises, revenue can hold steady. Conversely, even with lots of traffic, if the quality doesn't follow, it isn't contributing to revenue as much as the numbers suggest. So to measure organic search's contribution, you need to lift your eyes from session counts and look at "how much revenue that traffic is generating."
2. A channel's value shows up in revenue per session (RPS)#
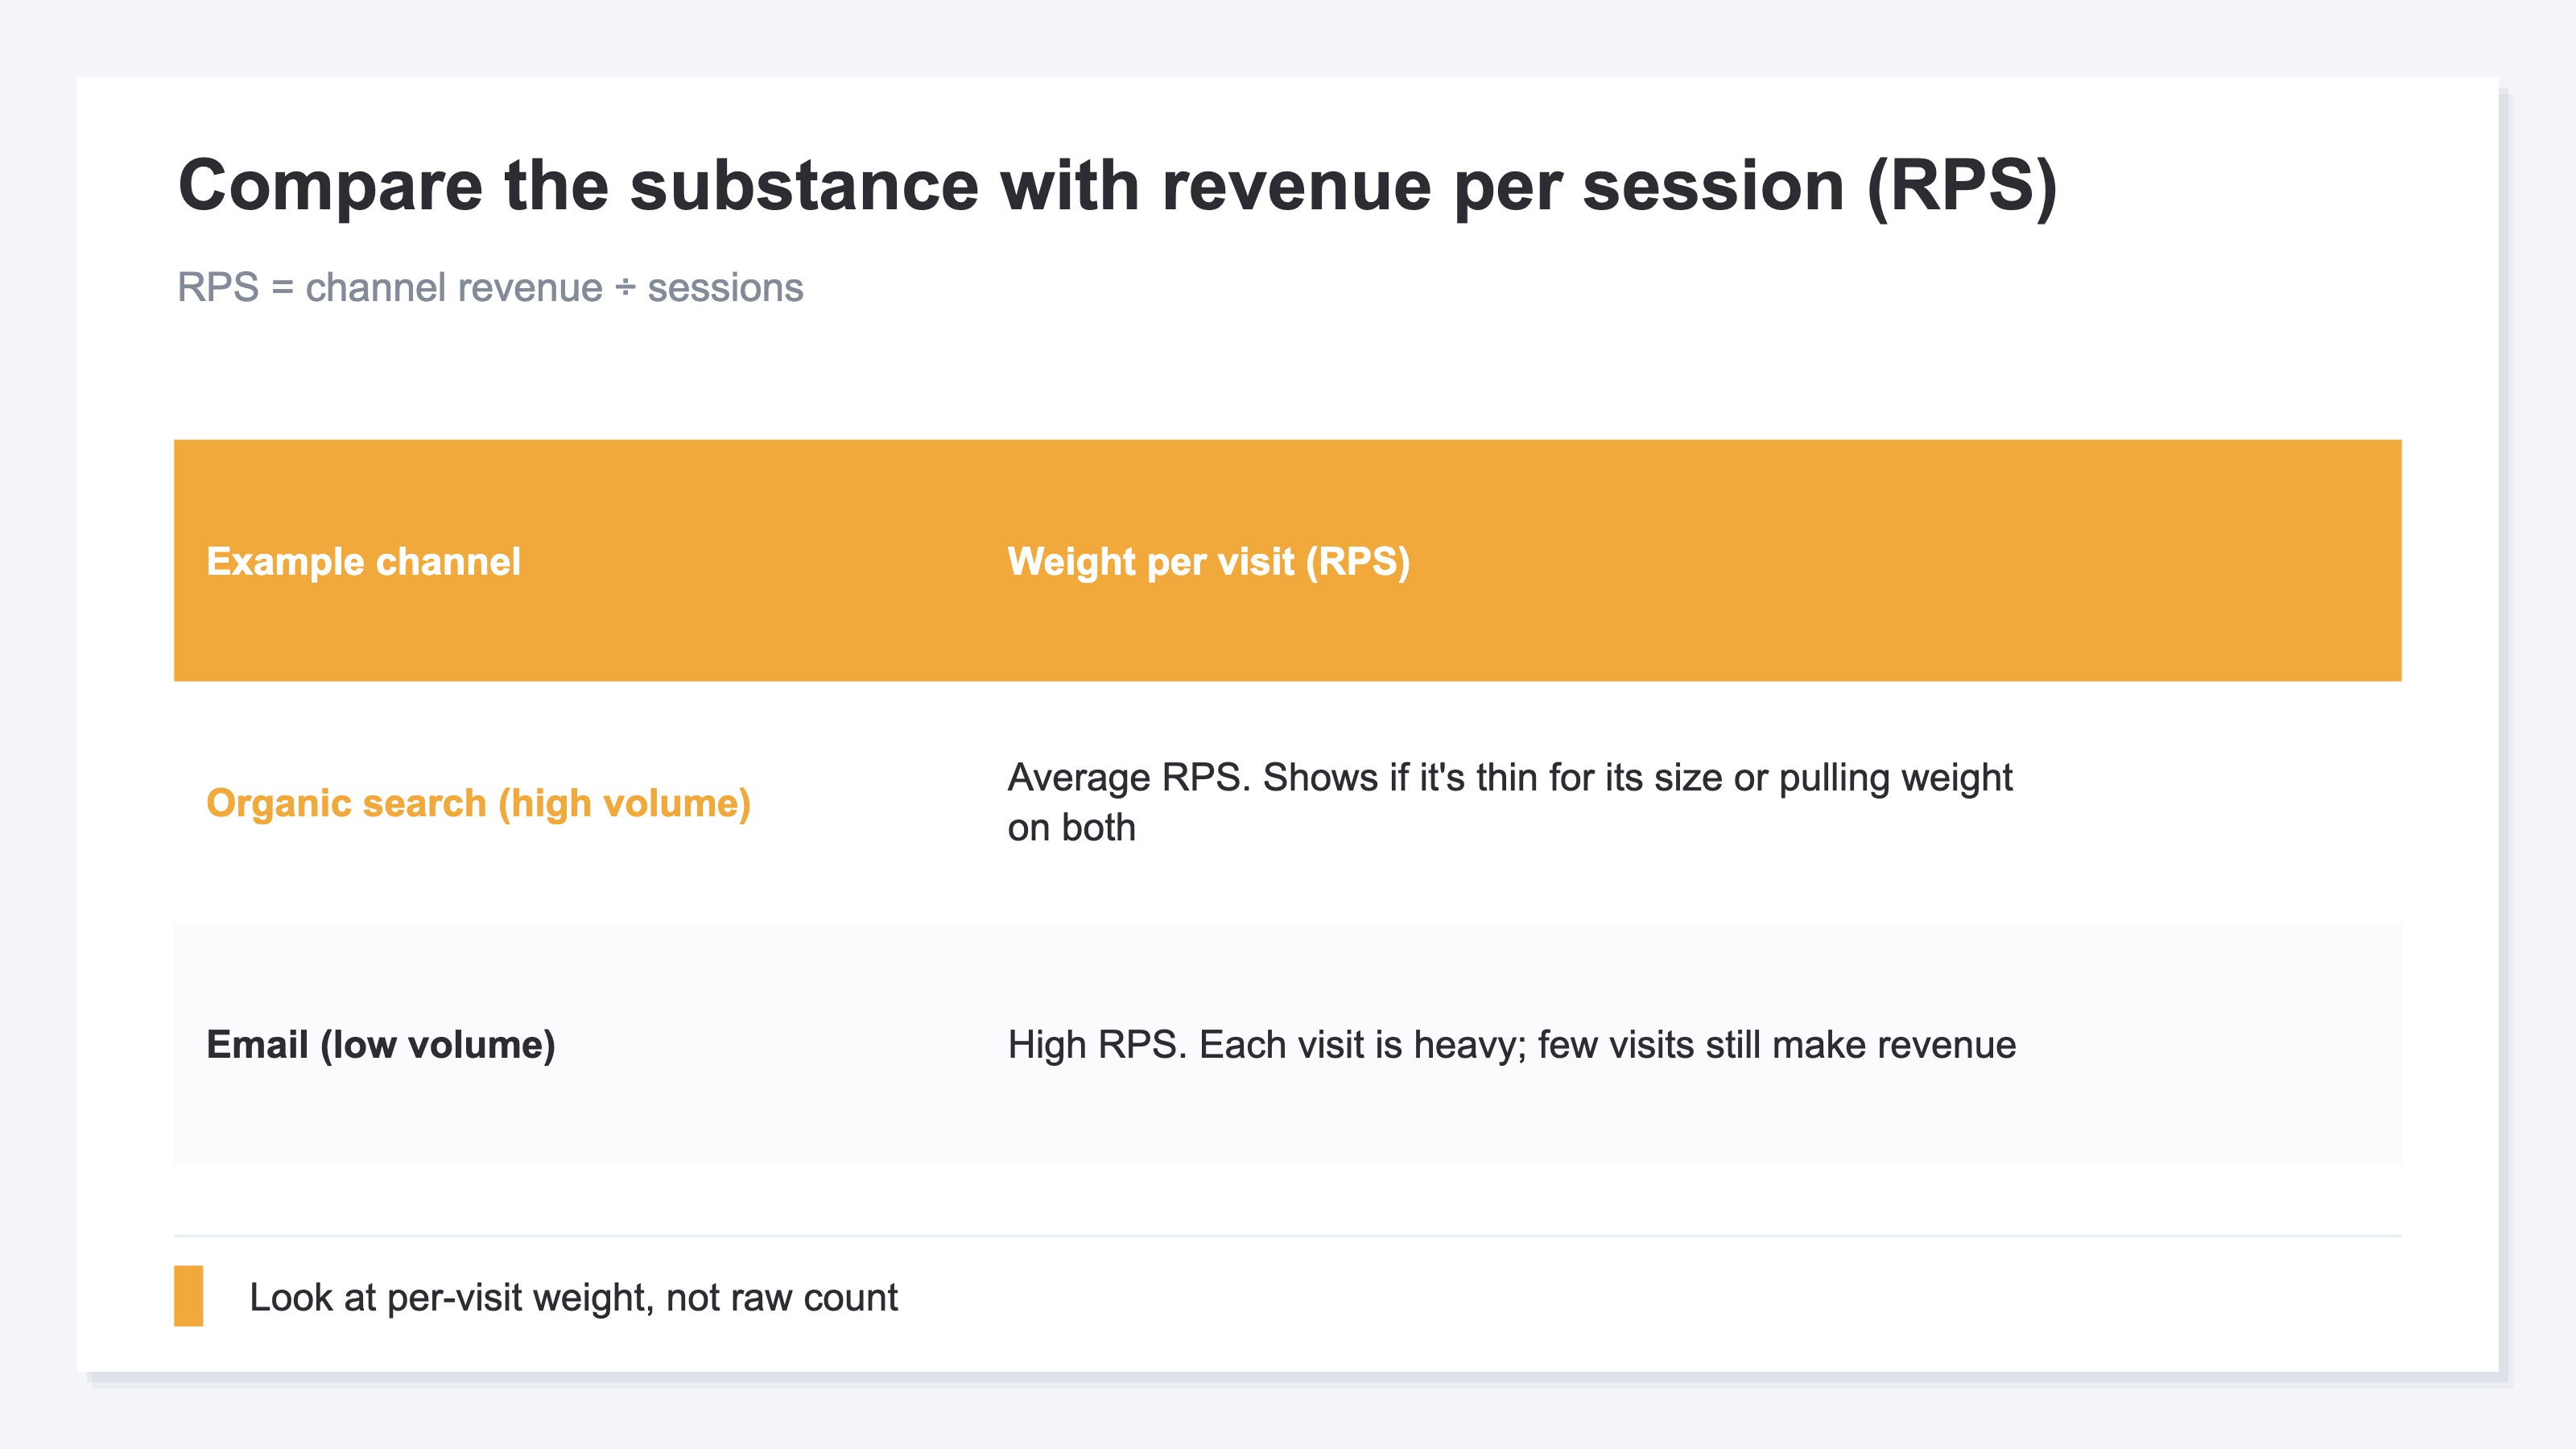
In short, whether a channel is earning becomes clear when you look at it through revenue per session (RPS).
RPS stands for Revenue Per Session—the average revenue generated per visit. The calculation is simple: just divide that channel's revenue by that channel's session count. Using it, you can compare channels by "substance" rather than by "count." For example, organic search might have lots of sessions but an ordinary RPS, while email has few sessions but a high RPS—so the weight of a single visit comes into view, channel by channel.
Look at it this way, and organic search's standing becomes clear. If it has the most sessions yet an RPS clearly lower than other channels, you can tell it's traffic that's "high in count but thin per visit." Conversely, if its RPS is decent too, it's a dependable channel working on both volume and quality. The key is not to look at organic search alone, but to compare RPS side by side against other channels—ads, social, email. Only by lining them up can you judge whether "this traffic is earning for its volume, or not."
3. Lining channels up side by side is heavy by hand#
In short, comparing channels on the same RPS basis is, in itself, surprisingly heavy work by hand.
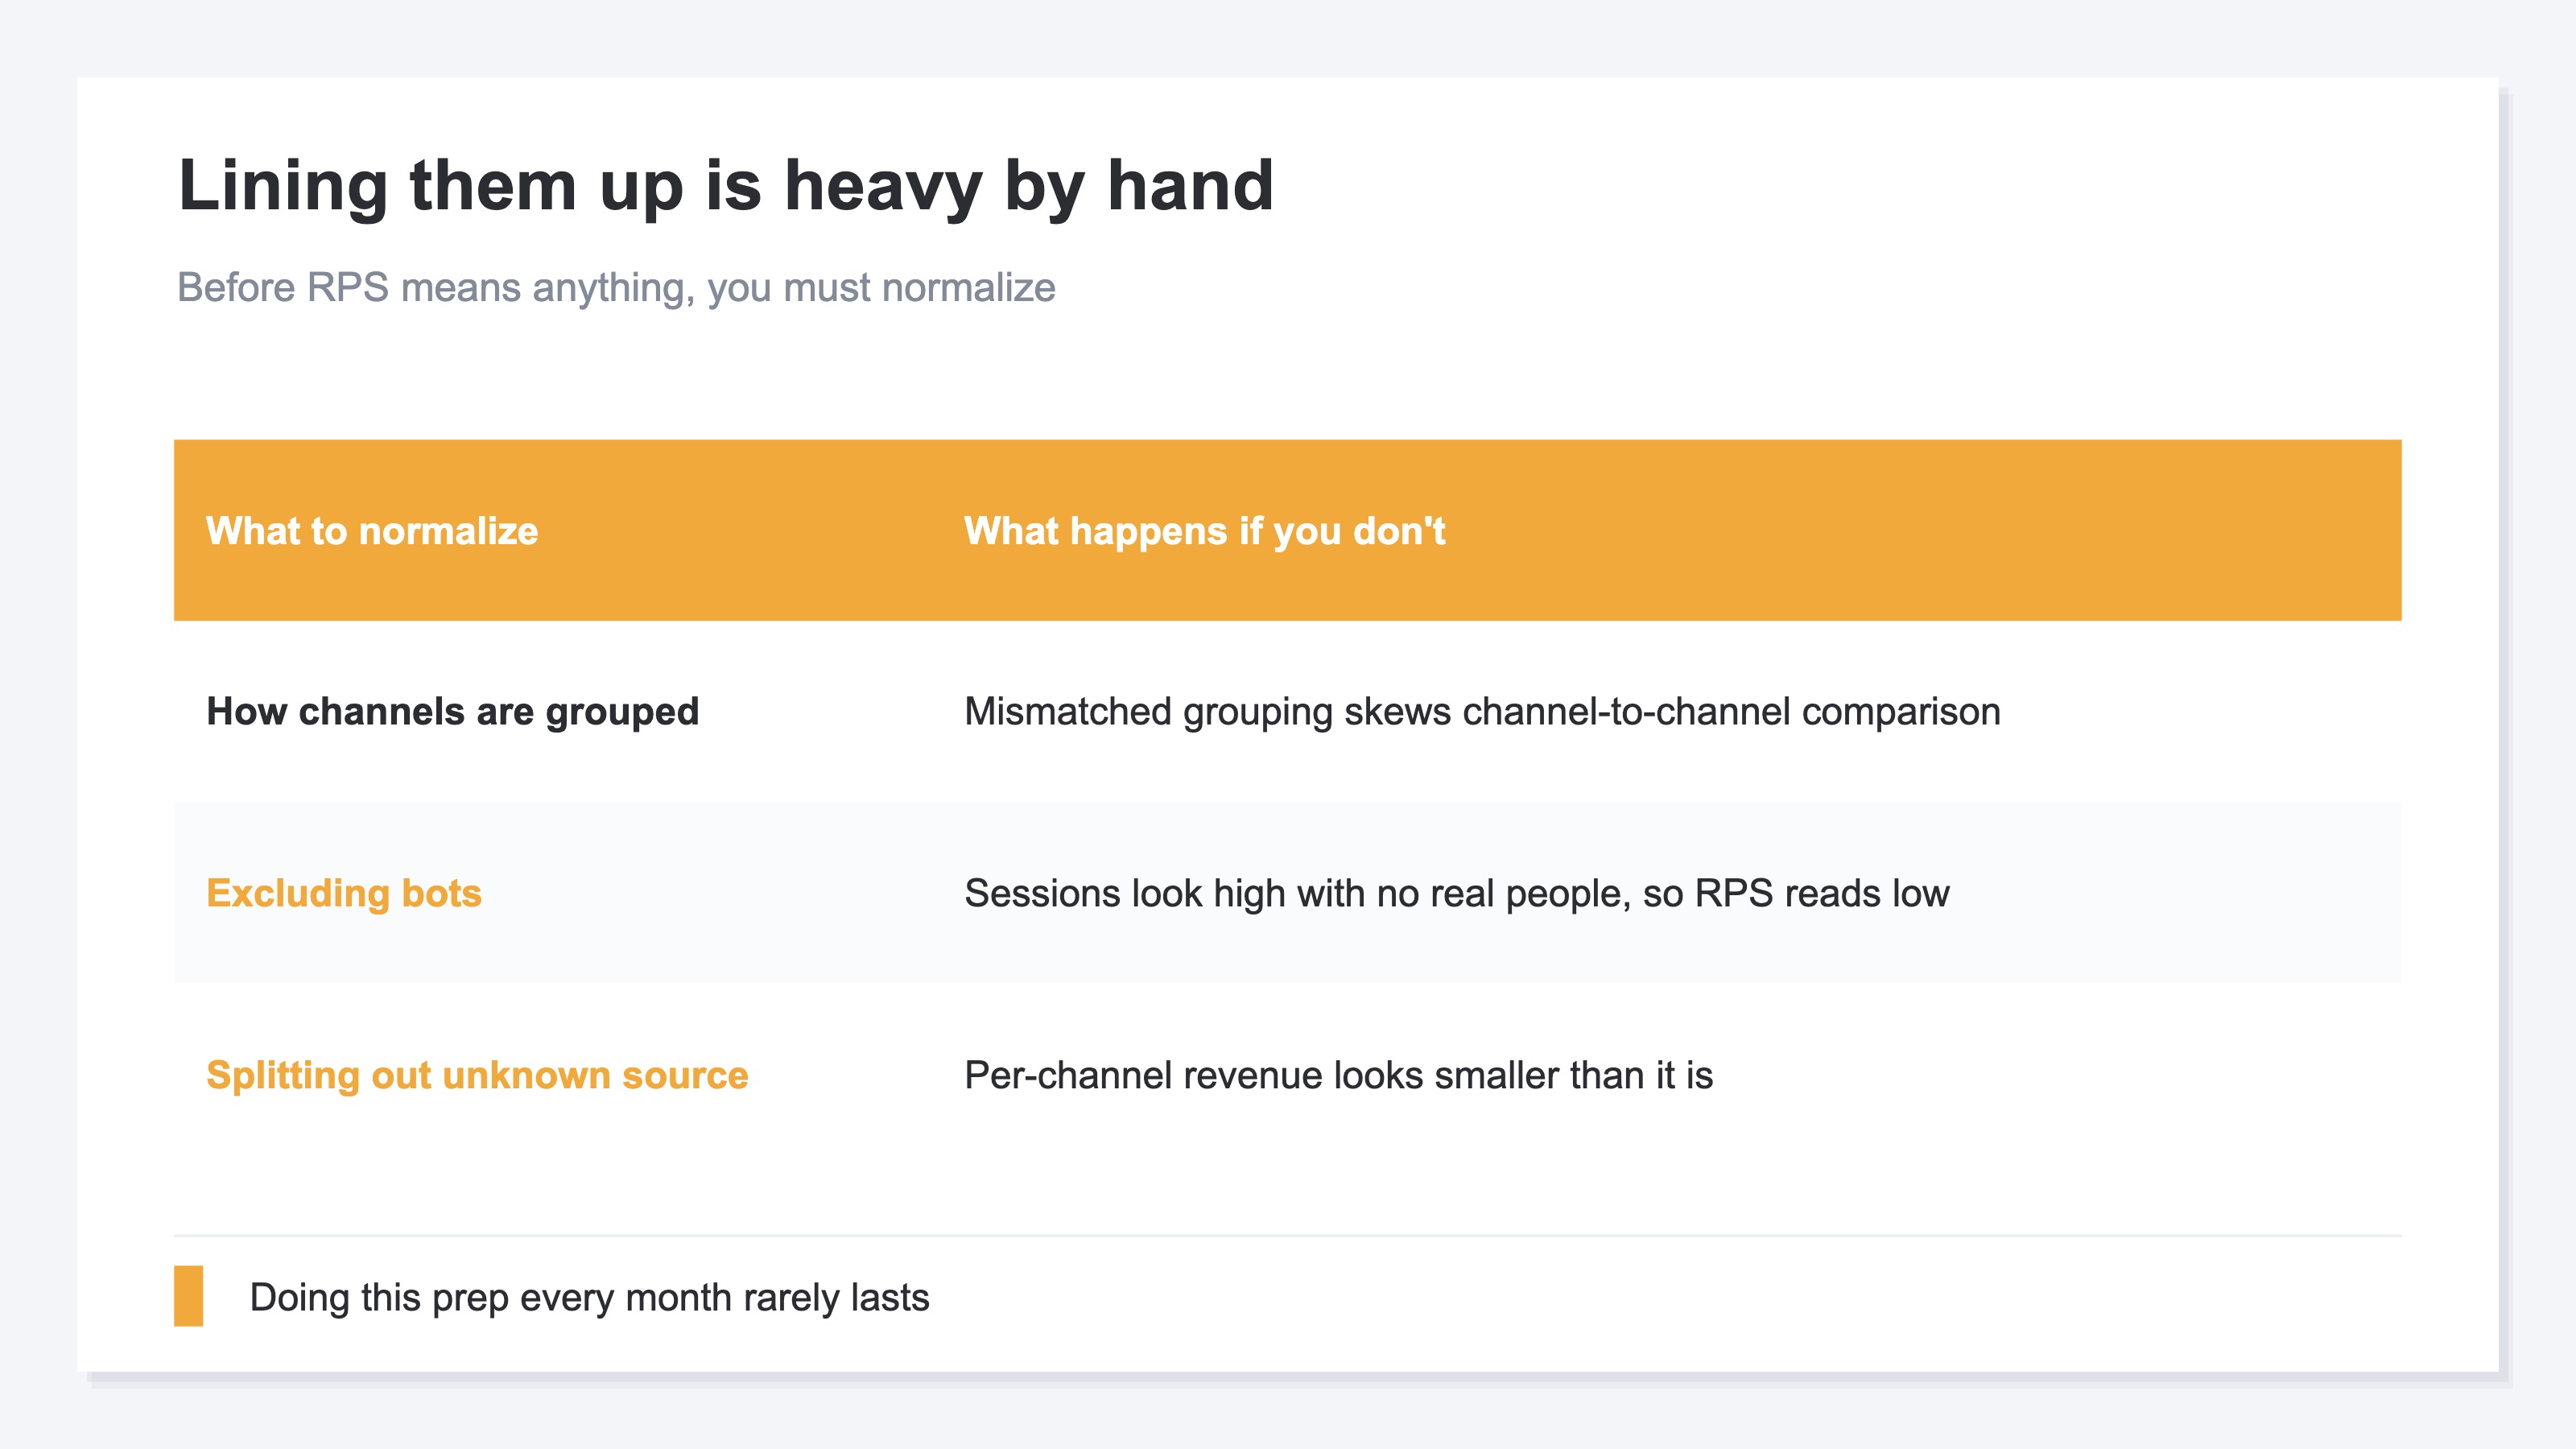
The idea isn't difficult. Analytics like GA4 will show you sessions and revenue by channel. Pull that out, divide revenue by sessions, and you have RPS. Just once, you can copy it into a spreadsheet and compute it quickly. The problem is whether you can keep that aligned, accurately, every month.
There are several places to trip up. First, unless you standardize how channels are grouped, the comparison drifts. Next, when automated-program (bot) traffic is mixed in, sessions look high even though no real person came, and RPS comes out lower than it really is. Furthermore, when there's revenue of "unknown origin"—where you can't tell which channel it came through—the per-channel revenue looks smaller than it really is. Only once you've leveled these out does the side-by-side RPS start to mean something. The idea is simple, but doing this prep every month and keeping all channels lined up is hard to sustain by hand. That's where it trips you up.
RevenueScope — the solution
When you try to pin down whether organic search is earning, you keep hitting the same wall: can you line channels up on the same RPS basis, level out bots and unknown origin, and compare them month after month?
RevenueScope takes that comparison off your hands. It shows each channel's sessions, revenue, and revenue per session (RPS) side by side. The figures are after excluding automated-program (bot) traffic, and revenue that didn't tie to any channel—"unattributed"—is split out as a separate row (the figures shown are demo data).
| Channel | Sessions | Revenue | Revenue per session (RPS) |
|---|---|---|---|
| Organic search | 8,000 | ¥640,000 | ¥80 |
| Ads | 3,000 | ¥360,000 | ¥120 |
| Social | 5,000 | ¥150,000 | ¥30 |
| 1,200 | ¥240,000 | ¥200 | |
| Unattributed | — | ¥120,000 | — |
The bottom row, "Unattributed," is revenue that didn't tie to any channel. Splitting it out as a separate row prevents per-channel revenue from looking smaller than it really is (since it isn't tied to sessions, no revenue per session is shown).
The thing to read in this table is organic search's standing. It has the most sessions at 8,000, and the largest revenue at ¥640,000. Its RPS is ¥80—lower than ads (¥120) or email (¥200), but higher than social (¥30). In other words, organic search is "high in count and not bad per visit": a channel working on the balance of volume and quality. If its RPS were as low as social's, it would be "high in count but thin" traffic—a signal to revisit the substance of your SEO. Lining things up this way, you can see whether organic search is really contributing—through numbers, not gut feeling.
What RevenueScope specializes in is the side-by-side comparison of per-channel revenue and RPS: whether organic search, as a channel, is earning compared with the others. It levels out bots and unknown origin and lines that material up on one screen. Keywords and rankings are the home of a search-side tool; RevenueScope focuses on "the channel's strength seen through revenue," showing it on the same yardstick month after month.
FAQ#
Frequently asked questions#
Q. If organic search traffic drops, is my SEO a failure?
A. Not necessarily. You can't judge success or failure from traffic (session) counts alone. The way people search has shifted, and it's happening that those who were only looking things up are dropping off, leaving the buy-minded ones. In that case, traffic may fall while revenue per session (RPS) actually rises. The key is not to swing with the ups and downs of traffic count, but to look at the revenue and RPS that traffic generated. If the count drops but revenue holds, you can read that as quality going up.
Q. How do I calculate RPS?
A. Just divide that channel's revenue by that channel's session count. For example, if organic search has ¥640,000 in revenue and 8,000 sessions, the RPS is ¥80. Two cautions. First, exclude automated-program (bot) traffic as much as possible. When sessions are high even though no real person came, RPS comes out lower than it really is. Second, when there's revenue of "unknown origin" where you can't tell which channel it came through, per-channel revenue looks smaller. Level these two out before you divide, and you get an RPS closer to reality.
Q. If organic search's RPS is low, what should I do?
A. First, separate out why it's low. The move differs depending on whether you're getting visitors on low-intent keywords (searches that just look up meaning, like "what is ○○?") or whether the receiving end (the pages and paths) is weak after they arrive. For the former, go after higher-intent keywords. For the latter, revisit the page content and the path to purchase. A high or low RPS is the entry point to "where to fix," not the answer itself. Start by checking, side by side with other channels, whether organic search is thin for its volume.
Conclusion#
Organic search having a lot of traffic is, in itself, a good thing. But having a lot of traffic and that traffic contributing to revenue are two different things. Even with plenty of visits, if many just look and leave, there's no revenue.
Whether a channel is earning shows up not in visit count but in revenue per session (RPS). Compare organic search's RPS side by side against other channels—ads, social, email—and you can tell whether it's earning for its volume, or just sending volume.
But keeping that comparison aligned by hand is heavy work. Channel grouping, excluding bots, splitting out unknown origin—only once you level these out does side-by-side RPS mean something. Stop taking comfort in traffic count, and check once, through RPS, whether organic search is really working for revenue. Your SEO effort becomes something you can talk about in revenue, not just counts.
See which ads actually drive revenue, at a glance
Free up to 5,000 sessions/month, AI analyst included. No credit card required. Up and running in 5 minutes.