"Where am I supposed to start with EC acquisition?" It is one of the most common worries from people who just opened a shop.
Japan's EC market has grown to about 26 trillion yen [1], making it easier than ever to open a shop. At the same time, search ads, social, SEO, marketplaces — there are so many channels to choose from, and each differs in cost and in how long it takes to see results. The more you research, the harder it gets to move.
In this article, we compare the 12 main channels used in EC across three axes: cost, speed to results, and product fit. You can line up the cost and speed of 12 channels in a table. But the real question is "once you start, which channel is actually driving revenue?" — and that is something a comparison table will never tell you. So the goal here is not to hand you "the right pick." It is to see through to how you judge budget allocation after you choose: first what to start with, then how to measure which channel truly worked.
Table of Contents
TL;DR#
Here are the takeaways up front.
- Line channels up by "cost, speed, and fit" and you can place your bet. Entry = "low cost, fast" (shopping ads, retargeting); plant asset channels like SEO and organic social early
- But whether the bet was right is only knowable after you choose — not until you compare revenue efficiency by channel (RPS and AOV) once traffic mixes together
- The channel with the most traffic is not always the most profitable. Google search can have a high AOV but a low RPS, while email has a mid AOV but the top RPS — the reversal happens
- This side-by-side of channel-level RPS and AOV (bot-excluded) is structurally absent from GA4's standard reports. So the measurement itself becomes the task left after you choose
1. The three axes for choosing acquisition channels#
Bottom line: channels get much easier to choose when you look at "cost, speed, and product fit."
Picking channels because they are "popular" or "everyone uses them" tends to waste both money and time. Whether a channel fits your shop comes down to three things.
The first is cost. Some channels need ad spend (search and social ads), while others can start on labor alone (organic social, email). The first hurdle is whether you can keep paying for it.
The second is speed to results. Some channels are fast (the ad family) and turn into sales right away; others are slow (SEO, organic social) and take months to show effect. What you choose depends on whether you need sales now or want to build an asset over time.
The third is product and phase fit. Products whose appeal shows visually (fashion, beauty) do well on social, while products people search for (items with model numbers) do well on search ads. The priority also differs between pre-revenue, when you have no sales yet, and growth stage, when traffic is already flowing.
Just keeping these three axes in mind helps you avoid the burnout of "trying everything at once." But the three axes only let you place a bet. Whether that bet was right is not knowable until you start and compare revenue efficiency by channel.
2. 12 channels on a cost x speed quadrant#
Bottom line: plotted by cost and speed, the 12 channels fall into four groups.
Put cost on the horizontal axis (low to high) and speed on the vertical axis (low to high), and place the 12 main channels.
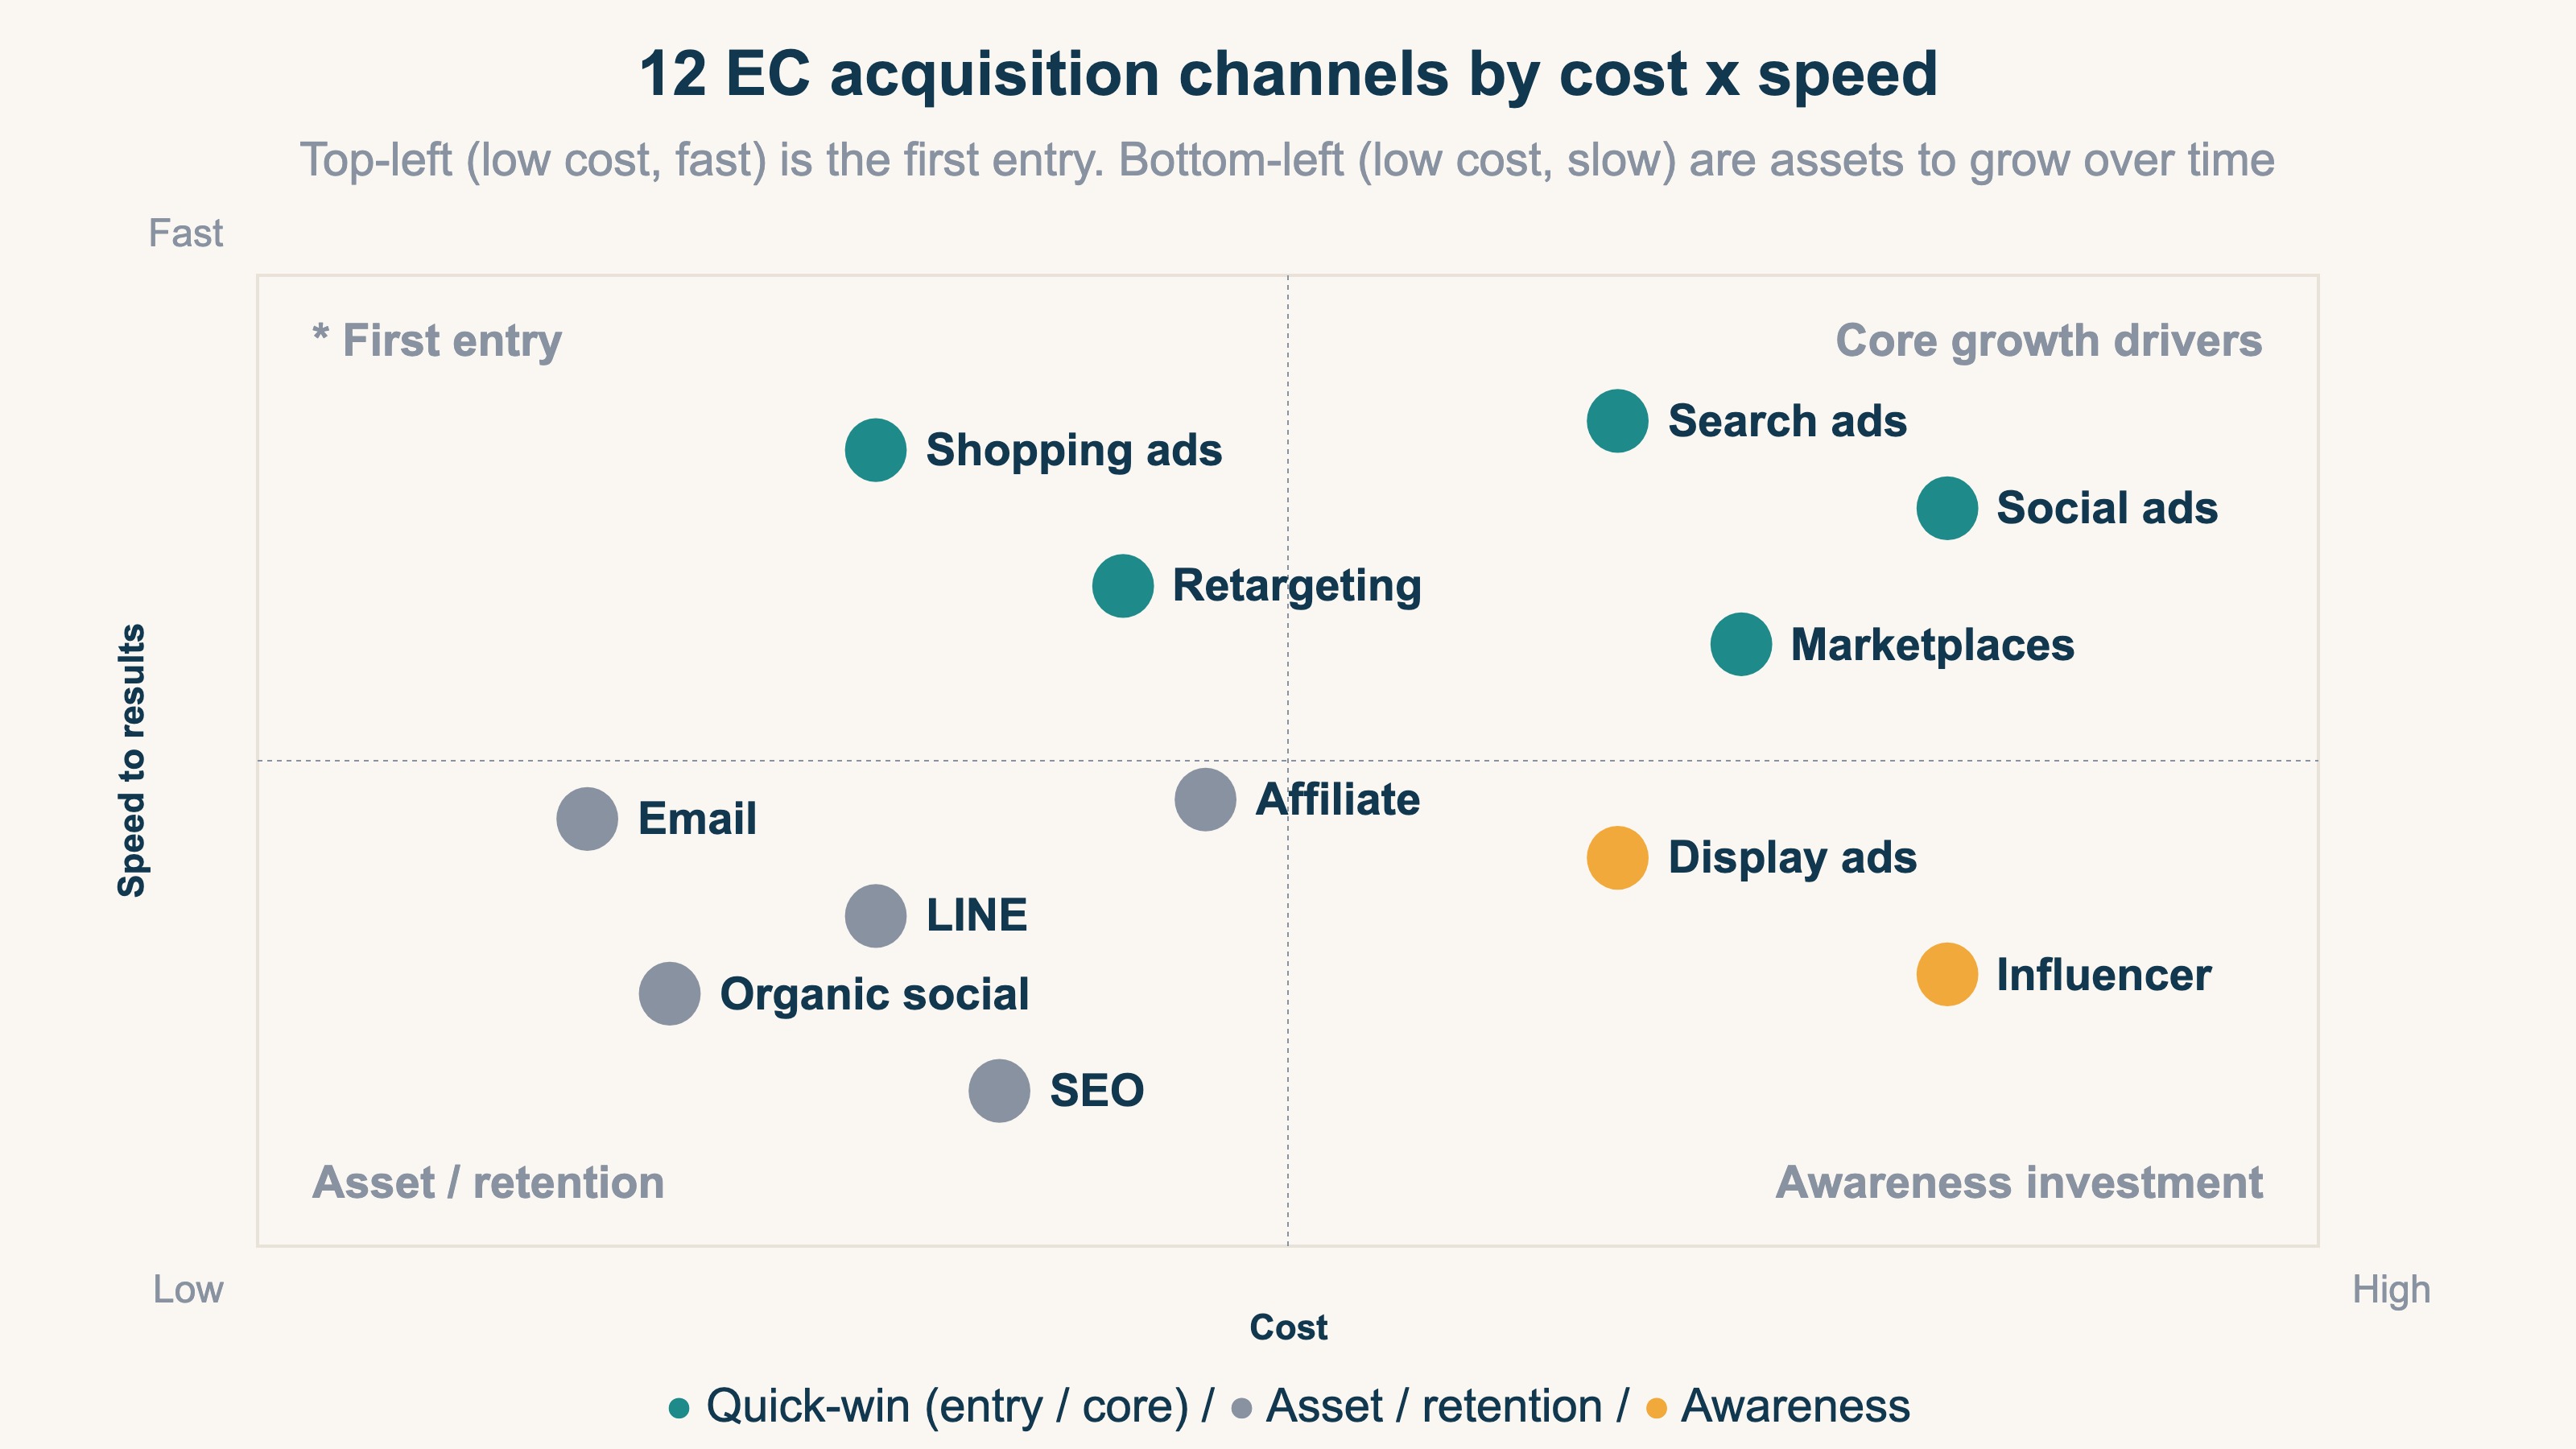
The four groups each play a different role.
- Top-left (low cost, fast) = the first entry: shopping ads, retargeting. With small per-click budgets, they efficiently convert people who are ready to buy or who have visited before. Top priority for pre-revenue to early-growth shops.
- Top-right (high cost, fast) = core growth drivers: search ads, social ads, marketplaces. They cost more but produce early momentum. Expand investment here once purchases start to flow in growth stage.
- Bottom-left (low cost, slow) = asset and retention plays: SEO, organic social, email, LINE, affiliate. Low cost but slow to pay off. Plant them early for products with repeat purchases.
- Bottom-right (high cost, slow) = awareness investment: influencer, display ads. Cost comes first and direct sales lag. These are add-ons for the awareness stage.
The key is not to lean on only one quadrant. Make sales through the entry (top-left) while growing assets (bottom-left). That combination is the royal road.
3. Comparing cost and traits across 12 channels#
Bottom line: list out the cost ranges and pricing models, and the differences in how easy each is to start become clear.
Here are the cost profiles of the 12 main channels, based on publicly available ranges.
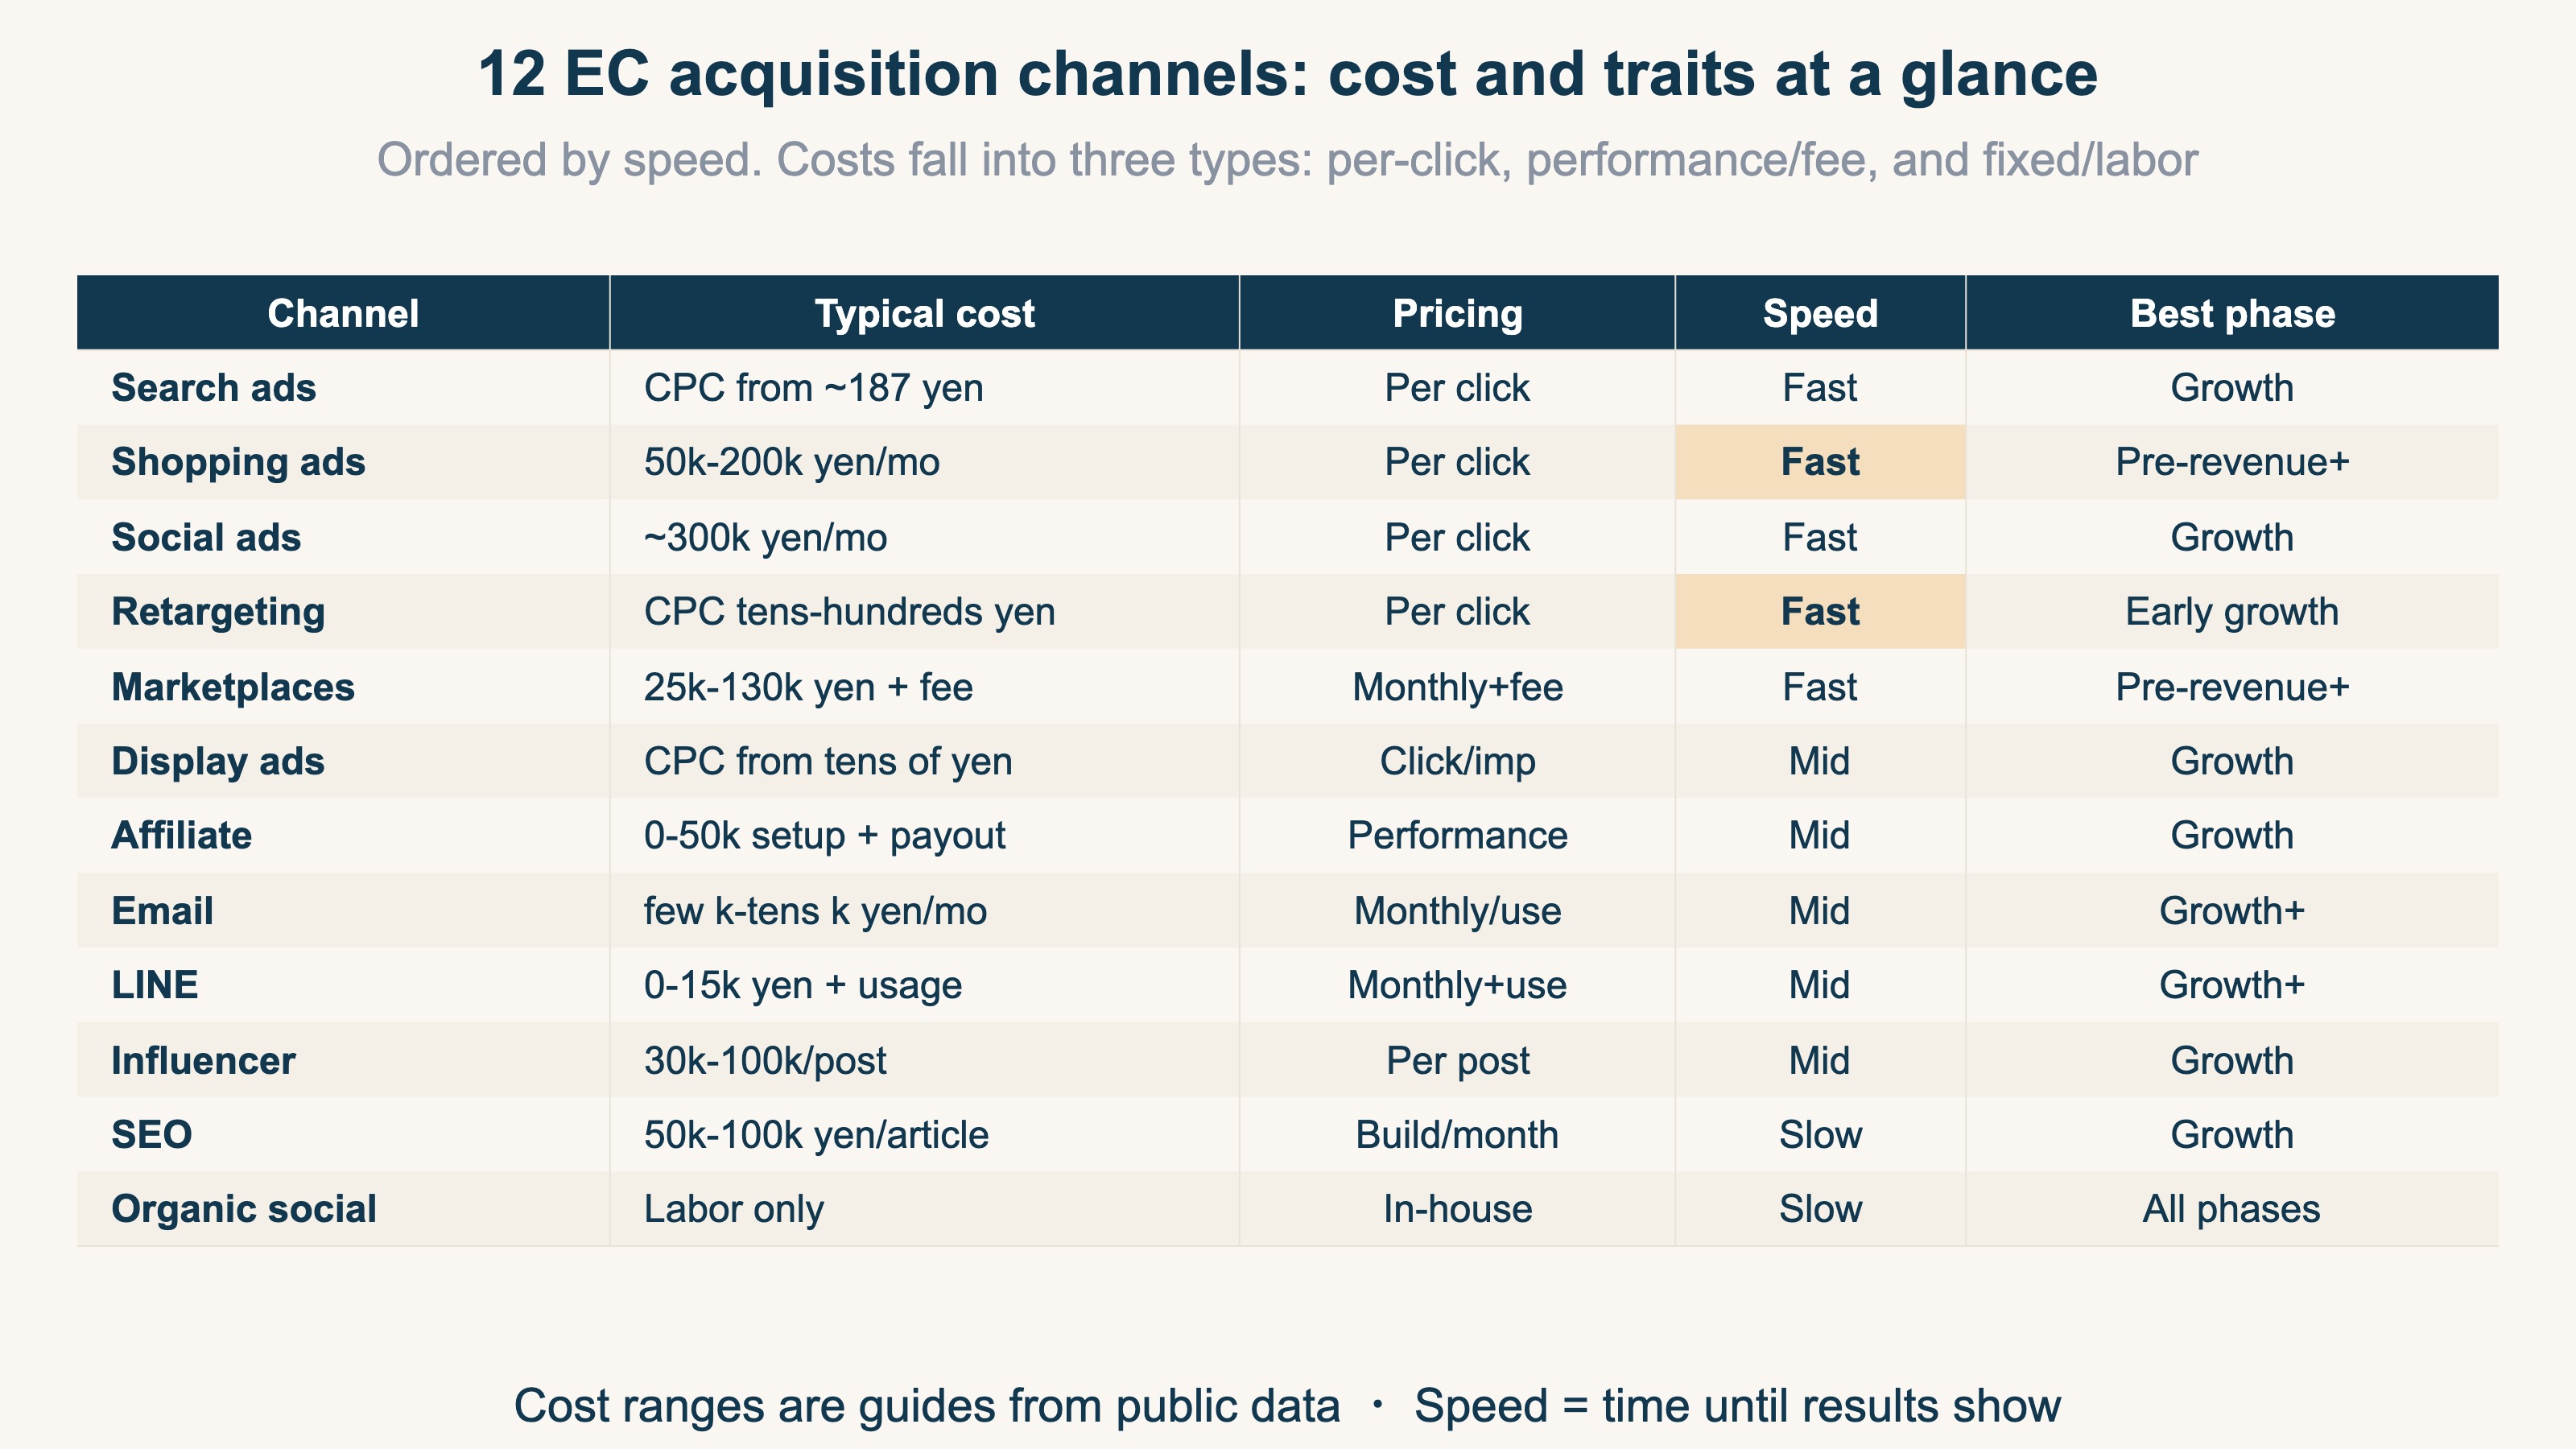
Costs come out in three broad types.
Per-click (CPC) covers search ads, shopping ads, social ads, retargeting and more. You pay per click, so you can start small. One survey puts listing-ad CPC in the EC industry at about 187 yen [2]. Social ads run roughly 24-200 yen per click, with a monthly operating guide around 300k yen [3].
Performance and fee-based covers affiliate and marketplaces. Affiliate typically runs 0-50k yen in setup plus a payout only when a sale happens [4]. Opening a Rakuten store costs 60k yen setup, 25k-130k yen monthly, plus a usage fee of roughly 2-7% of sales [6].
Fixed-cost / labor-based covers SEO, organic social, email, and LINE. SEO content runs 50k-100k yen per article and takes 3-6 months to a year to show effect [4]. A LINE official account can start free, rising to about 5k-15k yen monthly as message volume grows [5].
"Speed" here is only about time to results. Cheaper is not always better, and faster is not always better. Choose by what fits your phase and your product.
4. Where to start, by phase#
Bottom line: when in doubt, split by "do I have traffic now?" and your first move becomes clear.
Thinking it through in order:
- Almost no sales or traffic yet (pre-revenue): start with shopping ads, which reach buy-ready people cheaply, or a marketplace, which lends you its traffic. Make small sales first and learn what sells.
- Some traffic emerging (early growth): add retargeting to keep the people who already visited. Begin planting SEO and organic social at the same time — these take time, so the earlier the better.
- Sales stabilizing (growth): scale up with search ads and social ads, and grow repeat purchases with email and LINE. This is also the stage for affiliate and influencer to widen awareness.
The common thread at every stage is running several channels at once. Make today's sales with fast channels while growing tomorrow's with asset channels. Rather than betting on one, combine channels with different roles.
That said, all of this only settles "your first bet." Whether the bet was right is only knowable after you start. And the more channels you add, the more traffic mixes together and the harder it gets to see which one is actually driving revenue — the channel that draws a crowd but yields thin profit becomes indistinguishable from the quiet one that buys reliably. That is the next challenge, and it is the one a table can never fill.
RevenueScope's solution
Bottom line: the task left after you choose is to compare revenue efficiency by channel (RPS and AOV) on one screen, with bots removed. That view is structurally absent from GA4's standard reports — and it is the gap RevenueScope fills.
Once you choose channels and start moving, you always hit the next wall: you cannot see which channel is actually driving revenue. A table gets you to a bet; whether that bet was right is only knowable here.
GA4's standard reports have a structural blank spot. The channel reports center on Sessions and Users, and there is no standard view that lines up channel-level RPS (revenue per session) and AOV side by side. On top of that, bots (automated traffic) creep into your traffic, and the revenue-less visits vary by channel. The reversal that breaks the "most traffic = most profit" assumption — say, "Google search has a high AOV but a low RPS" and "email has a mid AOV but the top RPS" — only shows once you exclude bots and put channels side by side. The idea is simple, but doing this every time, for every channel, by hand is heavy, repetitive work.
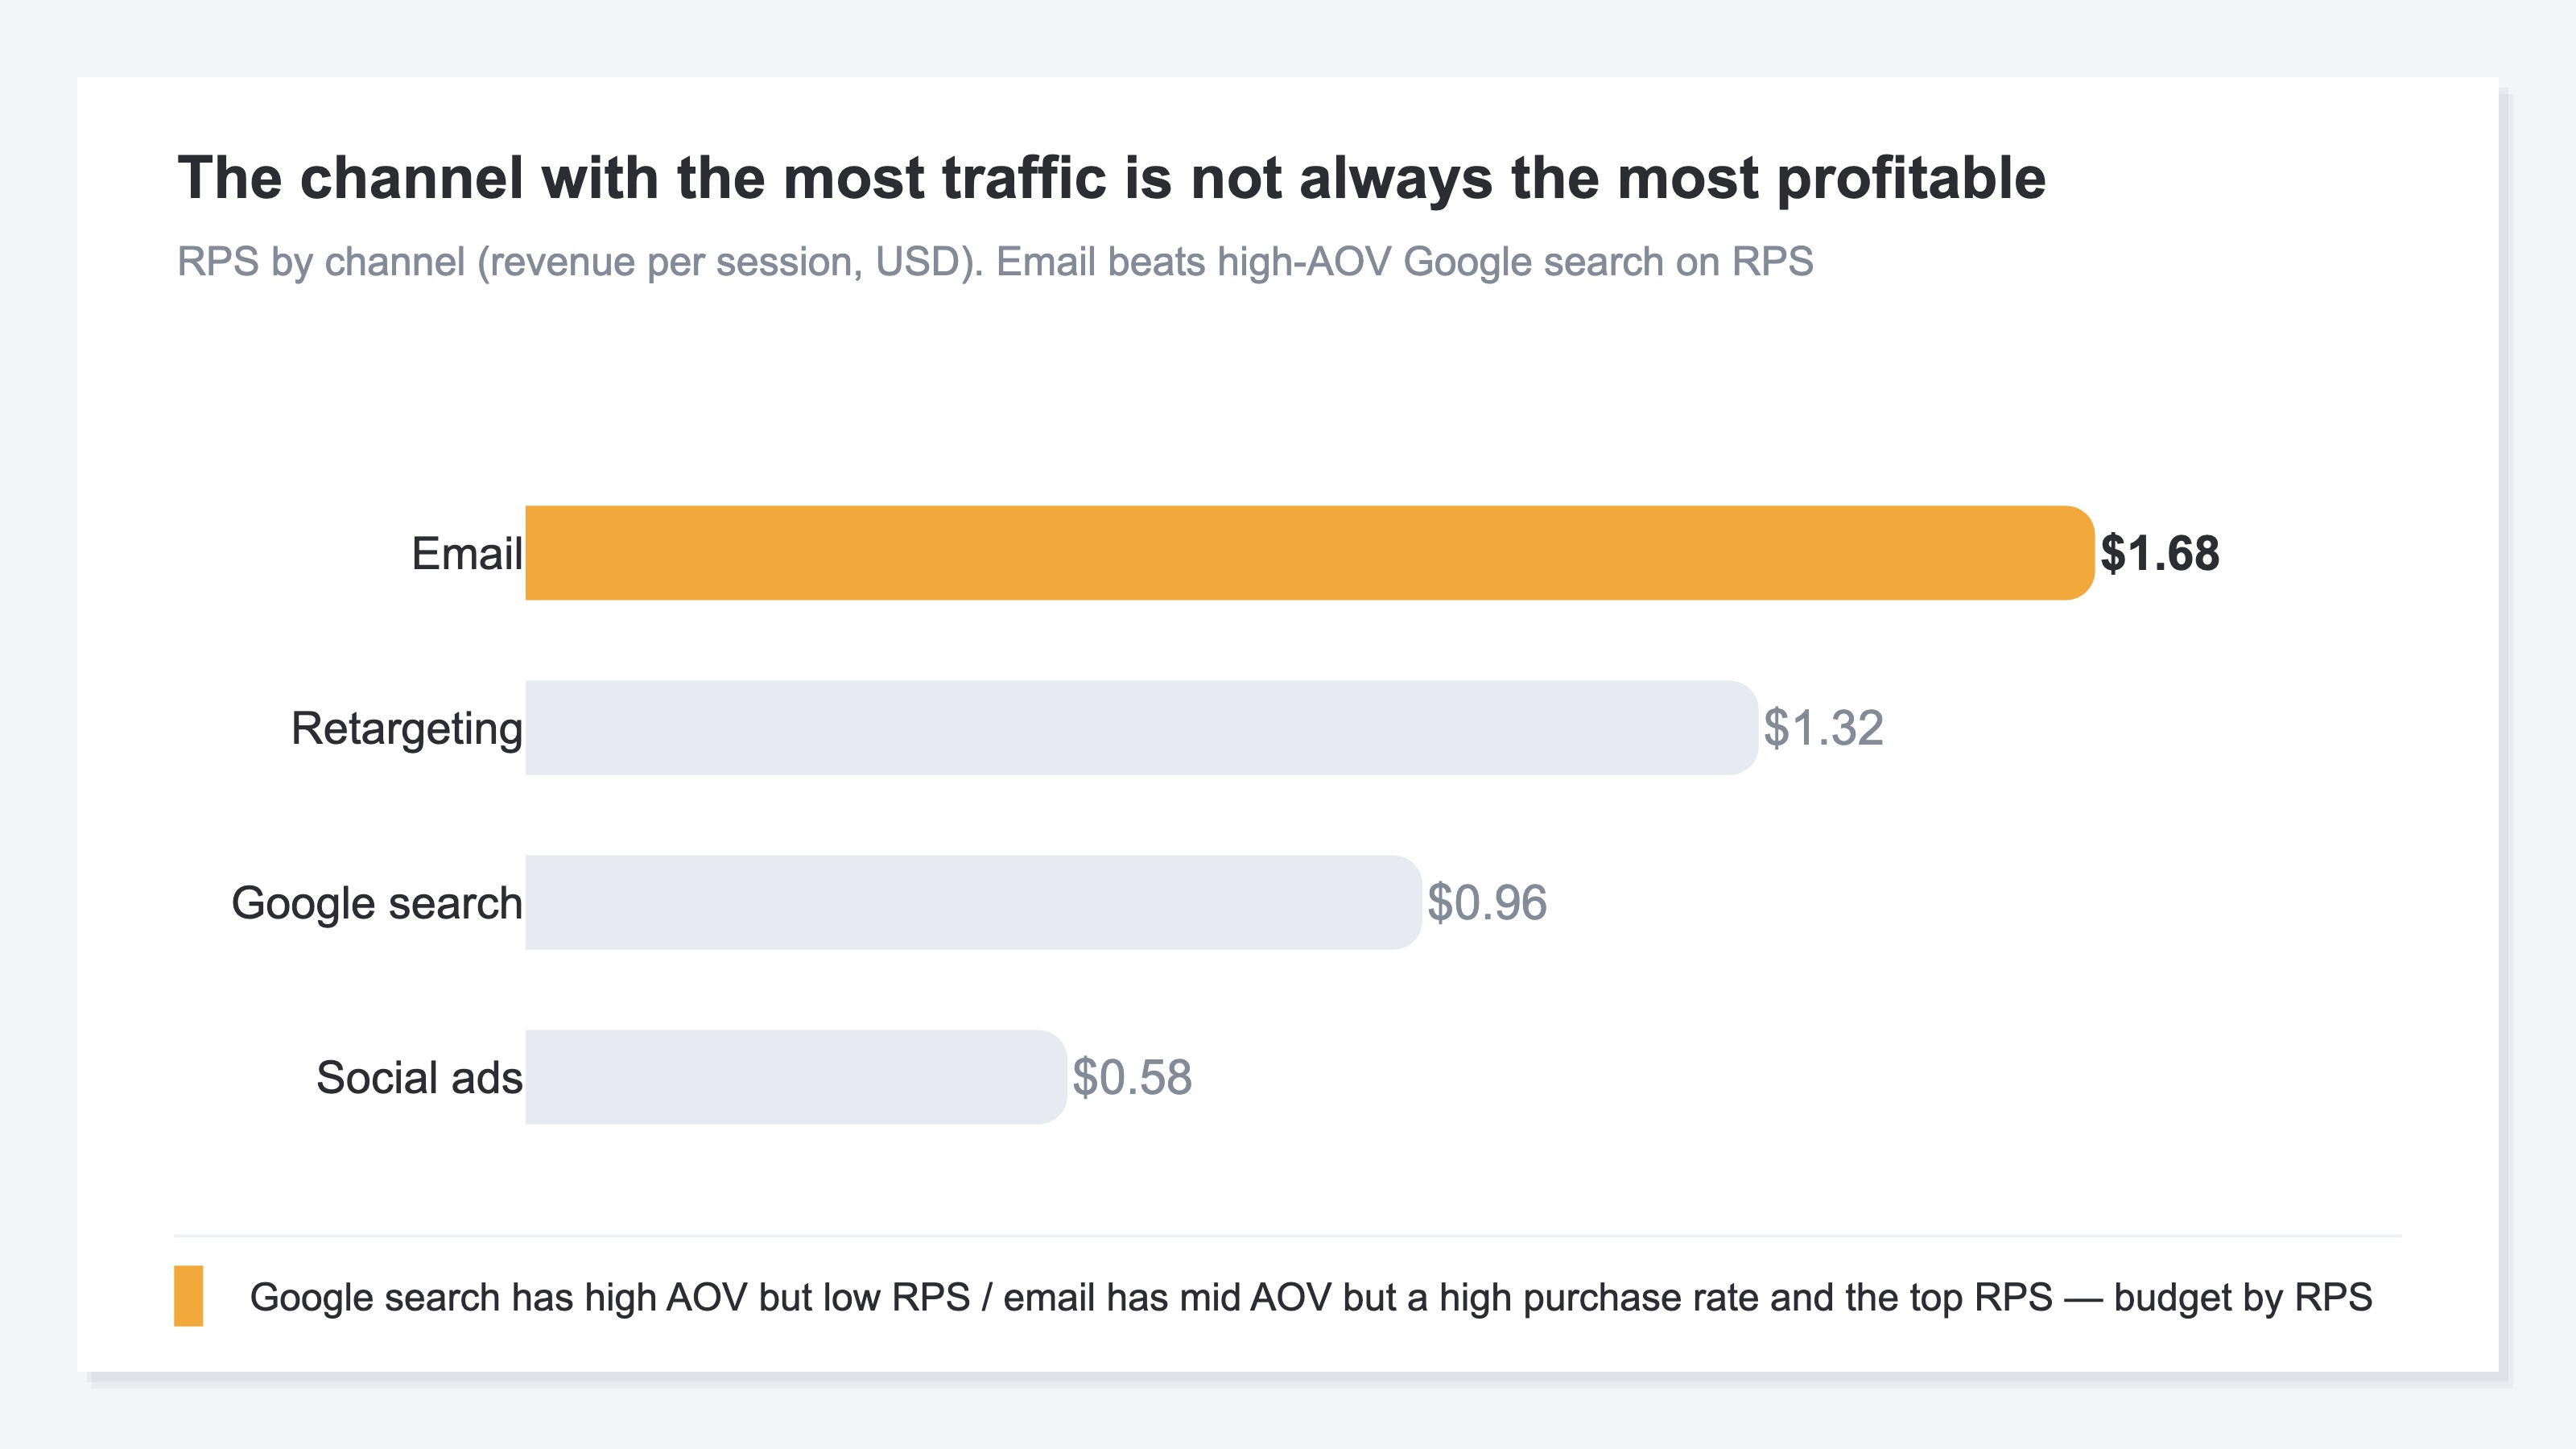
RevenueScope is a lightweight, revenue-focused dashboard you can use by adding a single tag to GA4. It lines up the four core metrics by channel — Revenue, AOV (average order value), RPS (revenue per session), and CVR (purchase rate) — on one consistent basis. Because they line up on bot-excluded clean numbers, the reversal above shows up on a single screen. Add Sessions, and these five numbers let you decide "which channel to fund next" simply.
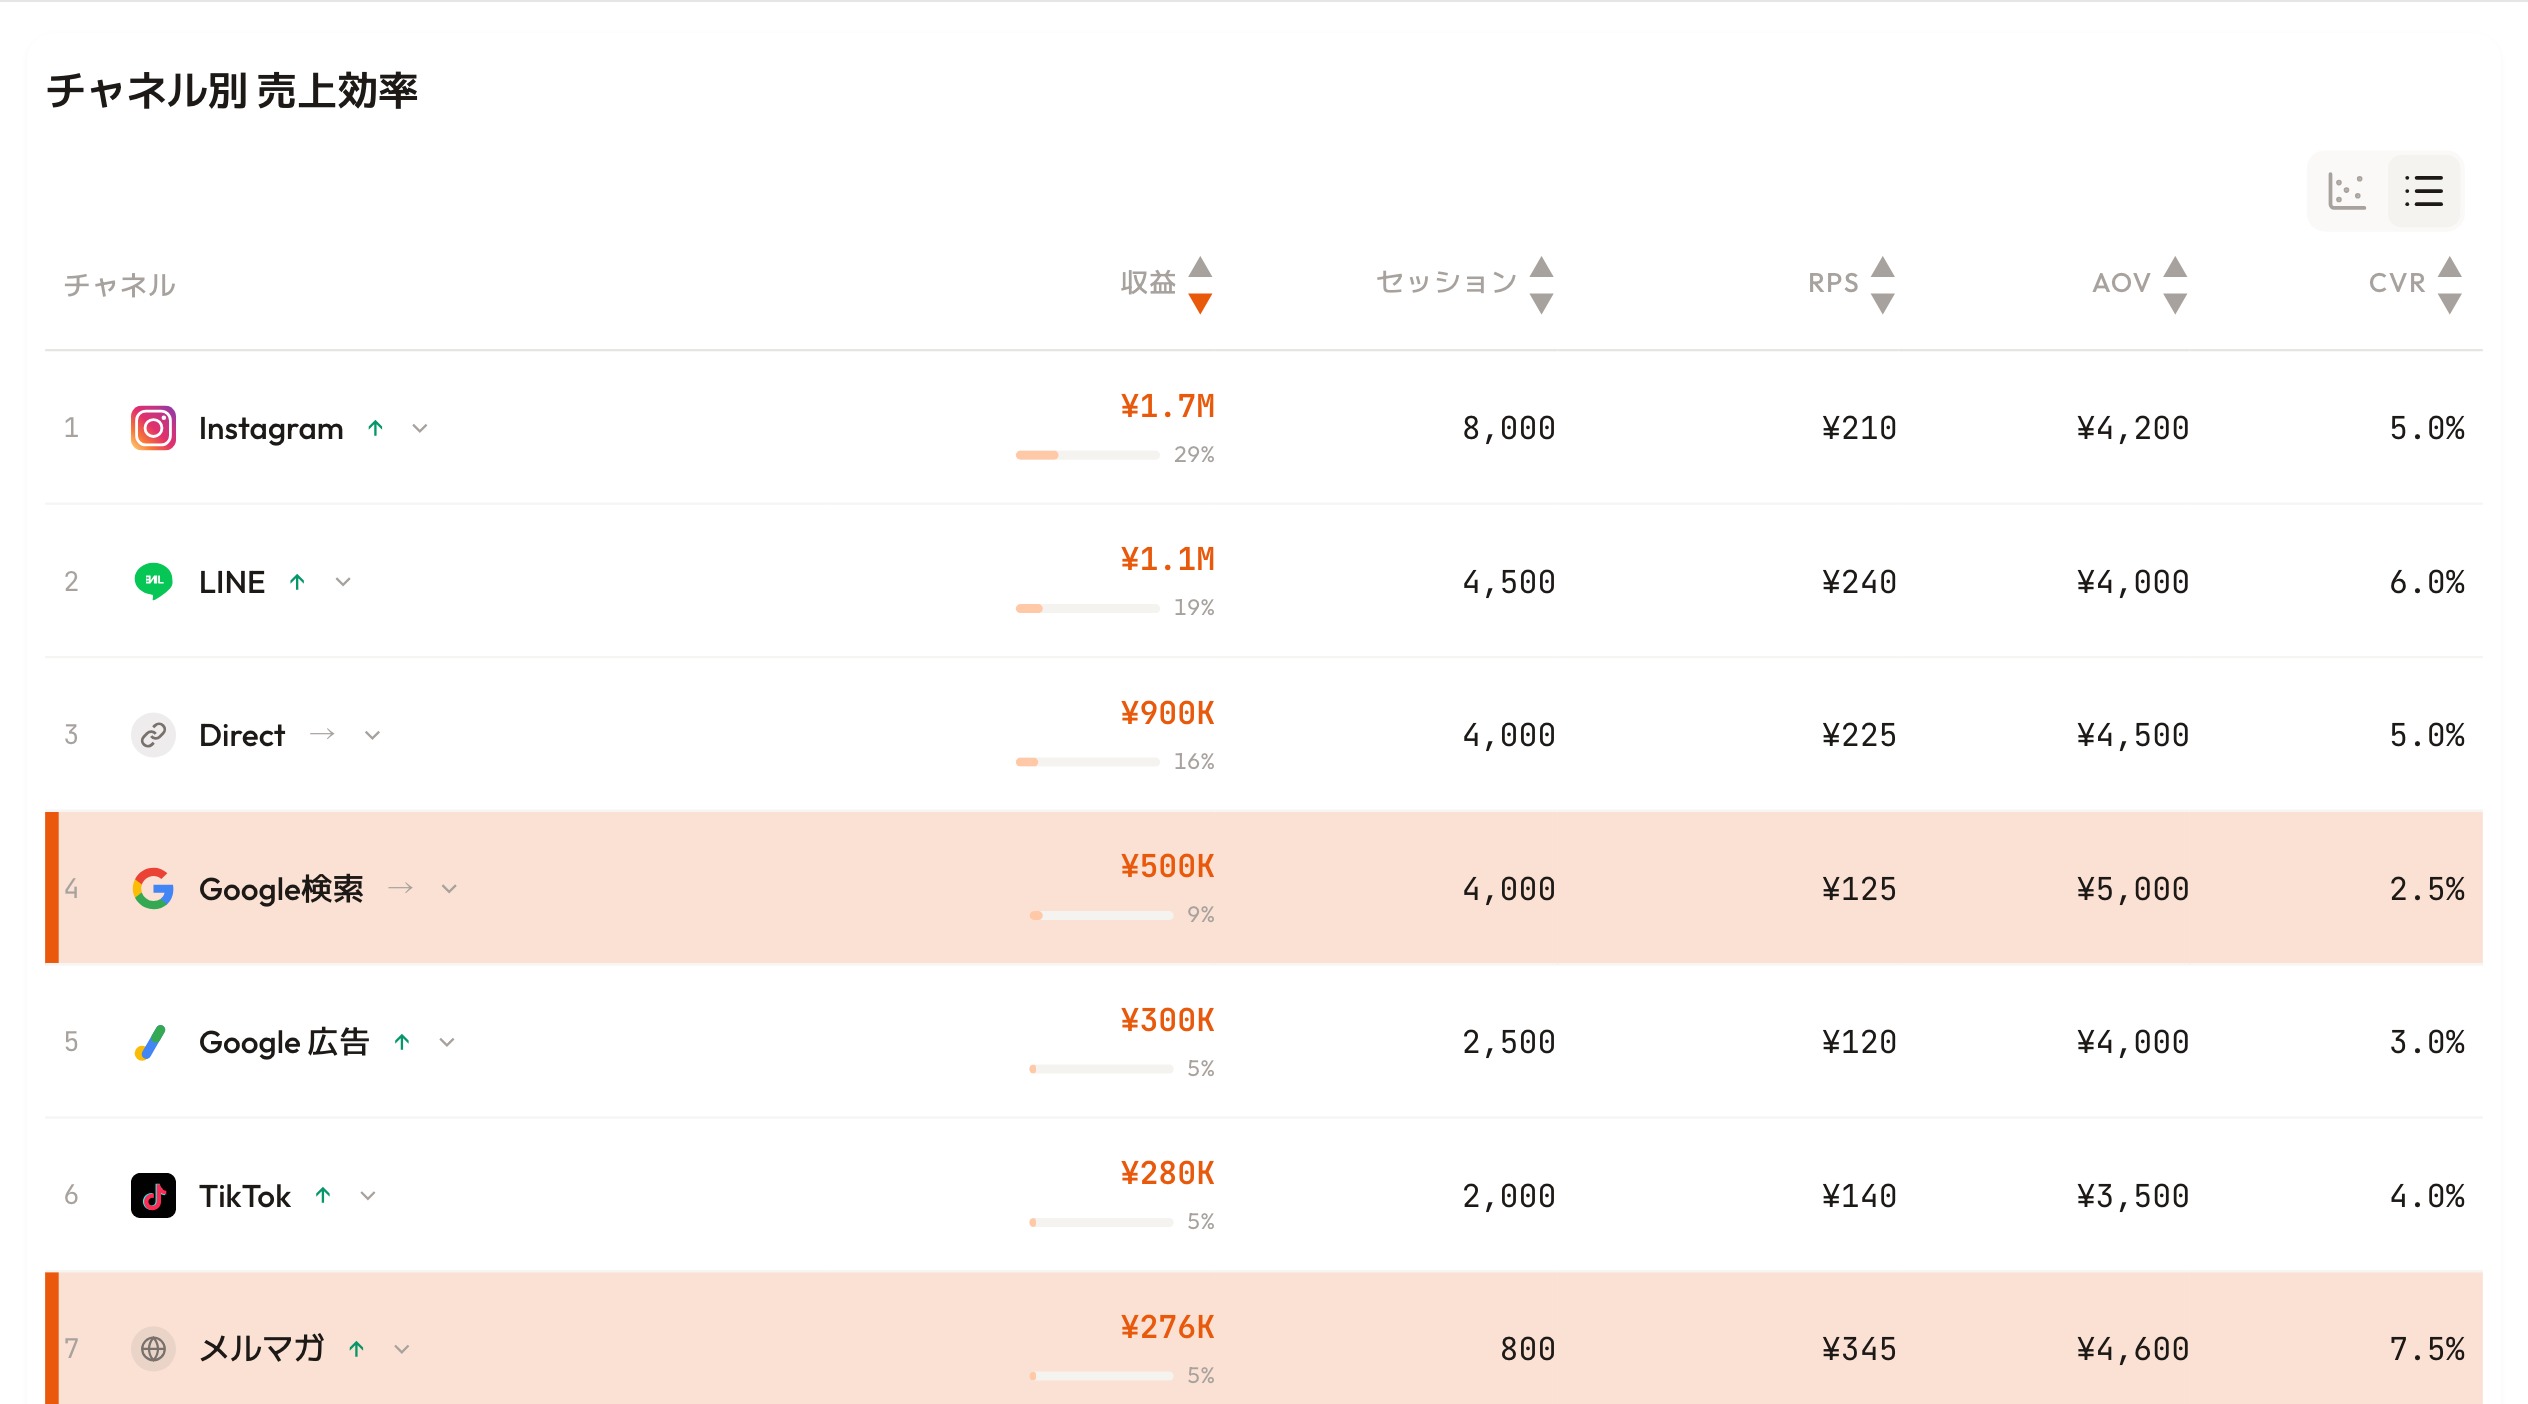
RevenueScope's dashboard (demo data shown). Revenue, RPS, AOV, and CVR by channel on one screen.
In the screen above, Google search has the highest AOV yet a low RPS (revenue per session). Email, with a mid AOV but a high purchase rate, tops RPS. The reversal — "highest AOV does not mean highest revenue efficiency" — is visible at a glance. We explain reading revenue efficiency by channel in What is RPS? The metric, formula, and how to get it in GA4.
RevenueScope is built for the day-to-day, revenue-by-channel call. Leave detailed user-behavior analysis to GA4 and use RevenueScope for the revenue-by-channel decision — split the roles and run them together, and you decide "where to fund next" after you choose with numbers, not guesswork.
FAQ#
Q. My budget is small. If I pick just one channel, which should it be?
Shopping ads, which reach buy-ready people cheaply, or a marketplace, which lends you traffic, make good entry points. It is safest to make small sales first, learn what sells, and then expand.
Q. Are SEO and organic social worth it? I hear they are slow.
Yes. They take months to show effect, but once they grow, they become an asset that keeps bringing traffic without paying like ads. Plant them early alongside fast channels.
Q. Doesn't using many channels make it impossible to tell what works?
It does. That is exactly why you need a way to see revenue efficiency by channel on the same basis. Looking beyond traffic counts to revenue per session (RPS) reveals which channel truly works. GA4's standard reports do not carry this side-by-side out of the box, so this is where tools diverge.
Conclusion#
EC acquisition channels are many, and it is natural to feel lost at first. Line them up by "cost, speed, and product fit" and you can place your first bet: entry = "low cost, fast" (shopping ads, retargeting), and plant asset channels like SEO and organic social early, precisely because they are slow. Up to here, the tables in this article let you compare.
But whether that bet was right does not settle until after you start. Not until you line up revenue efficiency by channel (RPS and AOV), with bots removed, on a single screen. And that side-by-side is structurally absent from GA4's standard reports. The reversal that breaks "most traffic = most profit" only shows there.
So even when you finish this article, it does not end at "now I know how to choose." The work of measuring revenue efficiency after you choose still remains. Only once you do that does your limited budget flow to the channel that pays off most.
See which ads actually drive revenue, at a glance
Free up to 5,000 sessions/month, AI analyst included. No credit card required. Up and running in 5 minutes.
References#
- [1] Ministry of Economy, Trade and Industry, "Survey on Electronic Commerce (FY2024)," August 2025 (explainer: future-shop.jp)
- [2] Tomorrow Marketing, "A thorough guide to listing-ad CPC ranges," tomorrow-marketing.co.jp August 2024
- [3] Data be at, "Social ad costs explained: pricing models and ranges," data-be.at 2026
- [4] Mieruca Marketing Journal, "SEO cost range table (2026)," mieru-ca.com January 2026
- [5] LINE Yahoo for Business, "LINE Official Account pricing plans," lycbiz.com 2026
- [6] EC no Madoguchi, "How much are Rakuten store fees? Total costs by plan," ec-counter.com 2026