You spent months chasing a lower CPC and your sales barely moved. It's a common stumble in ecommerce. You shifted budget from search ads at roughly 800 yen per click to social ads at roughly 100 yen. On paper, a landslide win. But sales didn't move — and when you re-rank channels by revenue per click, the picture flips. The cheap social clicks almost never turned into orders, while the "expensive" search clicks earned several times more per visit. This article explains why the cheap click trap happens, and how to diagnose your own store in five minutes.
Table of contents
TL;DR#
-
CPC is just the entry fee
Buying piles of cheap clicks that never convert is burning money, even if the metrics look good
-
Grade channels by revenue per click (per session)
A search channel that loses 8x on CPC can win roughly 10x on revenue per click
-
The diagnosis is one division using your ad console and GA4 — five minutes
-
But don't apply this yardstick as-is to channels whose job is bringing in new visitors
1. Why cheap clicks become a trap#
Bottom line: CPC is the fee you pay to get someone through the door — whether they buy is a different question entirely.
CPC (cost per click) is what you pay each time your ad gets clicked [3]. Put an 800-yen search click next to a 100-yen social click and anyone feels the pull: the same budget buys eight times more visitors. Industry benchmarks do show search CPCs running from a few hundred yen to over a thousand depending on the vertical, while social clicks often cost a tenth of that [1][2].
The problem is that click volume and click quality are completely different things. People who click a search ad were already shopping — they typed "leather tote commuter" because they want one. Social ads interrupt people who were relaxing, so many clicks are idle curiosity. Cheap traffic feels good at first, but most of it is low-intent. Cheap traffic that never converts is basically burning money, even when it looks good in the metrics.
In other words, nothing guarantees a connection between "clicks got cheaper" and "sales went up." Yet CPC and click counts are the most visible numbers in every ad console. Cheapness is measurable daily and feels like progress, so without noticing, lowering CPC quietly becomes the goal itself. That is the trap.
2. Judge channels by revenue per click, not CPC#
Bottom line: re-rank channels by revenue ÷ clicks (sessions) — what one click actually earned.
This yardstick is called RPS (revenue per session). Ad consoles count "clicks" and GA4 counts "sessions," but in practice you can read both as "what one visit earned." The fundamentals of RPS are covered in the complete revenue-per-session guide.
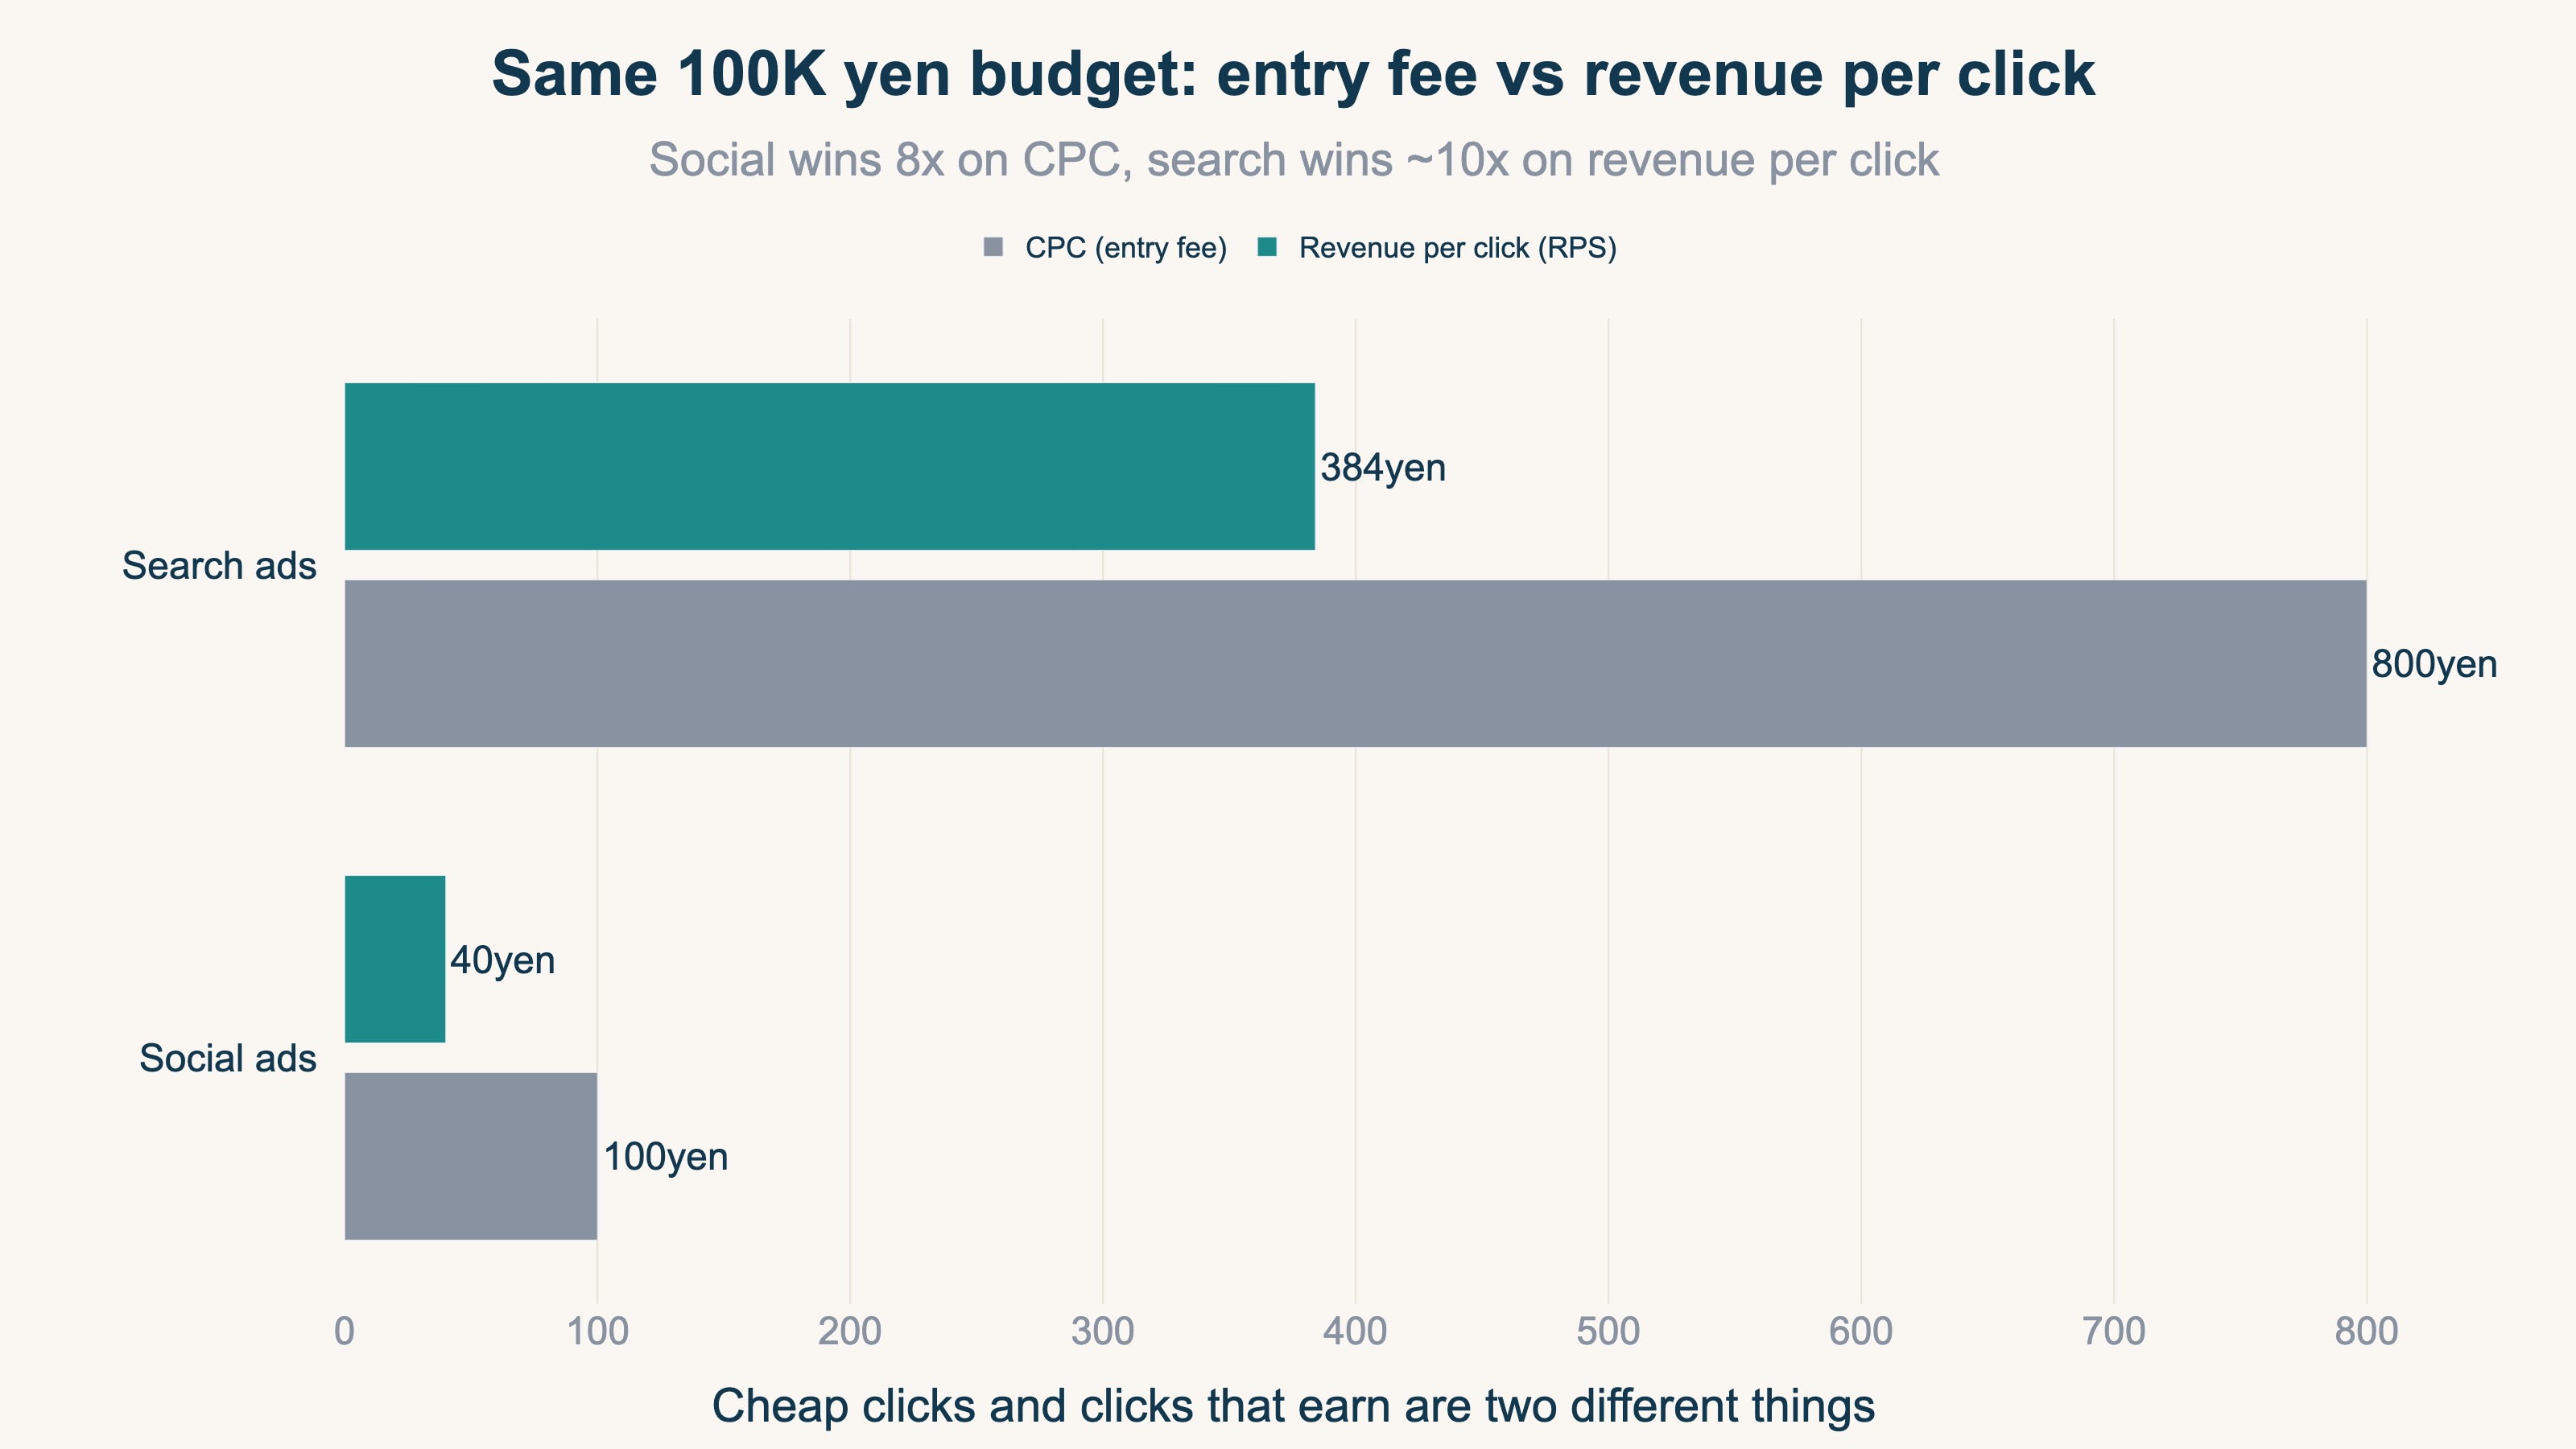
Here are the numbers. Suppose you spend 100,000 yen a month each on search and social ads.
| Search ads | Social ads | |
|---|---|---|
| CPC | 800 yen | 100 yen |
| Clicks | 125 | 1,000 |
| Conversion rate (CVR) | 3.2% | 0.4% |
| Orders | 4 | 4 |
| Average order value (AOV) | 12,000 yen | 10,000 yen |
| Revenue | 48,000 yen | 40,000 yen |
| RPS (revenue ÷ clicks) | 384 yen | 40 yen |
Social wins 8-to-1 on CPC, yet search earns about 10 times more per click. You can buy eight times the clicks, but if they're low-intent visits, revenue barely moves — the cheap side can even lose. Revenue per session is the metric that tells the truth about a channel; CPC is just the entry fee.
The key point: you will never see this reversal from inside the ad console. CPC, clicks, and impressions all live inside the ad platform and never touch your store's revenue. Only when you connect them to revenue does the real channel report card appear.
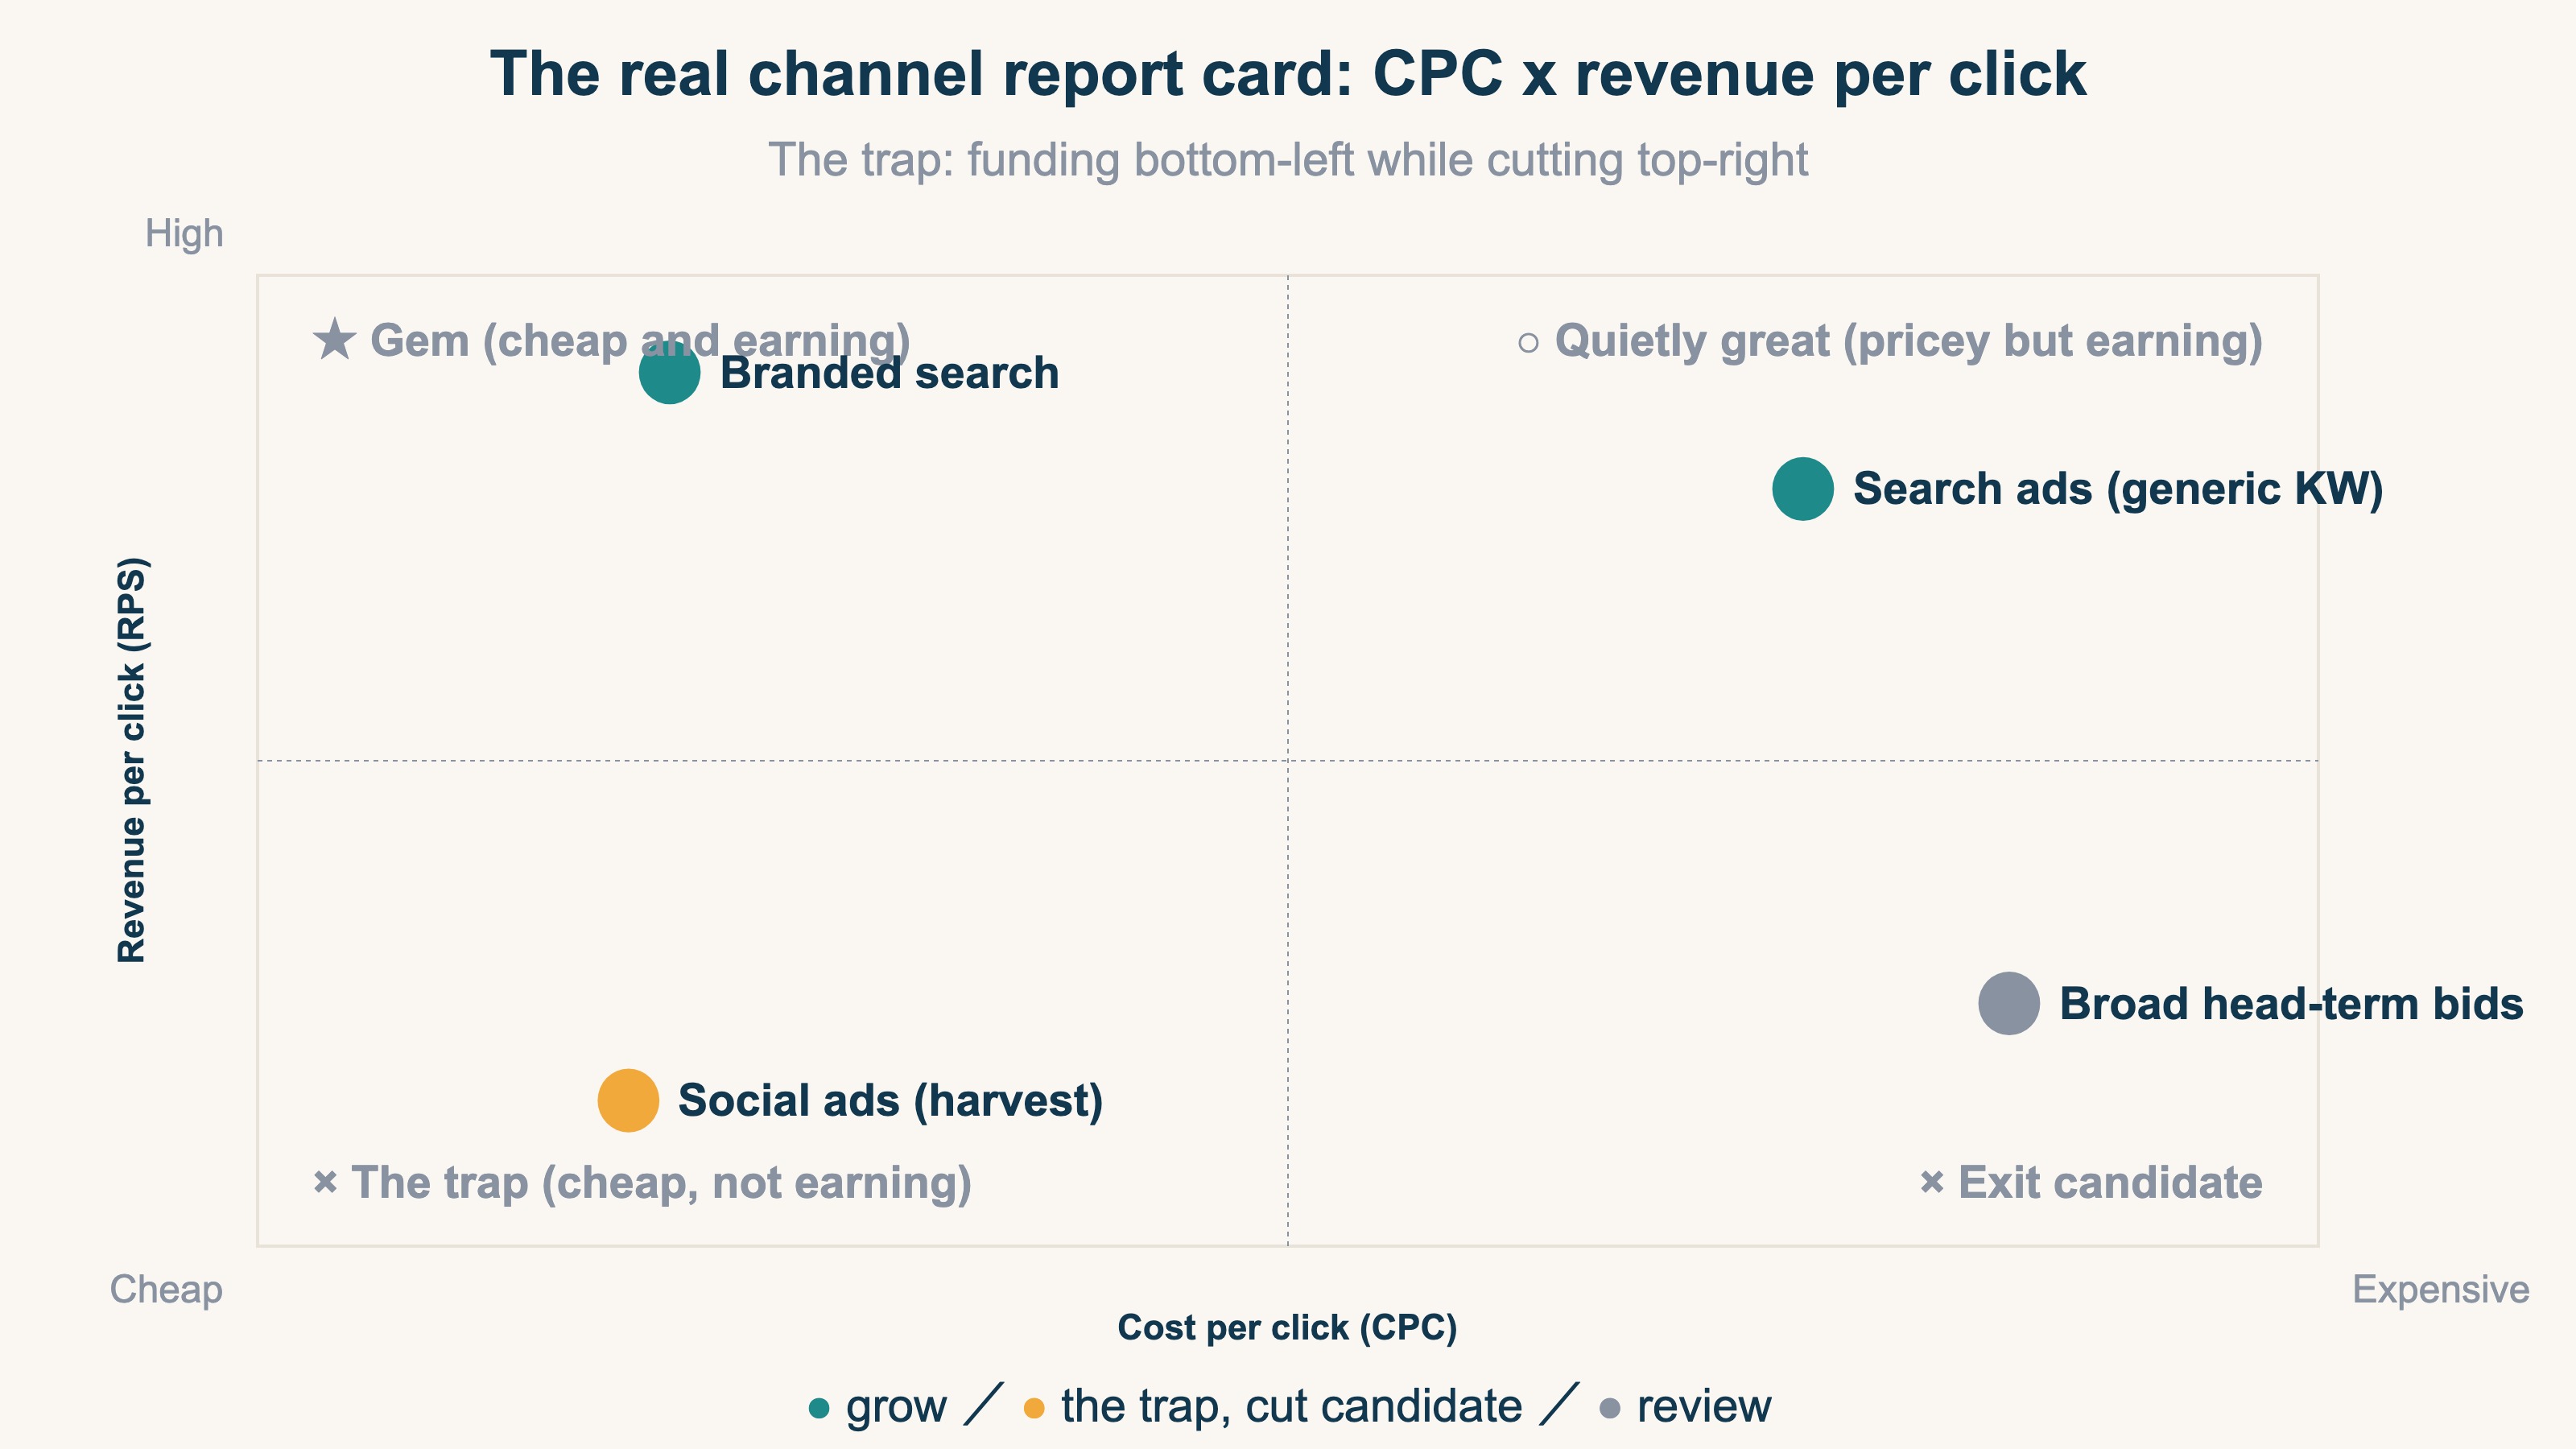
In this matrix, being trapped means funding the bottom-left (cheap, not earning) while cutting the top-right (pricey, earning). Watch CPC alone and that exact move looks like "good optimization."
3. A five-minute channel diagnosis#
Bottom line: take cost and clicks from your ad console, revenue by channel from GA4, and divide.
Three steps:
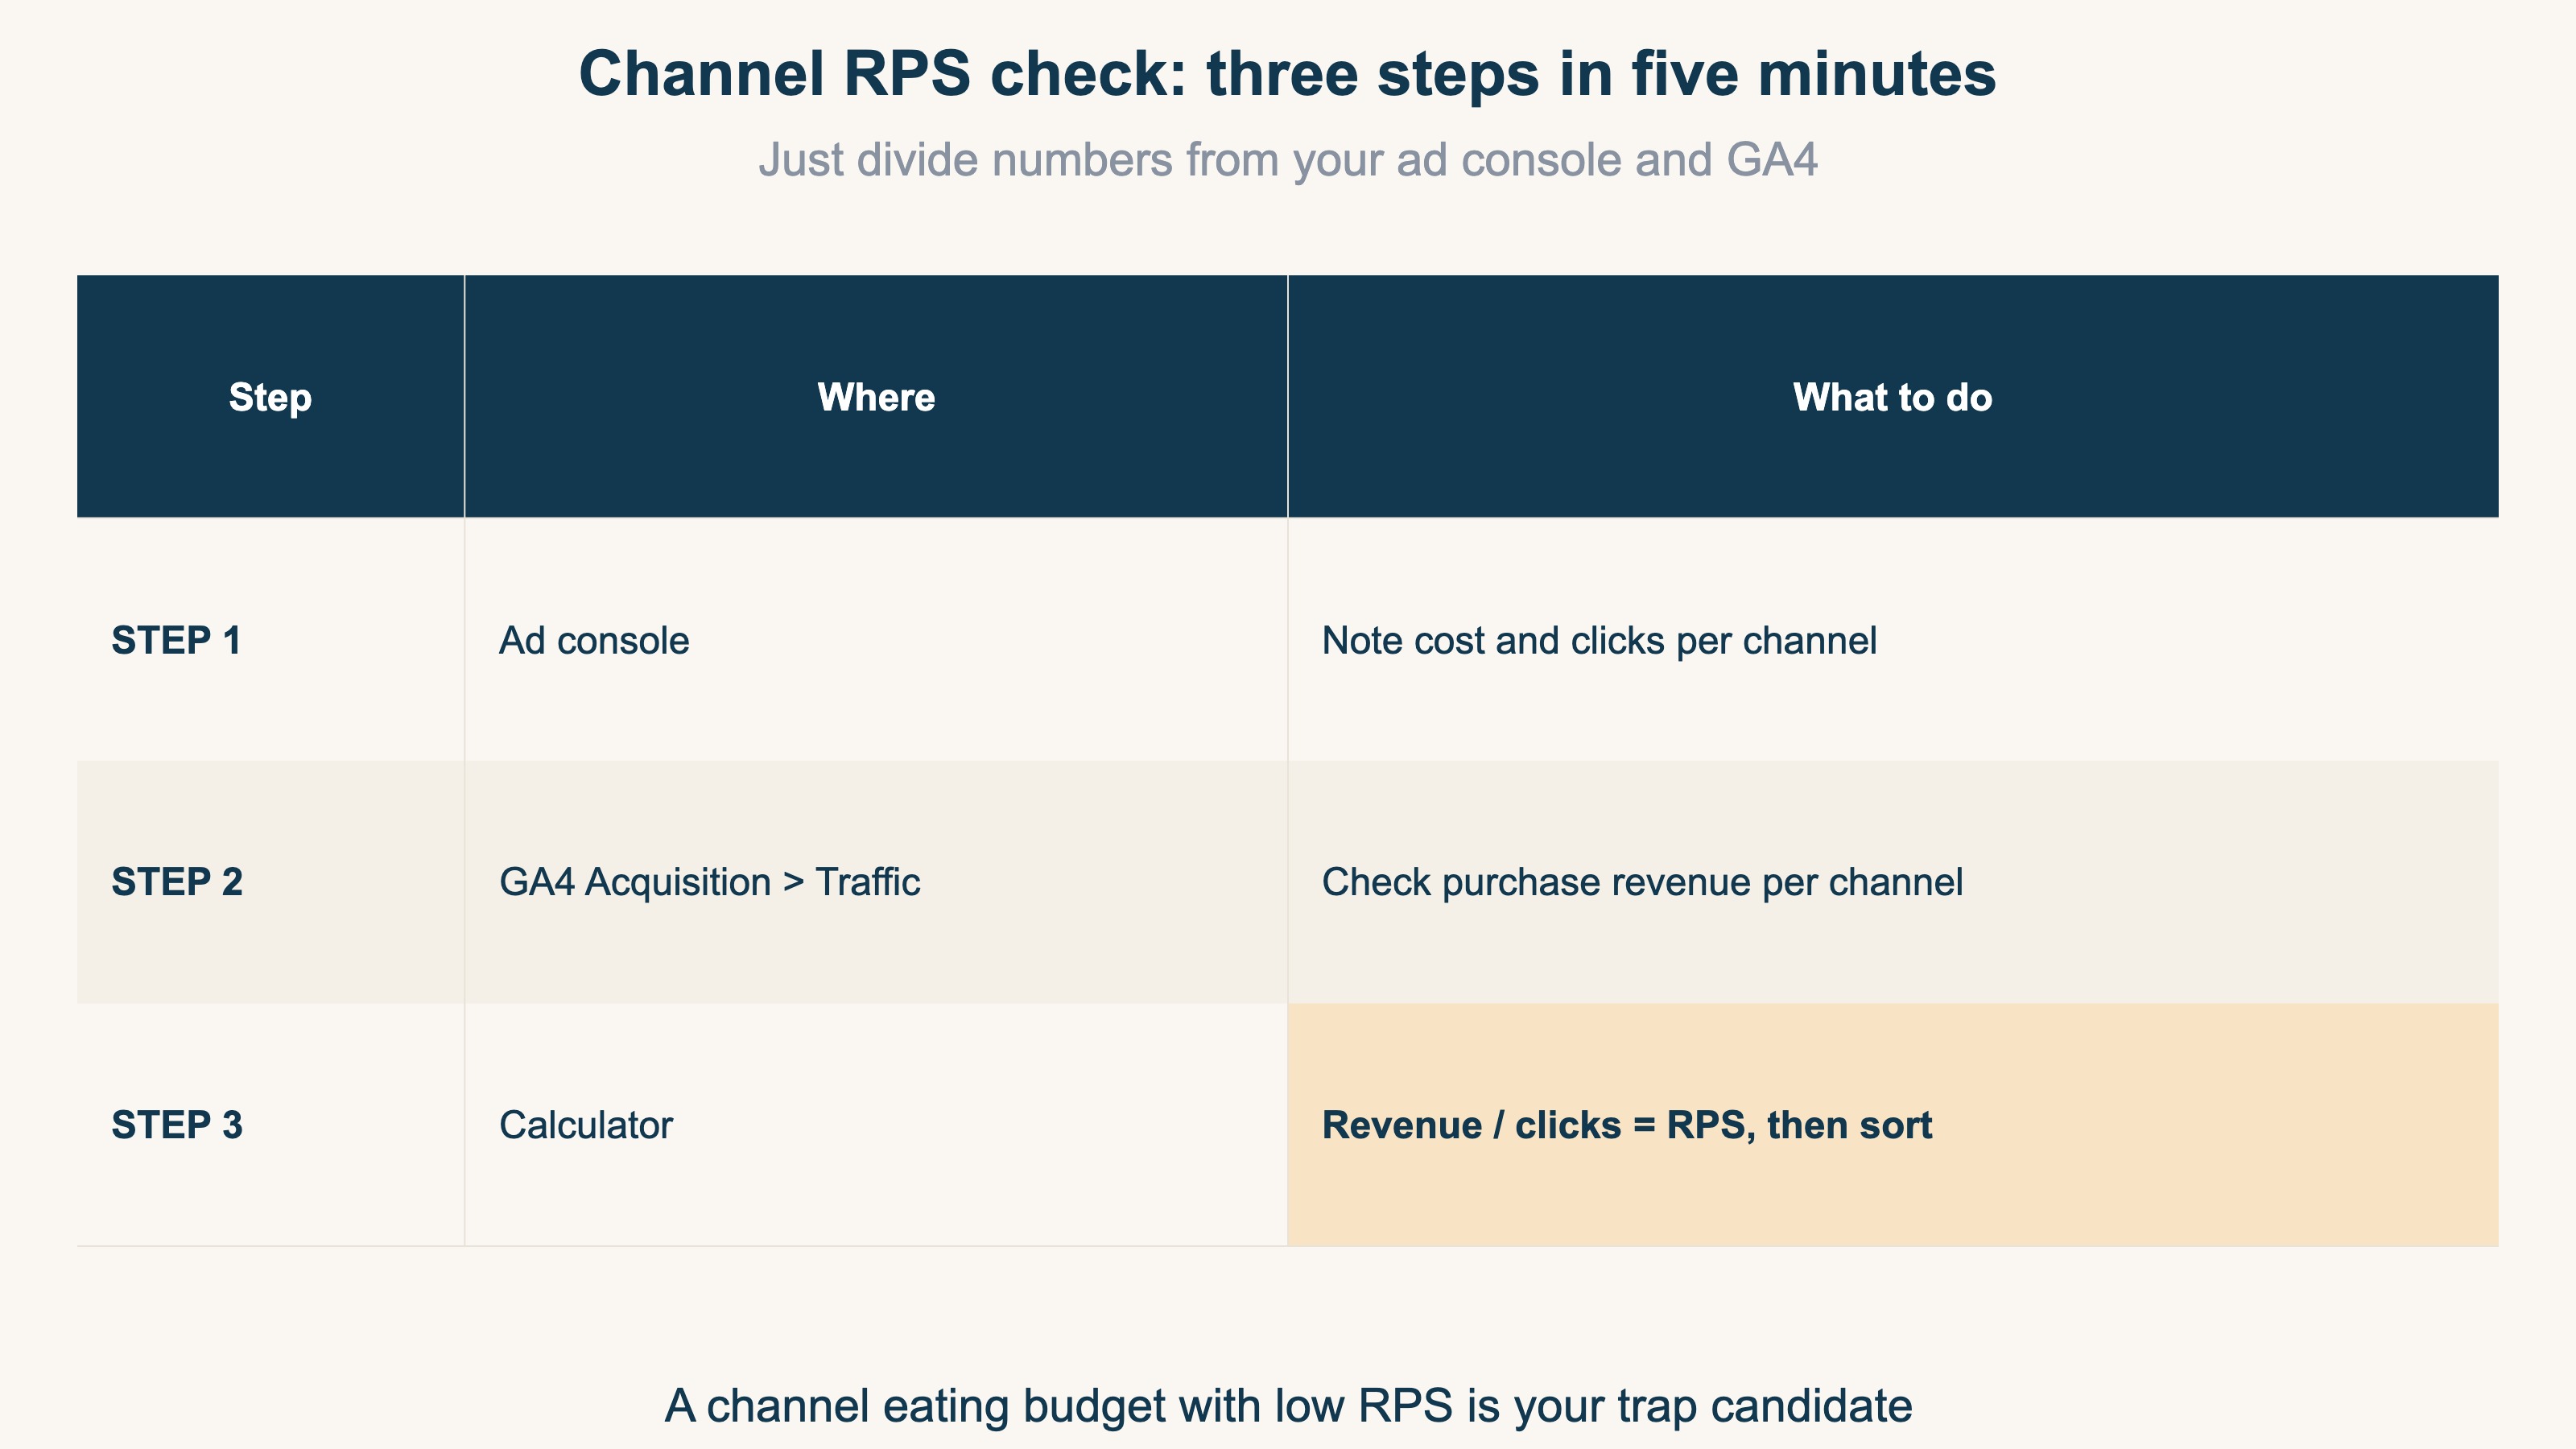
For the GA4 side, open Acquisition → Traffic acquisition and add "Purchase revenue" as a metric to see revenue by channel [4]. If GA4's report screens are unfamiliar, start with How to Read GA4 Reports: Ecommerce Needs Just Three.
Once sorted, most stores find one of two things:
- A channel with very low RPS that eats a big share of budget — usually the one you grew "because it's cheap"
- A channel with high RPS on a thin budget — usually the one you throttled because of its CPC
Move part of the budget to the latter and watch for two to four weeks. That alone tells you whether "more revenue from the same ad spend" is on the table. One caveat: pile too much budget onto a single channel and efficiency starts to fall — a phenomenon called saturation. For how to find the ceiling, see More Ad Spend Doesn't Always Mean More Profit. And before moving any budget, read chapter 4 below.
4. Caution: channels you should not grade this way#
Bottom line: RPS is the right grade for channels that harvest people ready to buy — applying it raw to channels that create new demand leads you astray.
By now you may want to rank every channel by RPS and cut the losers. One important warning first. Don't judge search and social on the same metric, because they're doing two different jobs. Search is demand capture, so revenue per session is the right way to grade it. Cold social is demand generation, and judging it on last-click revenue per session makes it look terrible basically forever. That's not the channel failing — that's grading a top-of-funnel channel on a bottom-of-funnel number.
So channels have two kinds of jobs.
| Job | Examples | Yardstick |
|---|---|---|
| Harvest (catch people buying now) | Search ads, retargeting (ads that follow previous visitors), branded search | RPS works |
| Introduce (bring in people who don't know you yet) | Cold social ads, video ads | Supplement with new-visitor volume and share |
"Introduce" channels pay off on a delay: the new visitors they bring come back later through search or bookmarks and buy. So for these channels, watch new-visitor volume alongside RPS. How new and returning visitors differ in revenue quality comes up in How Should a Single-Product Store Split Its Ad Budget?, and the bias of giving all credit to the last clicked ad is covered in Moving Budget on Last-Click Alone Costs You.
Flip it around: between harvest channels (search vs search, retargeting vs retargeting), RPS is a directly powerful yardstick. The opening story worked precisely because it compared near-harvest placements — which is why the RPS reversal was the answer.
RevenueScope solution
Bottom line: channel-level RPS can simply be on screen from the start — no weekly spreadsheet math.
The chapter-3 diagnosis takes five minutes, but doing it every week means hopping between the ad console and GA4 with a calculator. RevenueScope is a tool that pre-builds exactly the aggregations an ecommerce store needs for revenue decisions: every channel comes with revenue, sessions, and RPS already computed. You start the conversation from "what did one visit earn," not from how cheap the clicks were.
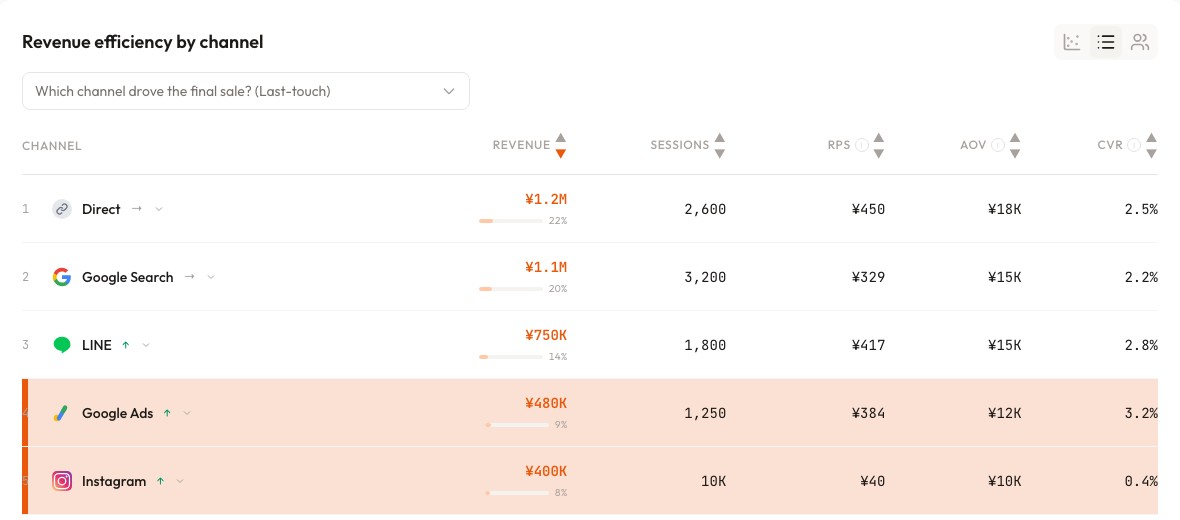
Reading the screen above (demo data): Instagram gathered 10,000 sessions for 400K yen of revenue — RPS of 40 yen. Google Ads brought only 1,250 sessions yet 480K yen — RPS of 384 yen. "The channel that gathers the most people" and "the channel that earns the most per visit" are different channels, and two rows tell you so. The next move: shift part of the Instagram harvest budget into search ads, as a test.
You can also let an AI assistant (ChatGPT or Claude) read your store's data directly and ask it questions. Connect your ad accounts and the answers go further — into saturation and budget allocation. Ask "is my current budget split right?" and you get something like this (demo data):
| Channel | Monthly spend | RPS | Saturation | AI suggestion |
|---|---|---|---|---|
| Search ads | 100K yen | 384 yen | 42% | Room to grow — far from saturation |
| Social ads (harvest) | 100K yen | 40 yen | 88% | Cut candidate — low revenue per click, plateauing |
| Social ads (prospecting) | 50K yen | 95 yen | 35% | Keep — valued as the new-visitor supply line |
Note that the AI doesn't say "kill social." It separates harvest placements from prospecting placements — the chapter-4 distinction — and hands you judgment material with the division already done.
FAQ#
Q1. Should I stop watching CPC entirely?
No — its role changes. CPC decides how many visits your budget buys, so keep using it to manage spend pacing. What you stop doing is judging channel quality by click price.
Q2. Are clicks and sessions the same thing?
Strictly, no. Ad consoles count clicks, GA4 counts sessions, and double-clicks or measurement differences create gaps of a few percent to the teens. For comparing efficiency across channels, pick one basis and divide consistently — that's enough in practice.
Q3. Should I shut down social ads with low RPS?
Not immediately. As chapter 4 explains, prospecting campaigns exist to create demand, and RPS alone grades them unfairly. First split campaigns by purpose (harvest vs prospecting), and only consider cutting harvest placements with low RPS.
Summary#
- CPC is the entry fee. Piles of cheap clicks that never convert don't grow revenue
- Grade channels by revenue ÷ clicks (RPS). Losing 8x on CPC while winning 10x on RPS is common
- The diagnosis is one division between your ad console and GA4 — five minutes
- For channels that bring new visitors, grade with new-visitor volume and share alongside RPS
See which ads actually drive revenue, at a glance
Free up to 5,000 sessions/month, AI analyst included. No credit card required. Up and running in 5 minutes.