"This CPC showing in my ad dashboard — is it high?" If you run an EC store, you see CPC every time you open a Google Ads or Meta Ads report. But what counts as a fair price, and how to judge it for your own business, stumps even practitioners.
CPC benchmarks vary widely by industry and channel: a few hundred yen per click is normal on search ads, while social ads can be an order of magnitude cheaper. And CPC is not a metric you judge by its absolute value alone — you judge ad efficiency only after combining it with the post-click CVR (conversion rate) and the revenue it generates.
Below we cover the definition, the formula, max CPC vs. actual CPC, the difference from CPA and CTR, benchmarks by channel, and four ways to lower CPC — then show how to decide your next budget by spotting which channel actually sells after you have lowered the cost per click.
Table of contents
Summary at a glance#
-
CPC = Ad spend ÷ Clicks
A metric for the cost incurred each time an ad is clicked. It is the "entry cost" of advertising.
-
Cheaper CPC is not always better
A cheap click means nothing if it does not convert. Always view it together with the post-click CVR and revenue.
-
The CPC you actually pay is set by auction
Advertisers set a "max CPC." The "actual CPC" you are charged depends on Ad Rank (bid × quality score).
-
The next budget after lowering CPC is decided by revenue efficiency per channel
Which channel actually sells is something you can only judge by comparing revenue per session (RPS), AOV, and CVR channel by channel.
1. What is CPC — the cost of one ad click#
CPC stands for Cost Per Click — "the cost incurred each time an ad is clicked," appearing as "cost per click" in both Google Ads and Meta Ads. It is the per-click entry cost of advertising; comparing it across campaigns shows which one attracts users most cheaply.
But CPC is a "cost up to the click." Whether the clicker actually bought, and how much revenue they generated, is invisible from CPC alone. This is the first pitfall: cheap clicks do not increase revenue unless they convert.
1.1 CPC vs. CPA vs. CTR#
CPC is often confused with CPA and CTR, but each measures a different point.
| Metric | What it measures | Formula |
|---|---|---|
| CTR | Share of impressions that were clicked | Clicks ÷ Impressions |
| CPC | Cost per click | Ad spend ÷ Clicks |
| CPA | Cost per conversion | Ad spend ÷ Conversions |
They connect in a single line. Advertising flows "impression → click → conversion": CTR captures how easily an ad is clicked, CPC how cheap the click is, and CPA the efficiency up to conversion. The relationship is CPA = CPC ÷ CVR — so a low CPC still produces a high CPA when CVR is low. For detail, see What Is CPA? The Basic Metric and Formula for Cost Per Conversion.
2. The CPC formula and a worked example#
There is only one CPC formula.
CPC = Ad spend ÷ Clicks
For example, 300,000 yen of ad spend in a month generating 5,000 clicks gives 300,000 ÷ 5,000 = 60 yen — it cost 60 yen to bring one person to your site.
2.1 Max CPC vs. actual CPC — set by auction#
A key point is that the "max CPC" an advertiser sets and the "actual CPC" they are charged are two different things.
- Max CPC (bid): the upper limit you are willing to pay per click. Set by the advertiser.
- Actual CPC: the amount actually charged — usually lower than the max CPC.
On search ads, slots are decided by auction. In Google Ads, position is calculated as Ad Rank = bid × quality score, where quality score measures the relevance among the ad, keyword, and landing page. A higher quality score ranks you higher even at a lower bid, lowering your actual CPC.
So the key to lowering actual CPC is not "raising your bid" but "raising your quality score" — which connects directly to the levers in section 4.
3. CPC benchmarks by industry and channel, and the pitfalls#
CPC benchmarks differ greatly by industry. In a large-scale U.S. benchmark study, industry CPC for search advertising (Google Search) roughly falls into the ranges below.
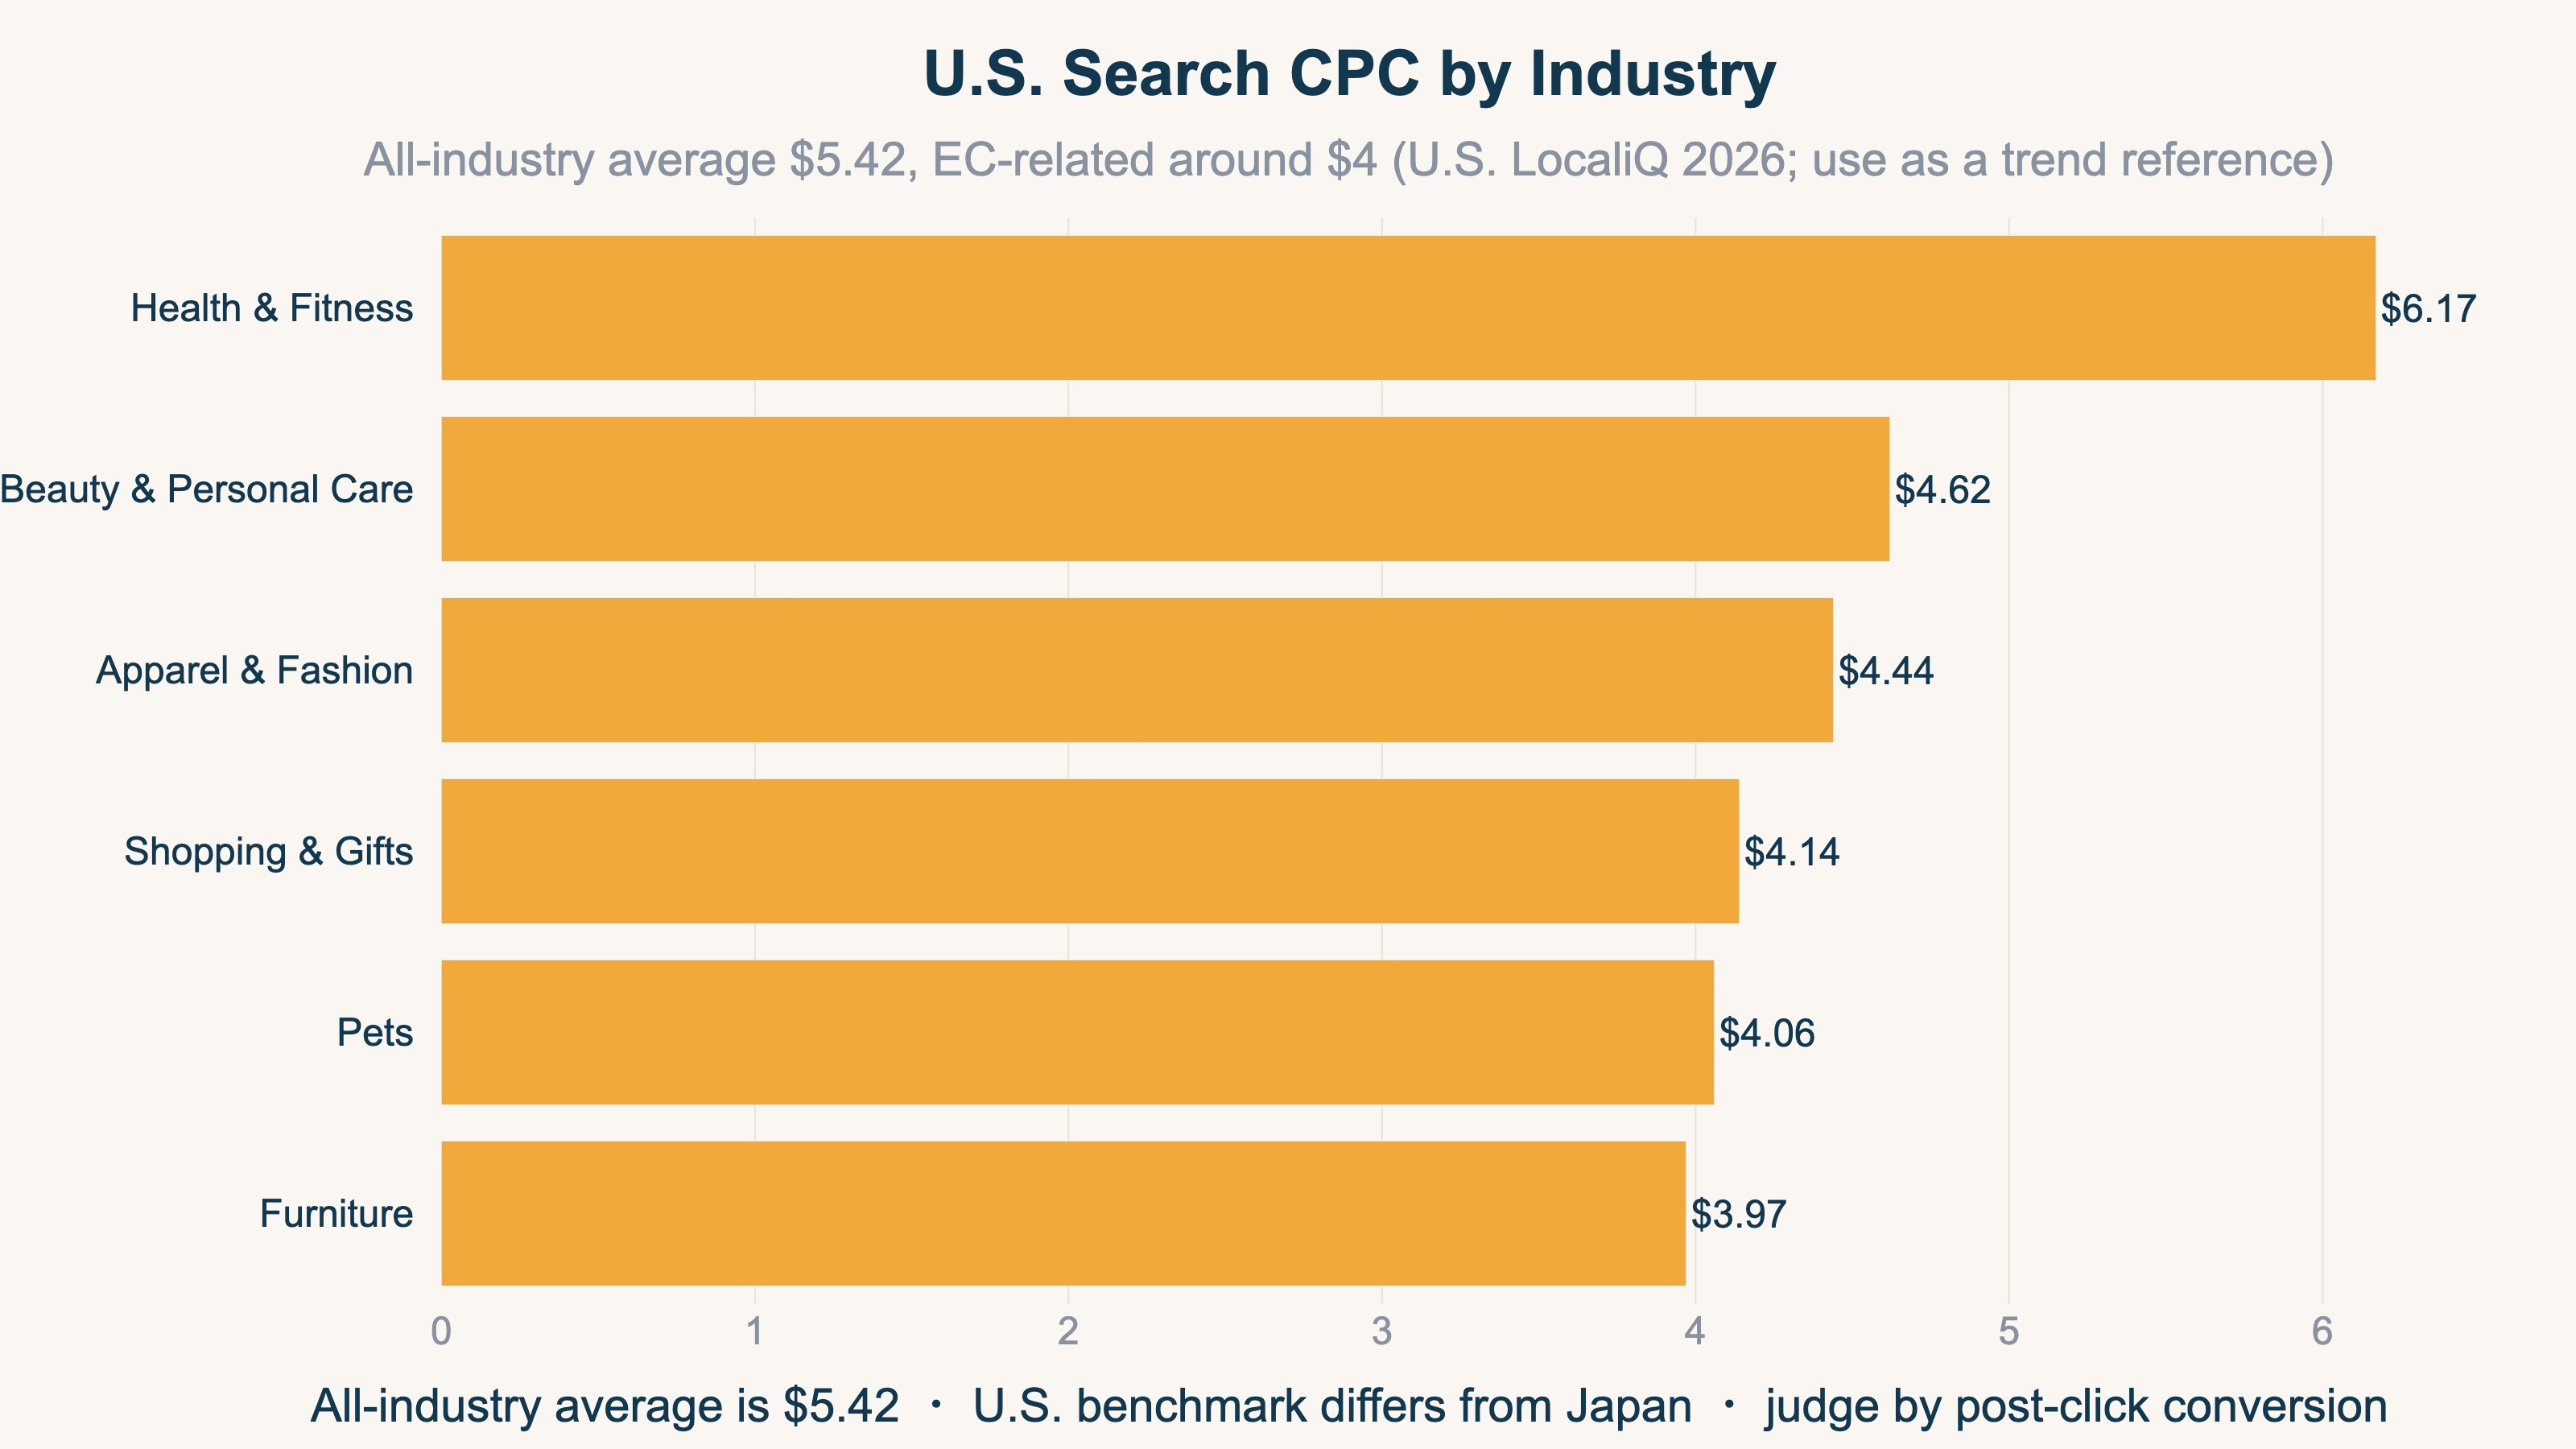
In U.S. search advertising, the all-industry average CPC is about $5.4, and EC-related industries sit around $4 [1]. This is U.S. market data, however, and differs from other markets due to currency and competitive environment, so treat these figures only as a sense of the trend. Judging CPC by an industry benchmark's absolute value alone is dangerous — always check it against your own post-click CVR and revenue.
3.1 Search ads and social ads are a different game#
CPC also changes by an order of magnitude depending on the channel. Search ads (Google Search) vs. social ads (Facebook) from the same source (U.S. market) makes the gap obvious.
| Industry | Search ads CPC | Social ads CPC |
|---|---|---|
| Apparel & fashion | $4.44 | $0.86 |
| General merchandise & gifts | $4.14 | $0.34 |
| Beauty & personal care | $4.62 | $0.74 |
| Furniture | $3.97 | $0.85 |
All figures are averages from U.S. market benchmarks (search = 2026 edition [1], Facebook = 2025 edition [2]). Absolute amounts differ by market, but the cross-channel trend that social ad CPC runs at less than one-fifth of search ad CPC holds elsewhere too.
But a channel with cheap CPC is not necessarily "a good deal." Search ads catch high-intent users ("I want it now"), so CPC is high but CVR is also high; social ads reach a broad latent audience, so CPC is cheap but CVR tends to be low. Choosing a channel by CPC alone risks buying a flood of cheap clicks with zero conversions.
4. Four ways to lower CPC#
The levers for lowering actual CPC fall into four broad groups.
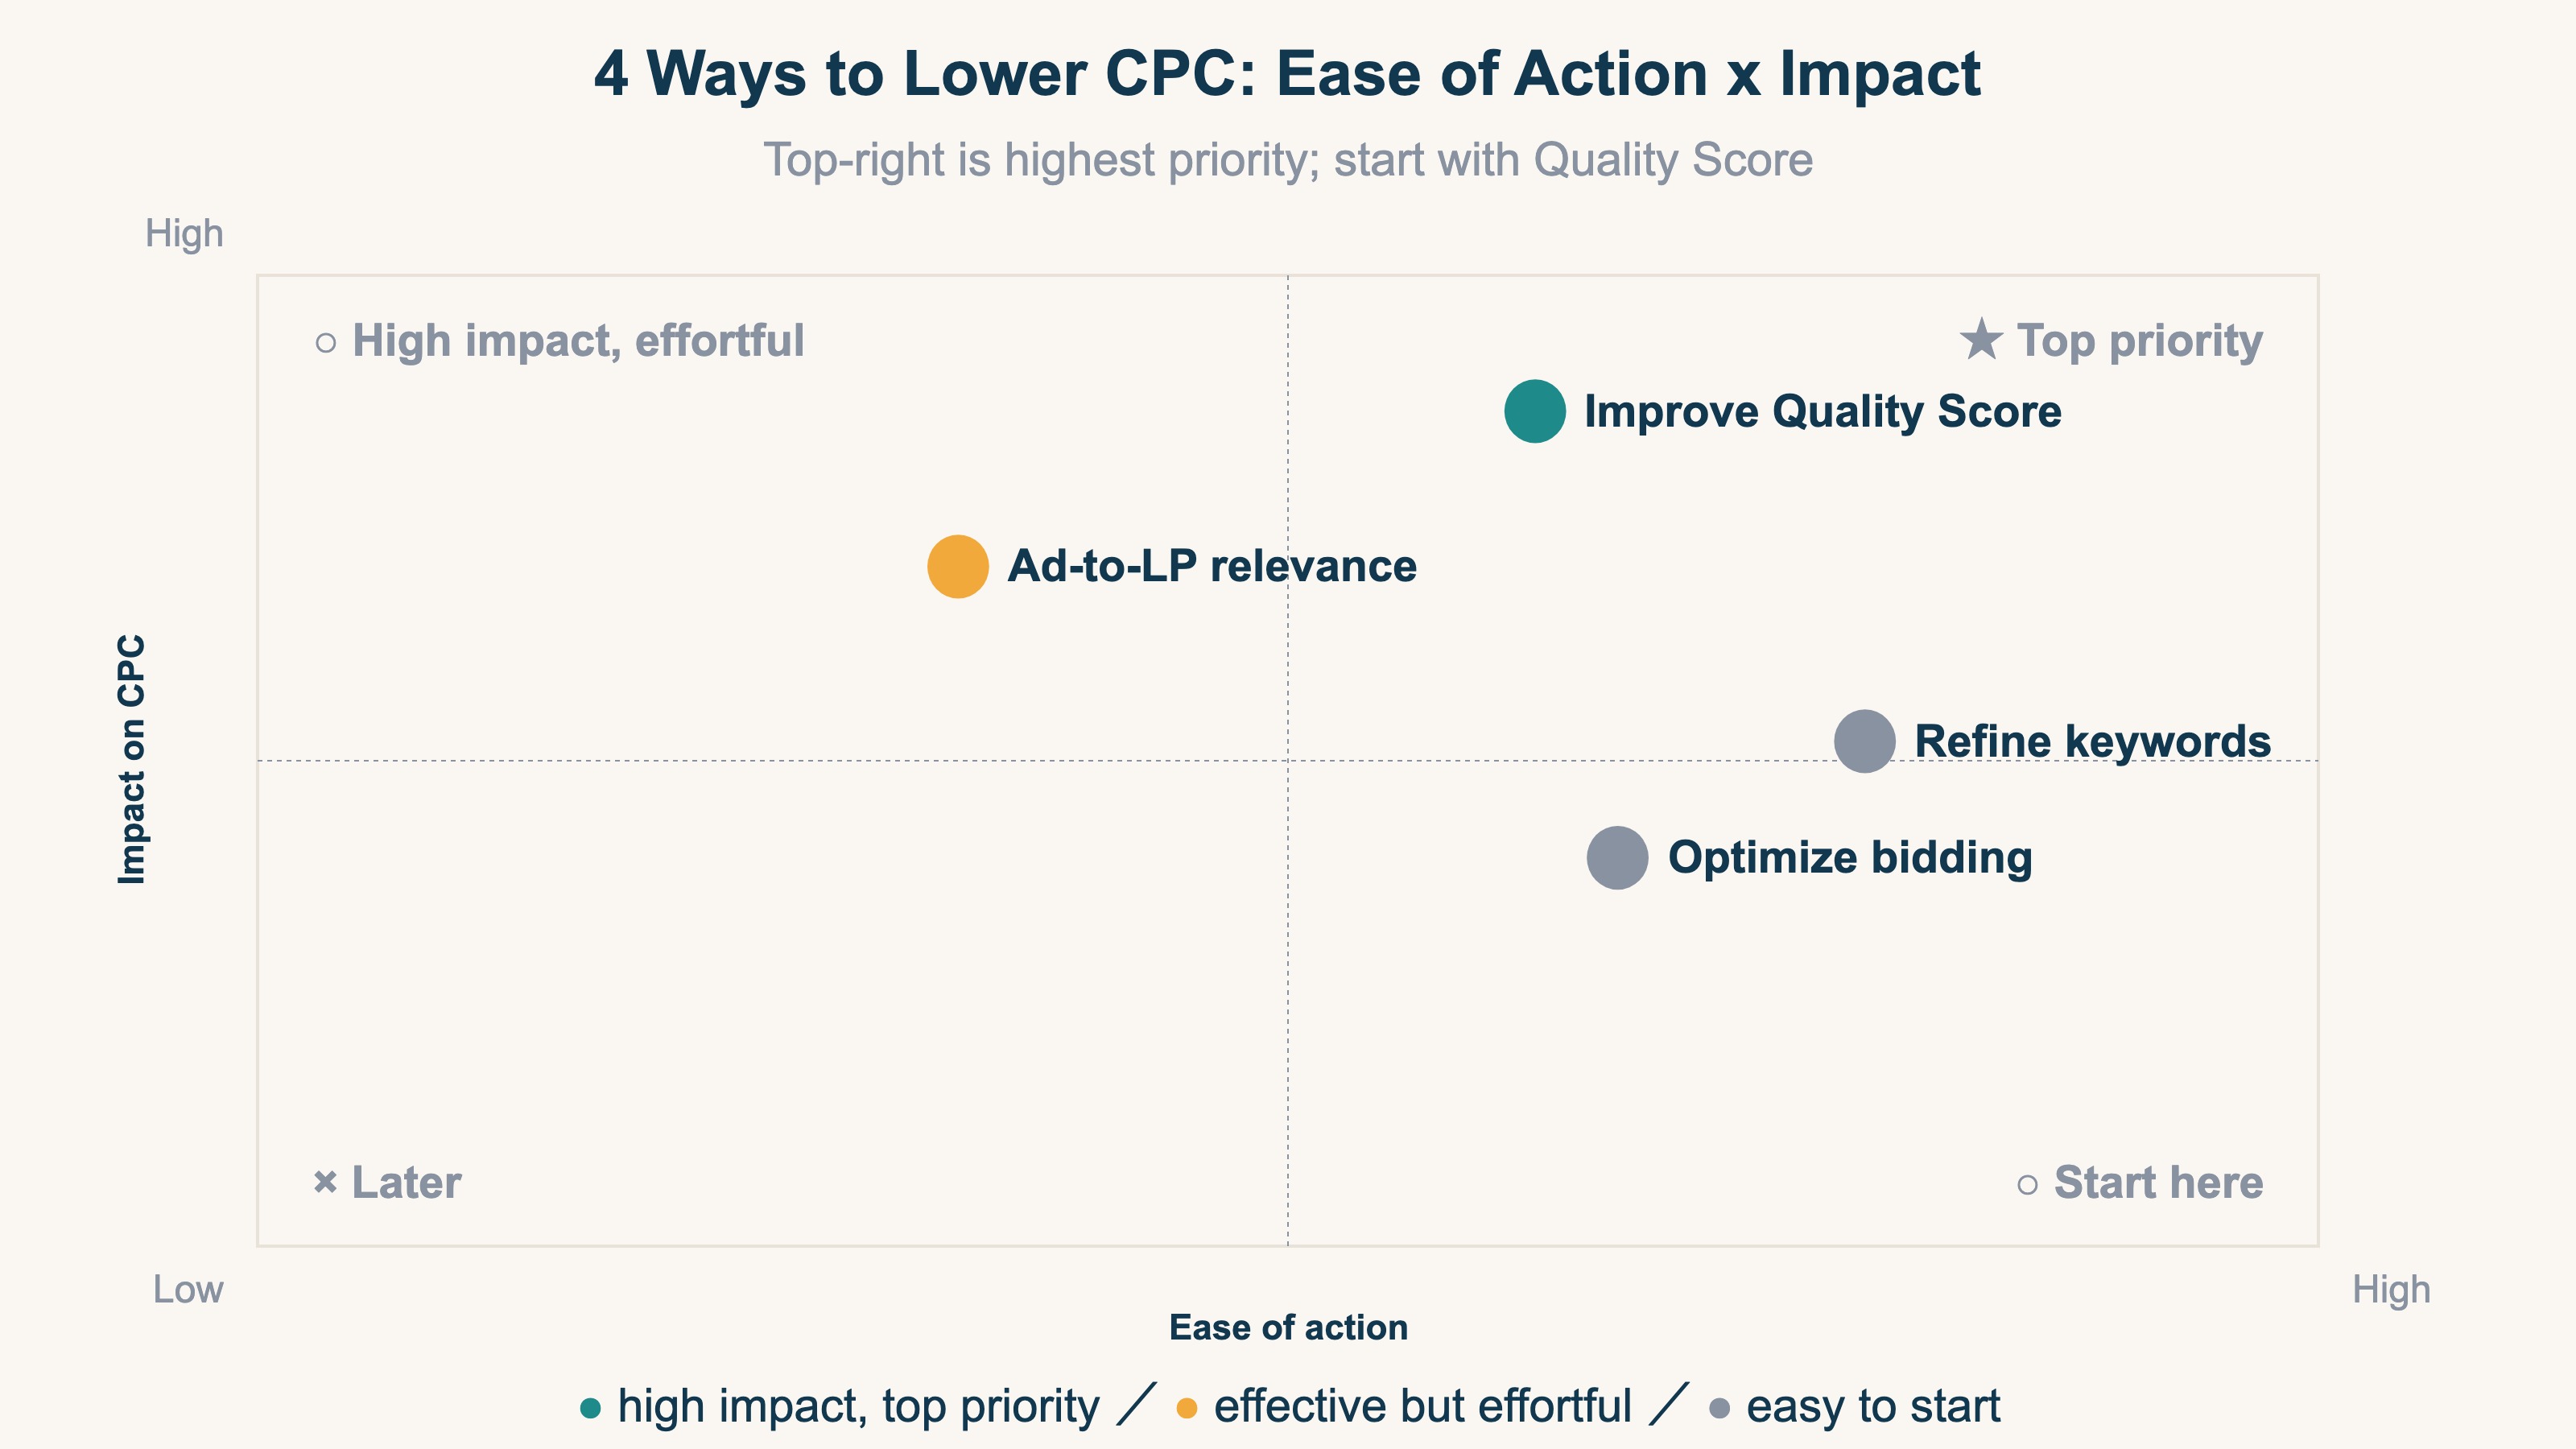
By priority, "1. Improve quality score" tends to be the most effective. Since actual CPC is set by "Ad Rank = bid × quality score," a higher quality score ranks you higher without raising your bid, lowering actual CPC. Aligning your ad copy, keywords, and landing page is the foundation of that improvement.
Note, though, that "lowering CPC" itself is not the goal. Even if you halve your CPC, revenue will not rise by a single yen unless the person who clicked converts. Right after lowering CPC, you always hit the same question: "Of these cheaper clicks, which channel is actually generating revenue?" The next section tackles that head-on.
5. Lowering CPC does not decide your next budget — revenue efficiency by channel#
Lowering CPC only gets you as far as "making the entry cost cheaper." Where to send your next budget is not decided by CPC alone.
Suppose you apply CPC-lowering tweaks to three channels and manage to bring each actual CPC down. If you then think "let's send budget to the channel with the cheapest CPC," you will misjudge. You can buy cheap clicks, but if they do not sell, the more you buy the deeper the loss.
What to look at here is not the cheapness of the click but the revenue efficiency after the click. Specifically, line up three numbers channel by channel: revenue per session (RPS), average order value (AOV), and conversion rate (CVR).
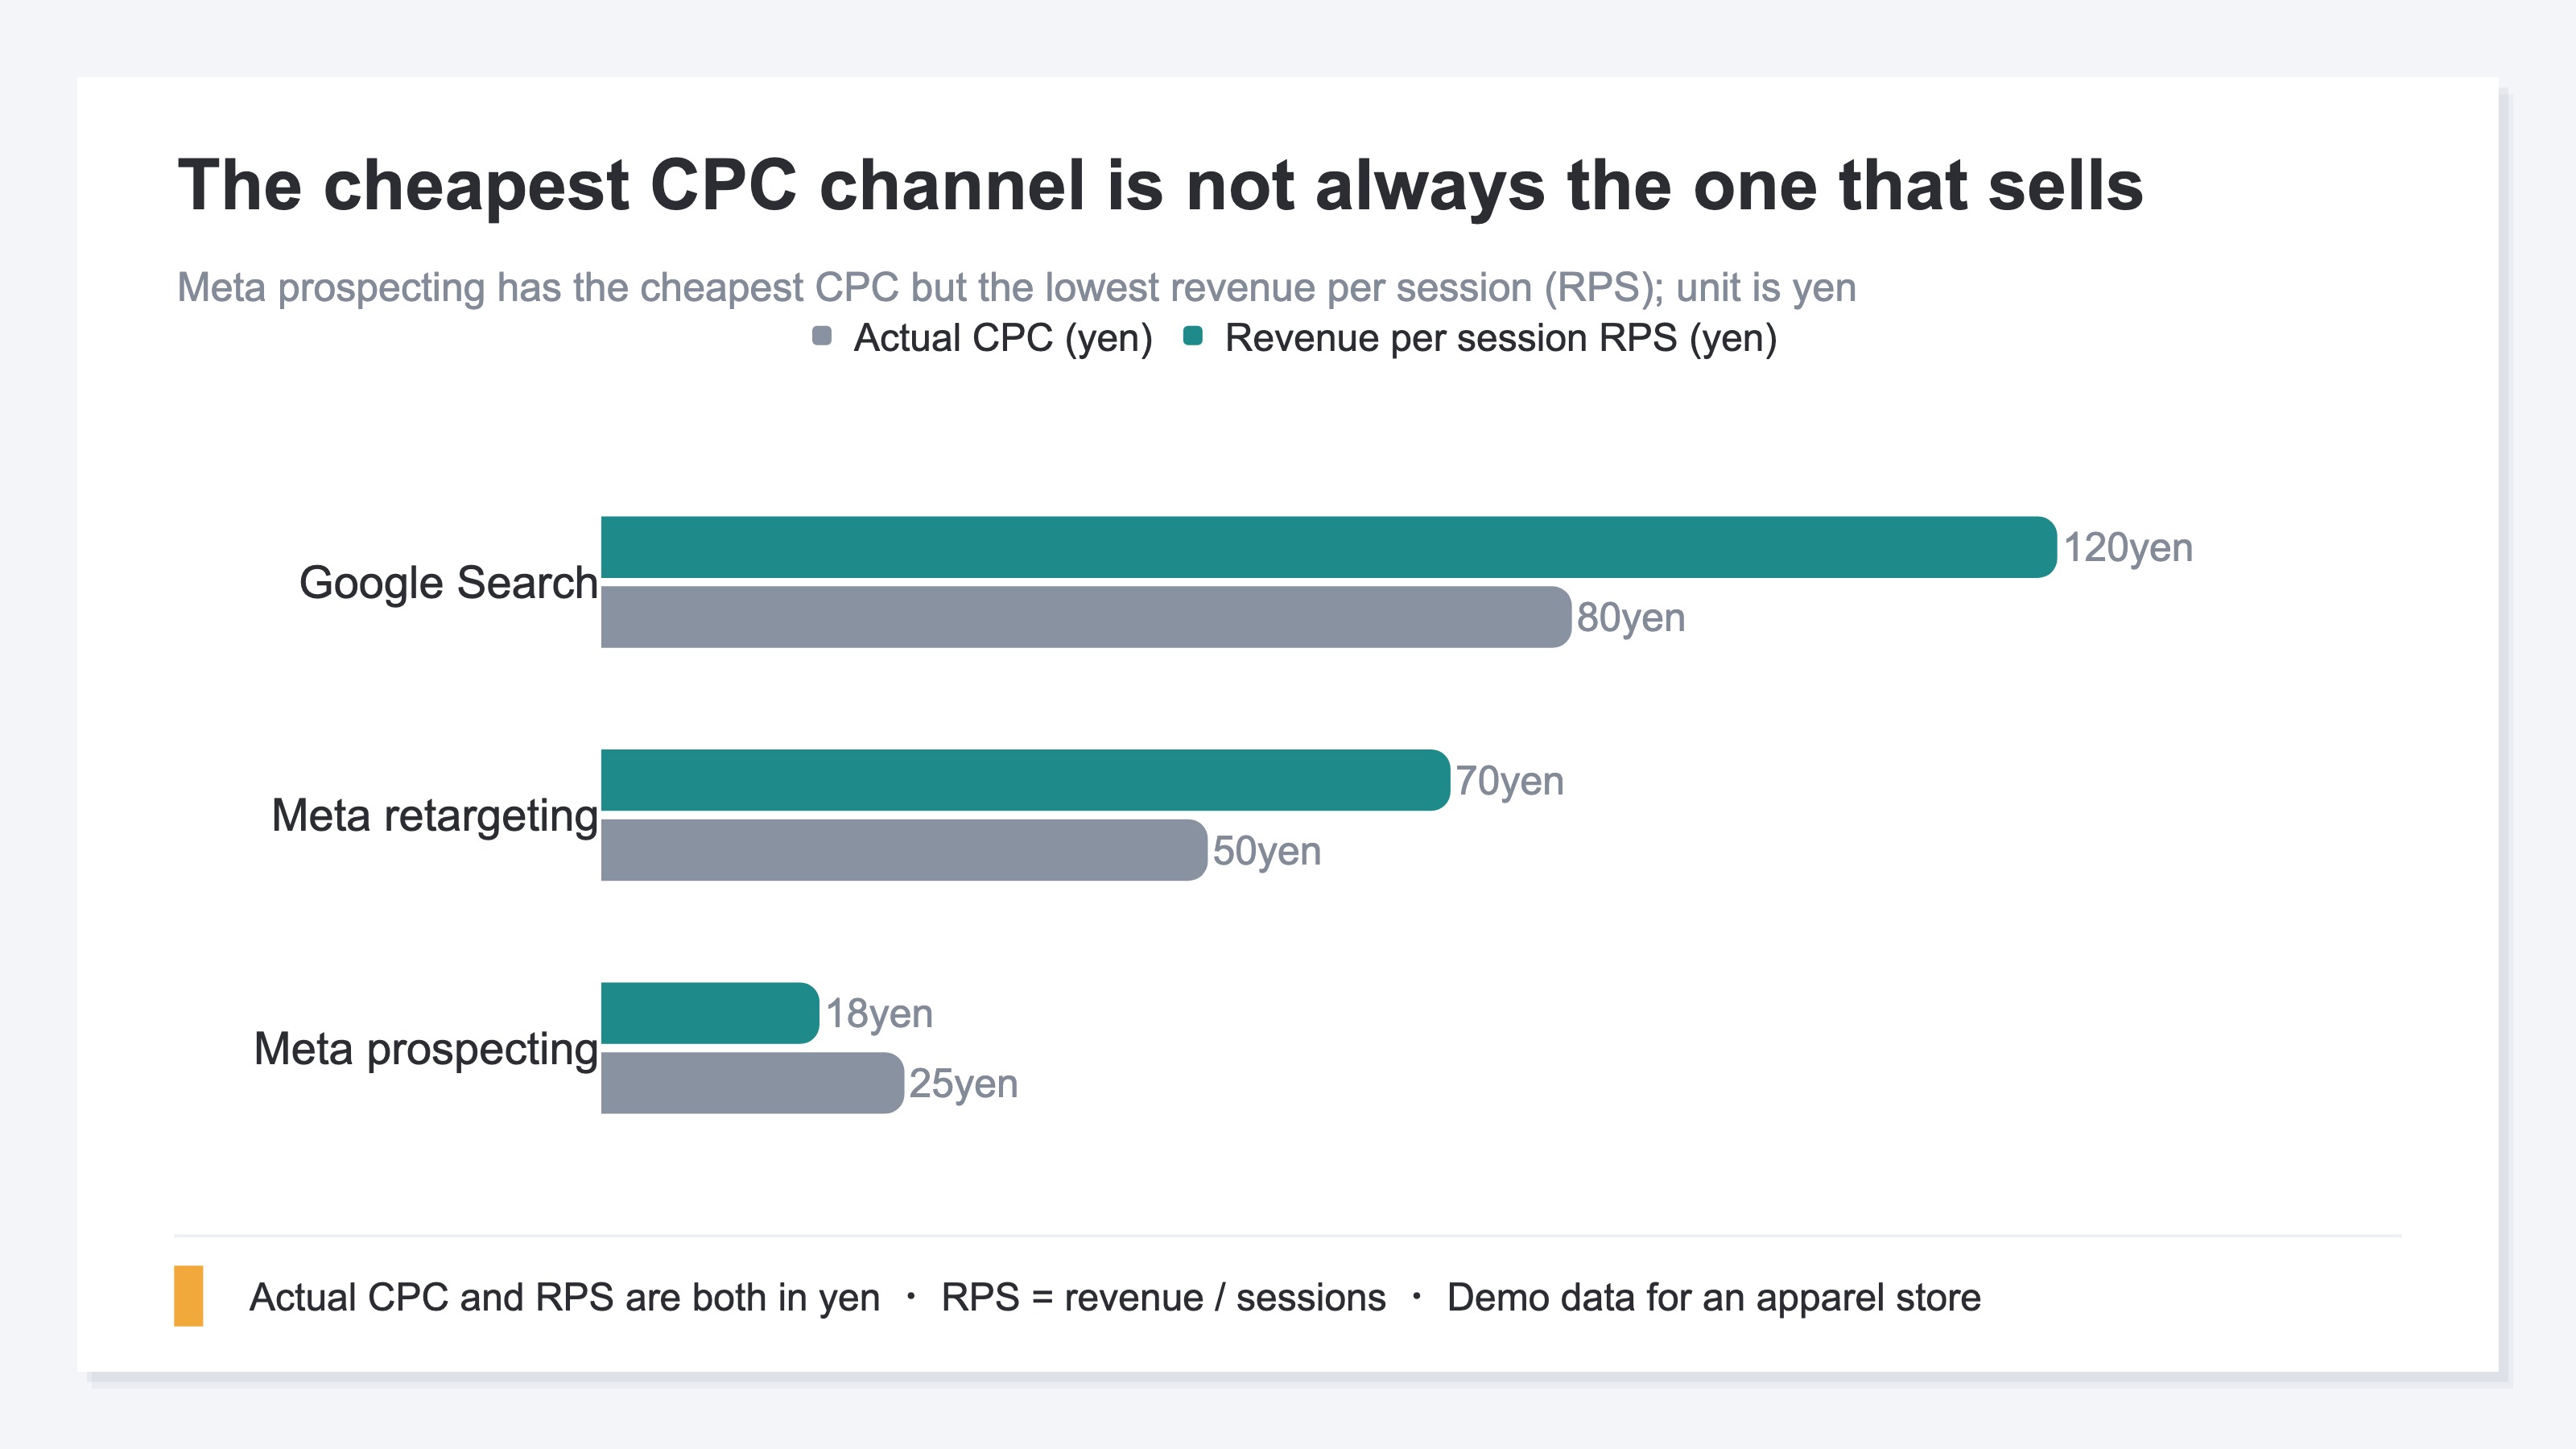
| Channel | Actual CPC | CVR | RPS | Verdict |
|---|---|---|---|---|
| Google Search | 80 yen | 2.5% | 120 yen | ◯ Keep, add budget |
| Meta retargeting | 50 yen | 1.8% | 70 yen | ◯ Keep |
| Meta prospecting | 25 yen | 0.4% | 18 yen | × Fix or stop |
Meta prospecting has the cheapest CPC, yet the verdict is "stop." At a CPC of 25 yen, if a single session generates only 18 yen of revenue (RPS), the more clicks you buy the deeper the loss. Google Search, by contrast, costs 80 yen per click but earns RPS 120 yen — per click, it leaves a solid profit. Only here does CPC turn from "the cheapness of a click" into "the basis for a budget allocation decision."
One caveat: channels whose job is to bring in new customers — Meta prospecting being the prime example here — look unfairly bad when judged on first-visit RPS alone, because their real work is making first encounters. For prospecting, read RPS alongside how many new visitors it brought in, and reserve an outright "stop" for harvesting campaigns with low RPS. Meta prospecting earns its "stop" in this example because its 0.4% CVR signals genuinely low purchase intent — it wasn't even doing the job of making good first encounters (see The Cheap-Click Trap).
The thinking itself is not hard. You just gather each channel's actual CPC and the RPS, AOV, and CVR that follow into one view and compare them. What is heavy is assembling this across channels, by hand, every time. Each ad platform's dashboard only shows you up to CPC; the revenue that follows lives outside the dashboard. GA4 can give channel-level totals, but getting deduplicated RPS, AOV, and CVR per channel into one view is structurally a manual rebuild.
RevenueScope's solution
Let us see how "decide your next budget by revenue efficiency per channel, after lowering CPC" actually looks. RevenueScope consolidates per-channel revenue efficiency into one view, from GA4 and your site's revenue data. It shows four metrics: Revenue / AOV (average order value) / RPS (revenue per session) / CVR (conversion rate).
| Channel | RPS (revenue per session) | AOV | CVR |
|---|---|---|---|
| Google Search | ¥120 | ¥4,800 | 2.5% |
| Meta retargeting | ¥70 | ¥3,900 | 1.8% |
| Meta prospecting | ¥18 | ¥4,500 | 0.4% |
(Illustrative of how it looks per channel in RevenueScope. Figures are demo data.)
Reading this view (demo data for an apparel store), two things are immediately clear. First, Meta prospecting may have the cheapest CPC, but its revenue per session (RPS) is ¥18 and its conversion rate (CVR) 0.4% — the lowest. Second, Google Search has a high CPC yet the best efficiency, at RPS ¥120 and CVR 2.5%. Send budget by cheapness of CPC and you flow to Meta prospecting; read it by revenue efficiency and the decision reverses.
The next move is clear. Pause the increase to Meta prospecting, and send your next budget to top-efficiency Google Search and steady Meta retargeting. Where CPC alone would tempt you to "scale the cheapest Meta prospecting," per-channel RPS, AOV, and CVR set you straight.
Let us draw the boundary clearly. RevenueScope does not calculate CPC, ROAS, or ad spend itself. CPC is a number from the ad dashboard, and we deliberately keep no direct ad-API integration. What RevenueScope outputs is deduplicated per-channel revenue efficiency (Revenue / AOV / RPS / CVR / Sessions), available in five minutes with one tag. Check CPC in your ad dashboard, and use RevenueScope to compare how much revenue, and at what efficiency, each click generates. For more on budget allocation, see Industry ROAS Benchmarks 2026 and Gross Margin and Break-Even ROAS.
FAQ#
Q. What is a normal CPC?
It varies greatly by industry and channel. In U.S. search advertising the average is about $5 per click, with social ads at less than one-fifth of that [1][2]. But these are U.S. figures and differ elsewhere. What matters more than a benchmark is checking, for your own business, whether each click generates revenue.
Q. What causes CPC to rise?
On search ads, a low quality score is the main cause: when the relevance among ad copy, keyword, and landing page is low, Ad Rank drops and a higher bid is needed to win the same position. Popular, crowded keywords also push CPC up.
Q. Will lowering CPC increase revenue?
Not necessarily. Even if you halve CPC, revenue stays the same unless the person who clicked converts. After lowering CPC, compare revenue per session (RPS) and conversion rate (CVR) channel by channel, and allocate budget by "whether you are buying revenue-generating clicks cheaply."
Q. Can RevenueScope produce CPC or ROAS?
No. What RevenueScope outputs is the revenue efficiency of Revenue / AOV / RPS / CVR; it does not calculate CPC, ROAS, or ad spend itself. Check CPC in your ad dashboard, and use RevenueScope's per-channel revenue efficiency to compare whether those clicks actually sell.
Summary#
CPC is a metric for "the cost of one ad click." Four key points:
- CPC = Ad spend ÷ Clicks. It measures the entry cost of advertising, but post-click conversion and revenue are invisible from CPC alone.
- The CPC you actually pay is set by auction. Raising your quality score lowers actual CPC more readily than raising your max CPC (bid).
- Cheaper CPC is not always better. A flood of cheap clicks does not increase revenue unless they convert.
- The budget allocation after lowering CPC is decided by revenue efficiency per channel. Compare actual CPC with RPS, AOV, and CVR channel by channel, and send budget to the channels that sell efficiently.
Whether a CPC is good or bad is decided not by an industry benchmark's absolute value, but by your own post-click revenue efficiency (RPS, AOV, CVR). Lower the cost per click, and keep yourself able to compare "which channel to scale" by per-channel revenue efficiency — that is how you run your ad budget without waste.
See which ads actually drive revenue, at a glance
Free up to 5,000 sessions/month, AI analyst included. No credit card required. Up and running in 5 minutes.