"This CTR in our ad dashboard — is it high?" If you run an EC store, you see CTR (click-through rate) every time you open a Google Ads or Meta Ads report. CTR measures "what percentage of ad impressions resulted in a click."
But a higher CTR does not always grow revenue — because clicks from people with no intent to buy also push CTR up. Below we cover the definition, formula, and benchmarks by placement, then explain why a high CTR fails to grow revenue and how to spot the channels that actually sell, all from an EC operator's perspective.
Table of contents
Summary at a glance#
-
CTR = Clicks ÷ Impressions
The percentage of ad impressions that resulted in a click. It is the "pull power" of an ad.
-
A higher CTR is not always better
Clicks from people with no intent to buy also lift CTR. A high CTR that does not convert will not grow revenue.
-
Benchmarks differ by an order of magnitude across placements
Search ads run at 5–7%, display ads at 0.5–1%. The same "3%" can mean opposite things.
-
How to spot a high-CTR channel that does not sell
Use bot-excluded revenue per session (RPS), average order value (AOV), and conversion rate (CVR) by channel to find the channels that truly perform.
1. What is CTR — clicks per impression#
In short: CTR measures "what percentage of ad impressions resulted in a click" — the pull power of an ad.
CTR stands for Click Through Rate. Google Ads labels it "click-through rate," and Meta Ads calls it "CTR (link click-through rate)" [1].
CTR captures the pull power of an ad on a per-impression basis. Lining up CTR across campaigns and creatives shows which ads catch the user's attention.
But CTR only measures how easily an ad is clicked. Whether the person who clicked actually bought, and how much revenue they generated, is invisible. This is the first pitfall: clicks from people with no intent to buy still raise CTR.
1.1 CPC and CVR — how they differ#
CTR is easily confused with two metrics: CPC (cost per click) and CVR (conversion rate). Each measures a different point.
| Metric | Formula | What it measures | Primary use |
|---|---|---|---|
| CTR | Clicks ÷ Impressions | Click rate per impression | Ad pull power |
| CPC | Ad spend ÷ Clicks | Cost per click | Bidding efficiency |
| CVR | Conversions ÷ Clicks | Conversion rate per click | LP closing power |
CTR covers "impression to click," CPC covers "the cost of one click," and CVR covers "click to conversion." The relationship CTR × CVR × Impressions = Conversions lets you decompose ad efficiency and locate the weak point. For benchmarks and how to lower the cost per click itself, see What Is CPC? Cost Per Click Formula, Industry Benchmarks, and How to Lower It.
2. The CTR formula and a worked example#
In short: there is only one formula — divide clicks by impressions.
CTR = Clicks ÷ Impressions × 100%
If an ad received 100,000 impressions over a month and generated 5,000 clicks, CTR is 5,000 ÷ 100,000 = 5%.
2.1 Campaign-level CTR comparison#
Listing campaigns side by side makes the differences clear.
| Campaign | Impressions | Clicks | CTR |
|---|---|---|---|
| Brand search | 20,000 | 3,000 | 15.0% |
| Generic search | 50,000 | 2,500 | 5.0% |
| Meta retargeting | 80,000 | 2,000 | 2.5% |
| Meta prospecting | 150,000 | 1,500 | 1.0% |
| Total | 300,000 | 9,000 | 3.0% |
Brand search CTR is far higher than the rest. People searching your brand name have strong intent, so a high CTR is natural. Meta prospecting at 1.0% serves a broad, lower-intent audience, so judging its absolute value as "too low" at a glance is premature. The same CTR means very different things depending on placement and audience.
3. Why CTR benchmarks vary by an order of magnitude#
In short: CTR benchmarks vary by an order of magnitude by placement and industry. A 3% on search ads and a 3% on display ads mean opposite things.
International benchmark studies place CTR medians by placement roughly in the ranges below [2].
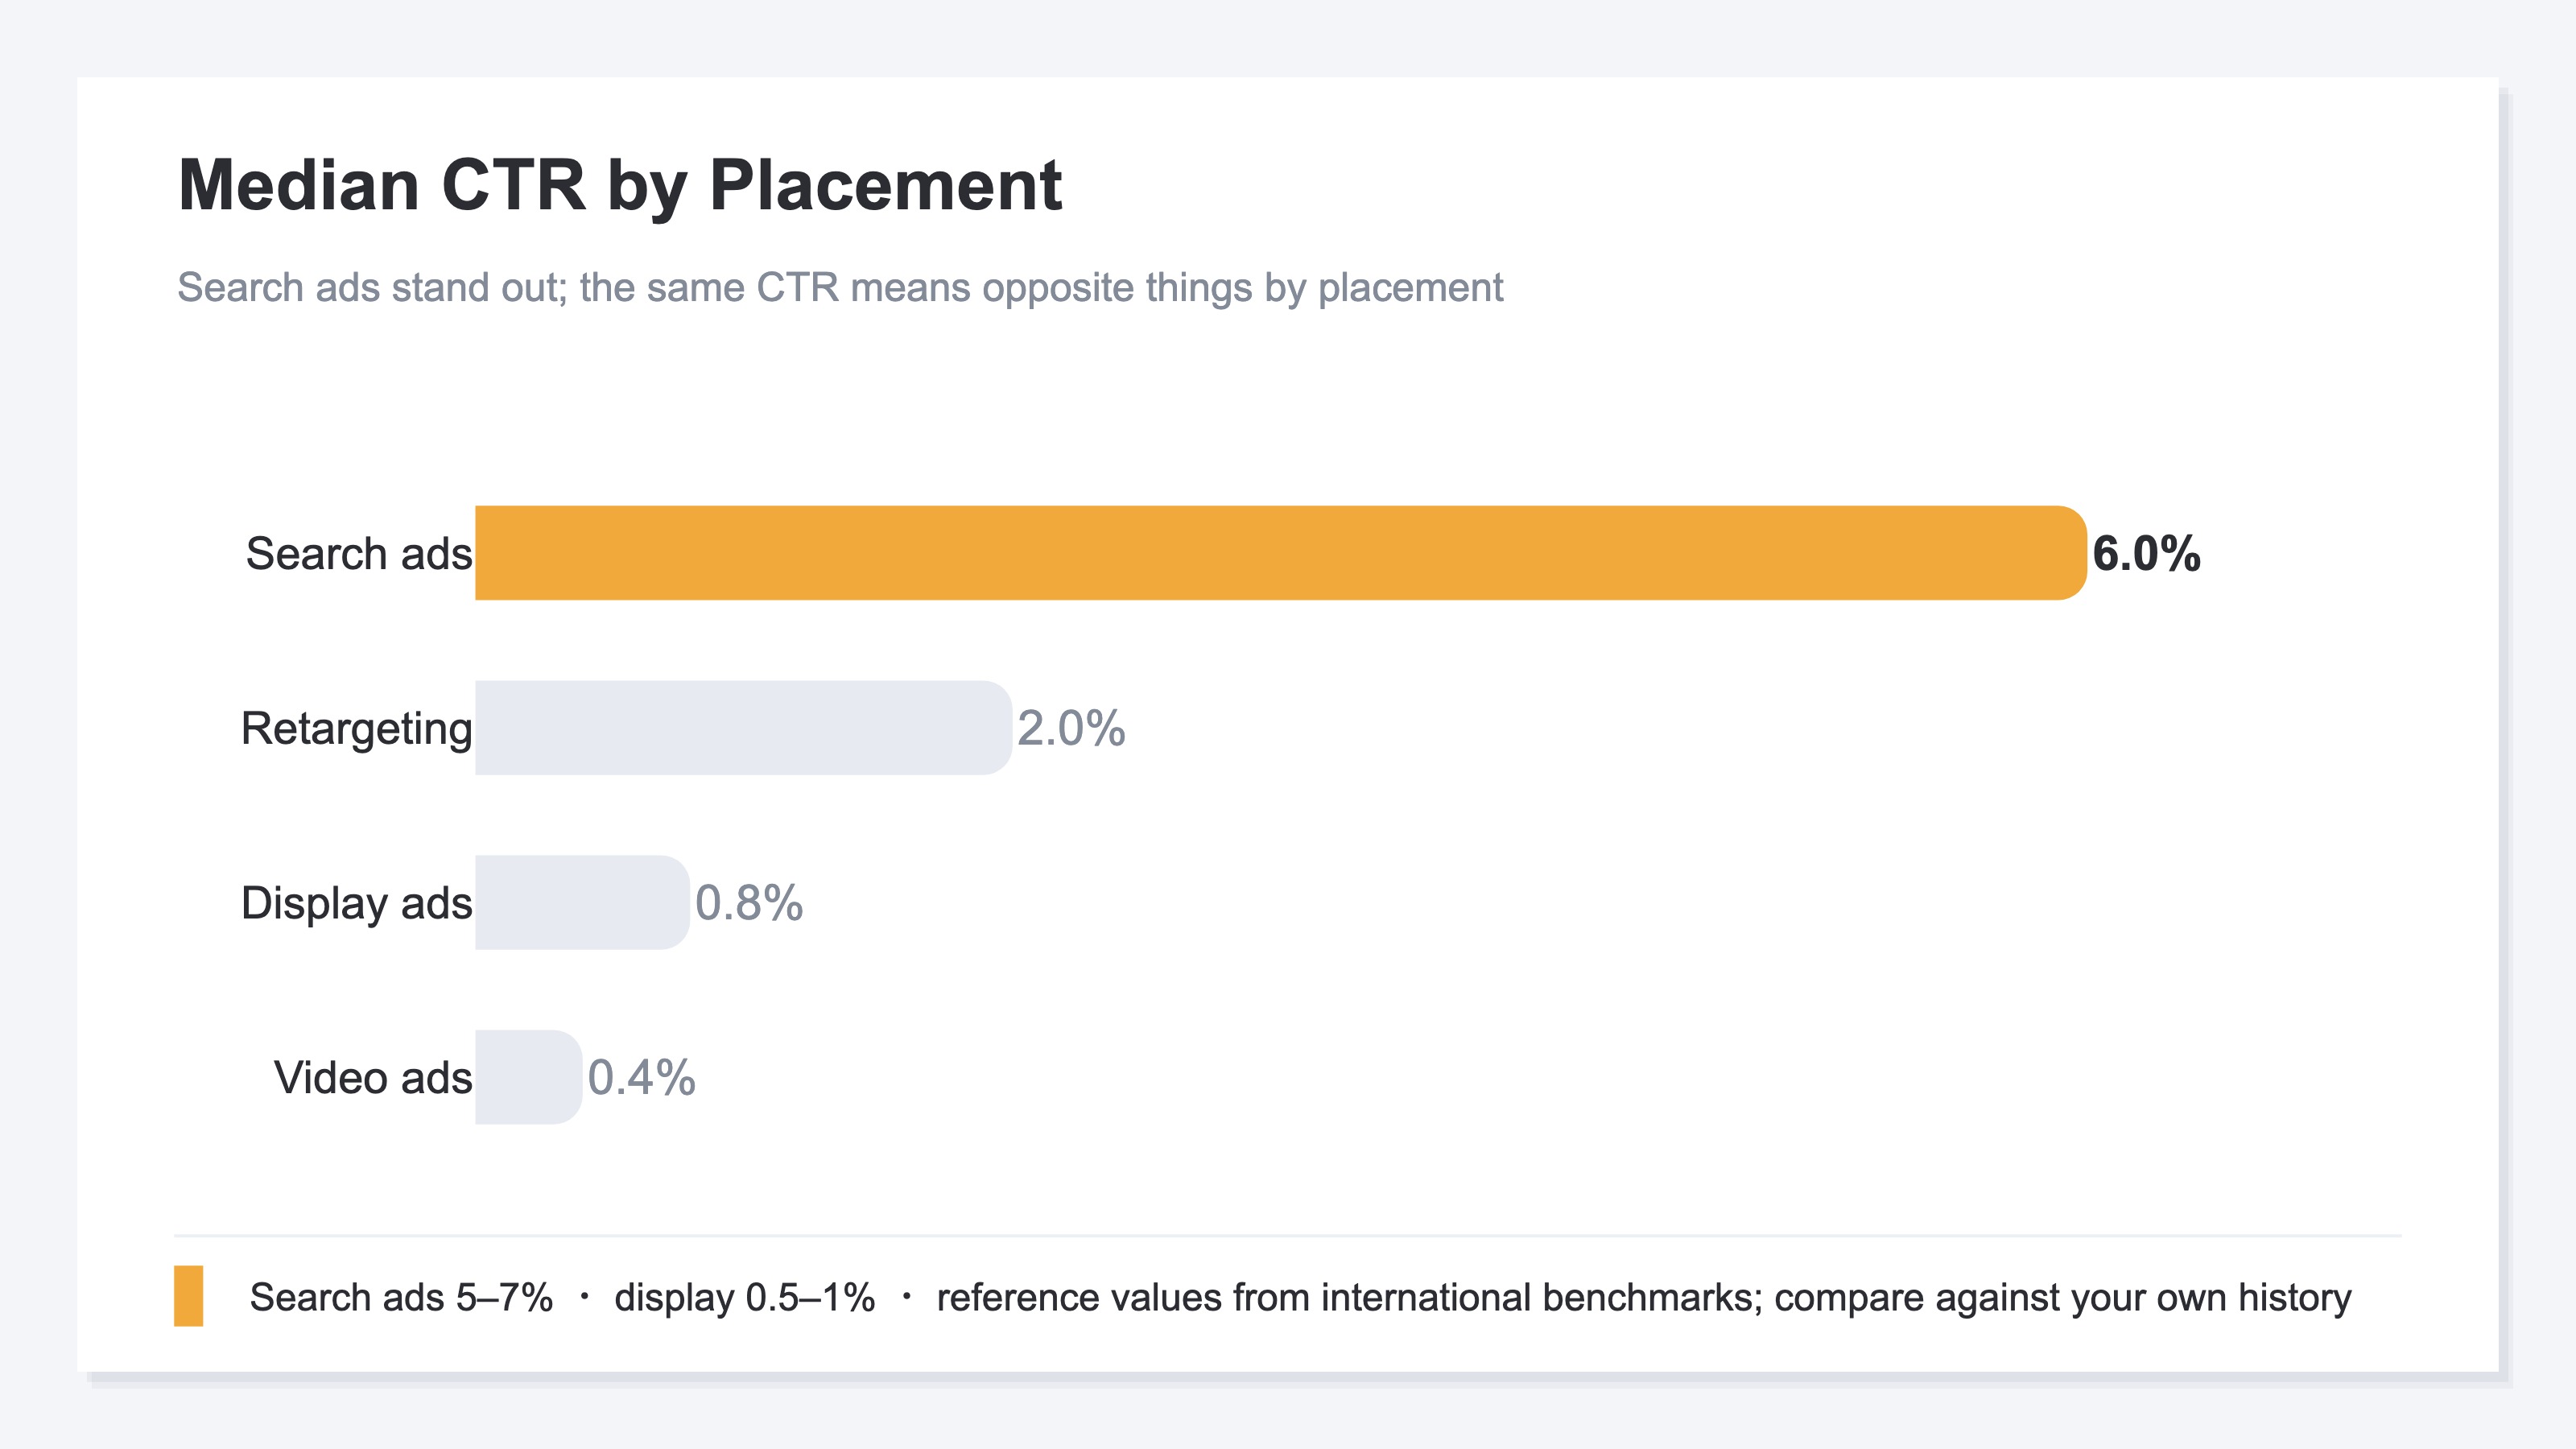
These are reference values from international studies. Judging CTR by an industry benchmark's absolute value alone is dangerous — always compare against your own historical performance.
3.1 Search and display CTR are different beasts#
The first split when reasoning about CTR is search vs. display.
| Placement | Median CTR | Evaluation lens |
|---|---|---|
| Search ads (Google/Yahoo) | 3–7% | Keyword-to-copy match |
| Display ads (GDN/Meta) | 0.5–1% | Creative-audience fit |
| Video ads (YouTube) | 0.3–0.5% | Thumbnail and opening seconds |
| Retargeting | 1–3% | Visitor intent and frequency |
A 3% CTR on search ads is "on the low side," while a 3% CTR on display ads is "unusually high" and signals users already strongly interested in your site. Averaging CTR across placements leads to misjudged priorities. Always separate by placement before comparing. For fixing impressions that do not convert to clicks, see Fixing Low CTR When You Have Impressions but No Clicks.
4. Why a high CTR fails to grow revenue#
In short: a high CTR fails to grow revenue because CTR only measures how easily an ad is clicked — whether that click leads to revenue is a separate question. There are three main reasons.
Reason 1: placement mismatch. As shown above, a 3% on search and a 3% on display mean opposite things. Averaging CTR across placements lets display's unusually high CTR pull your budget toward a low-intent surface.
Reason 2: bot and invalid clicks inflate CTR. Since CTR is set purely by "how easily an ad is clicked," bots and invalid clicks (mis-taps, automated crawling) inflate the number. CTR is the ad metric most prone to this inflation. Once you remove bots and invalid clicks from raw clicks, valid clicks shrink like this.
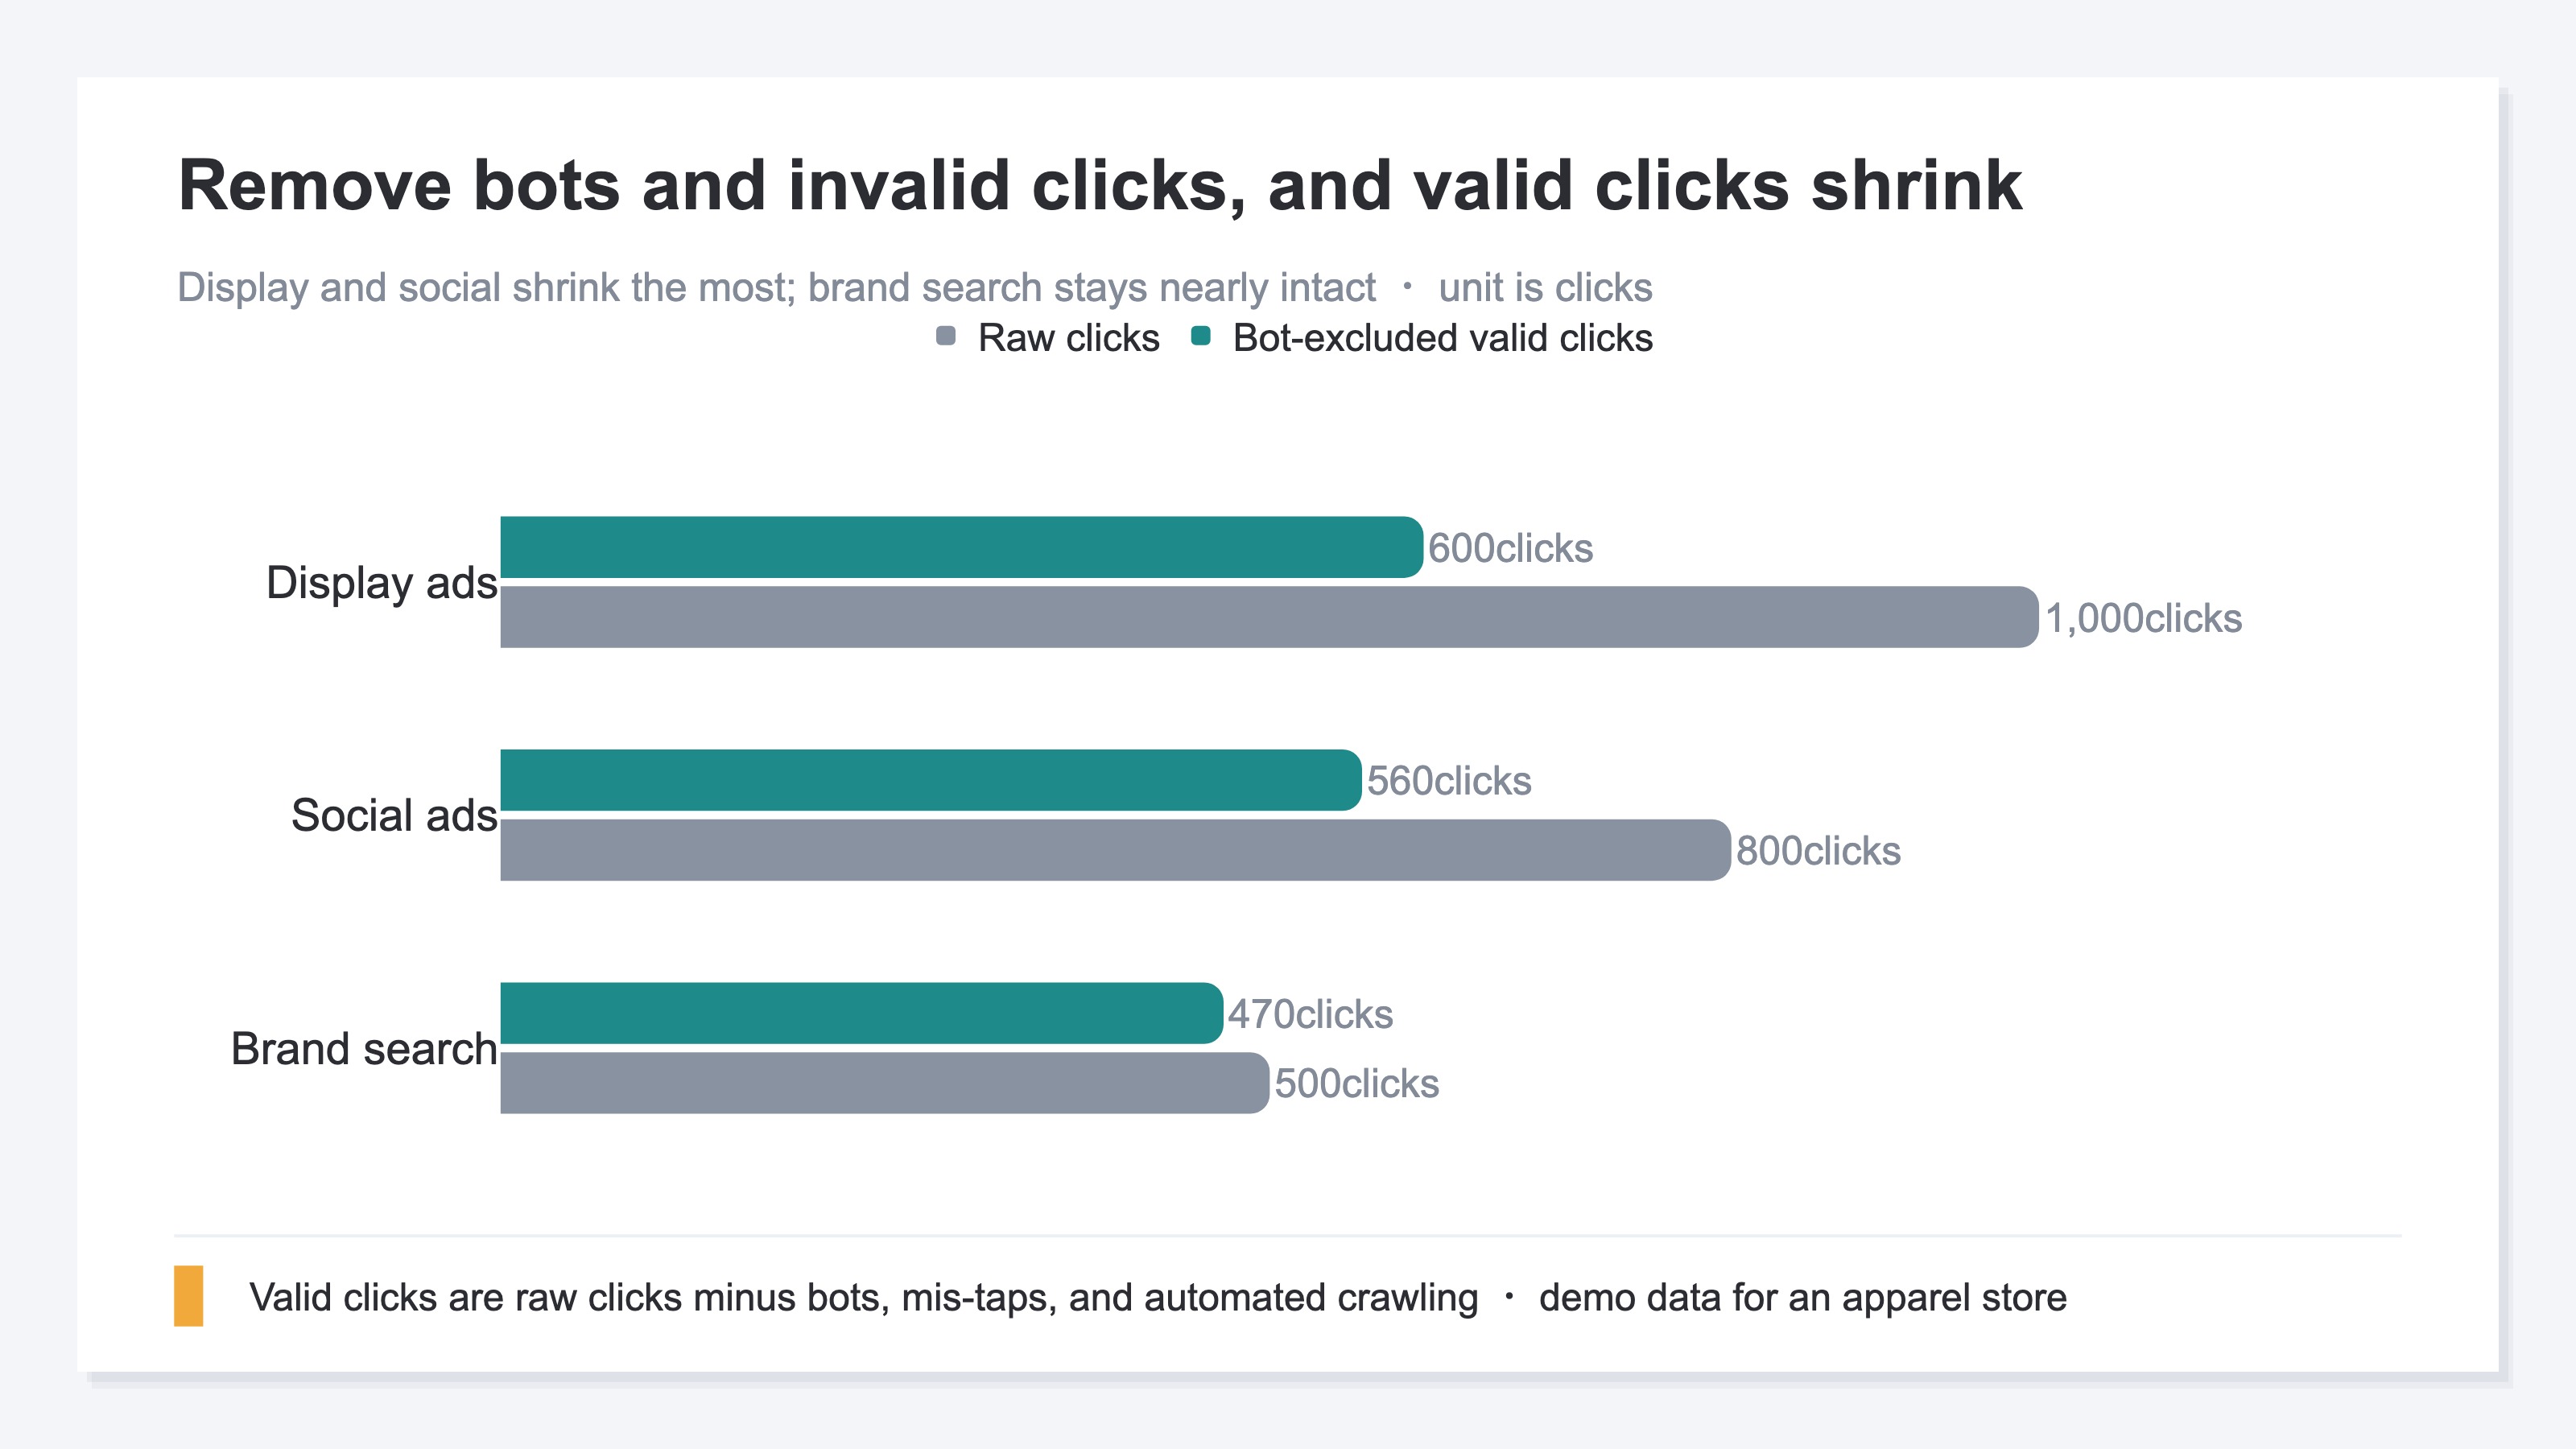
Display and social ads attract more bots and mis-taps, so their CTR runs higher than reality. Brand search, driven by intentional clicks, barely shrinks. For the difference between invalid clicks and bot exclusion, see Invalid Clicks vs. Bot Exclusion.
Reason 3: broad reach to low-intent audiences. High-CTR creatives (discount hype, eye-catching images) draw clicks from people with no intent to buy. Clicks rise, but if they do not buy, revenue per session (RPS) does not.
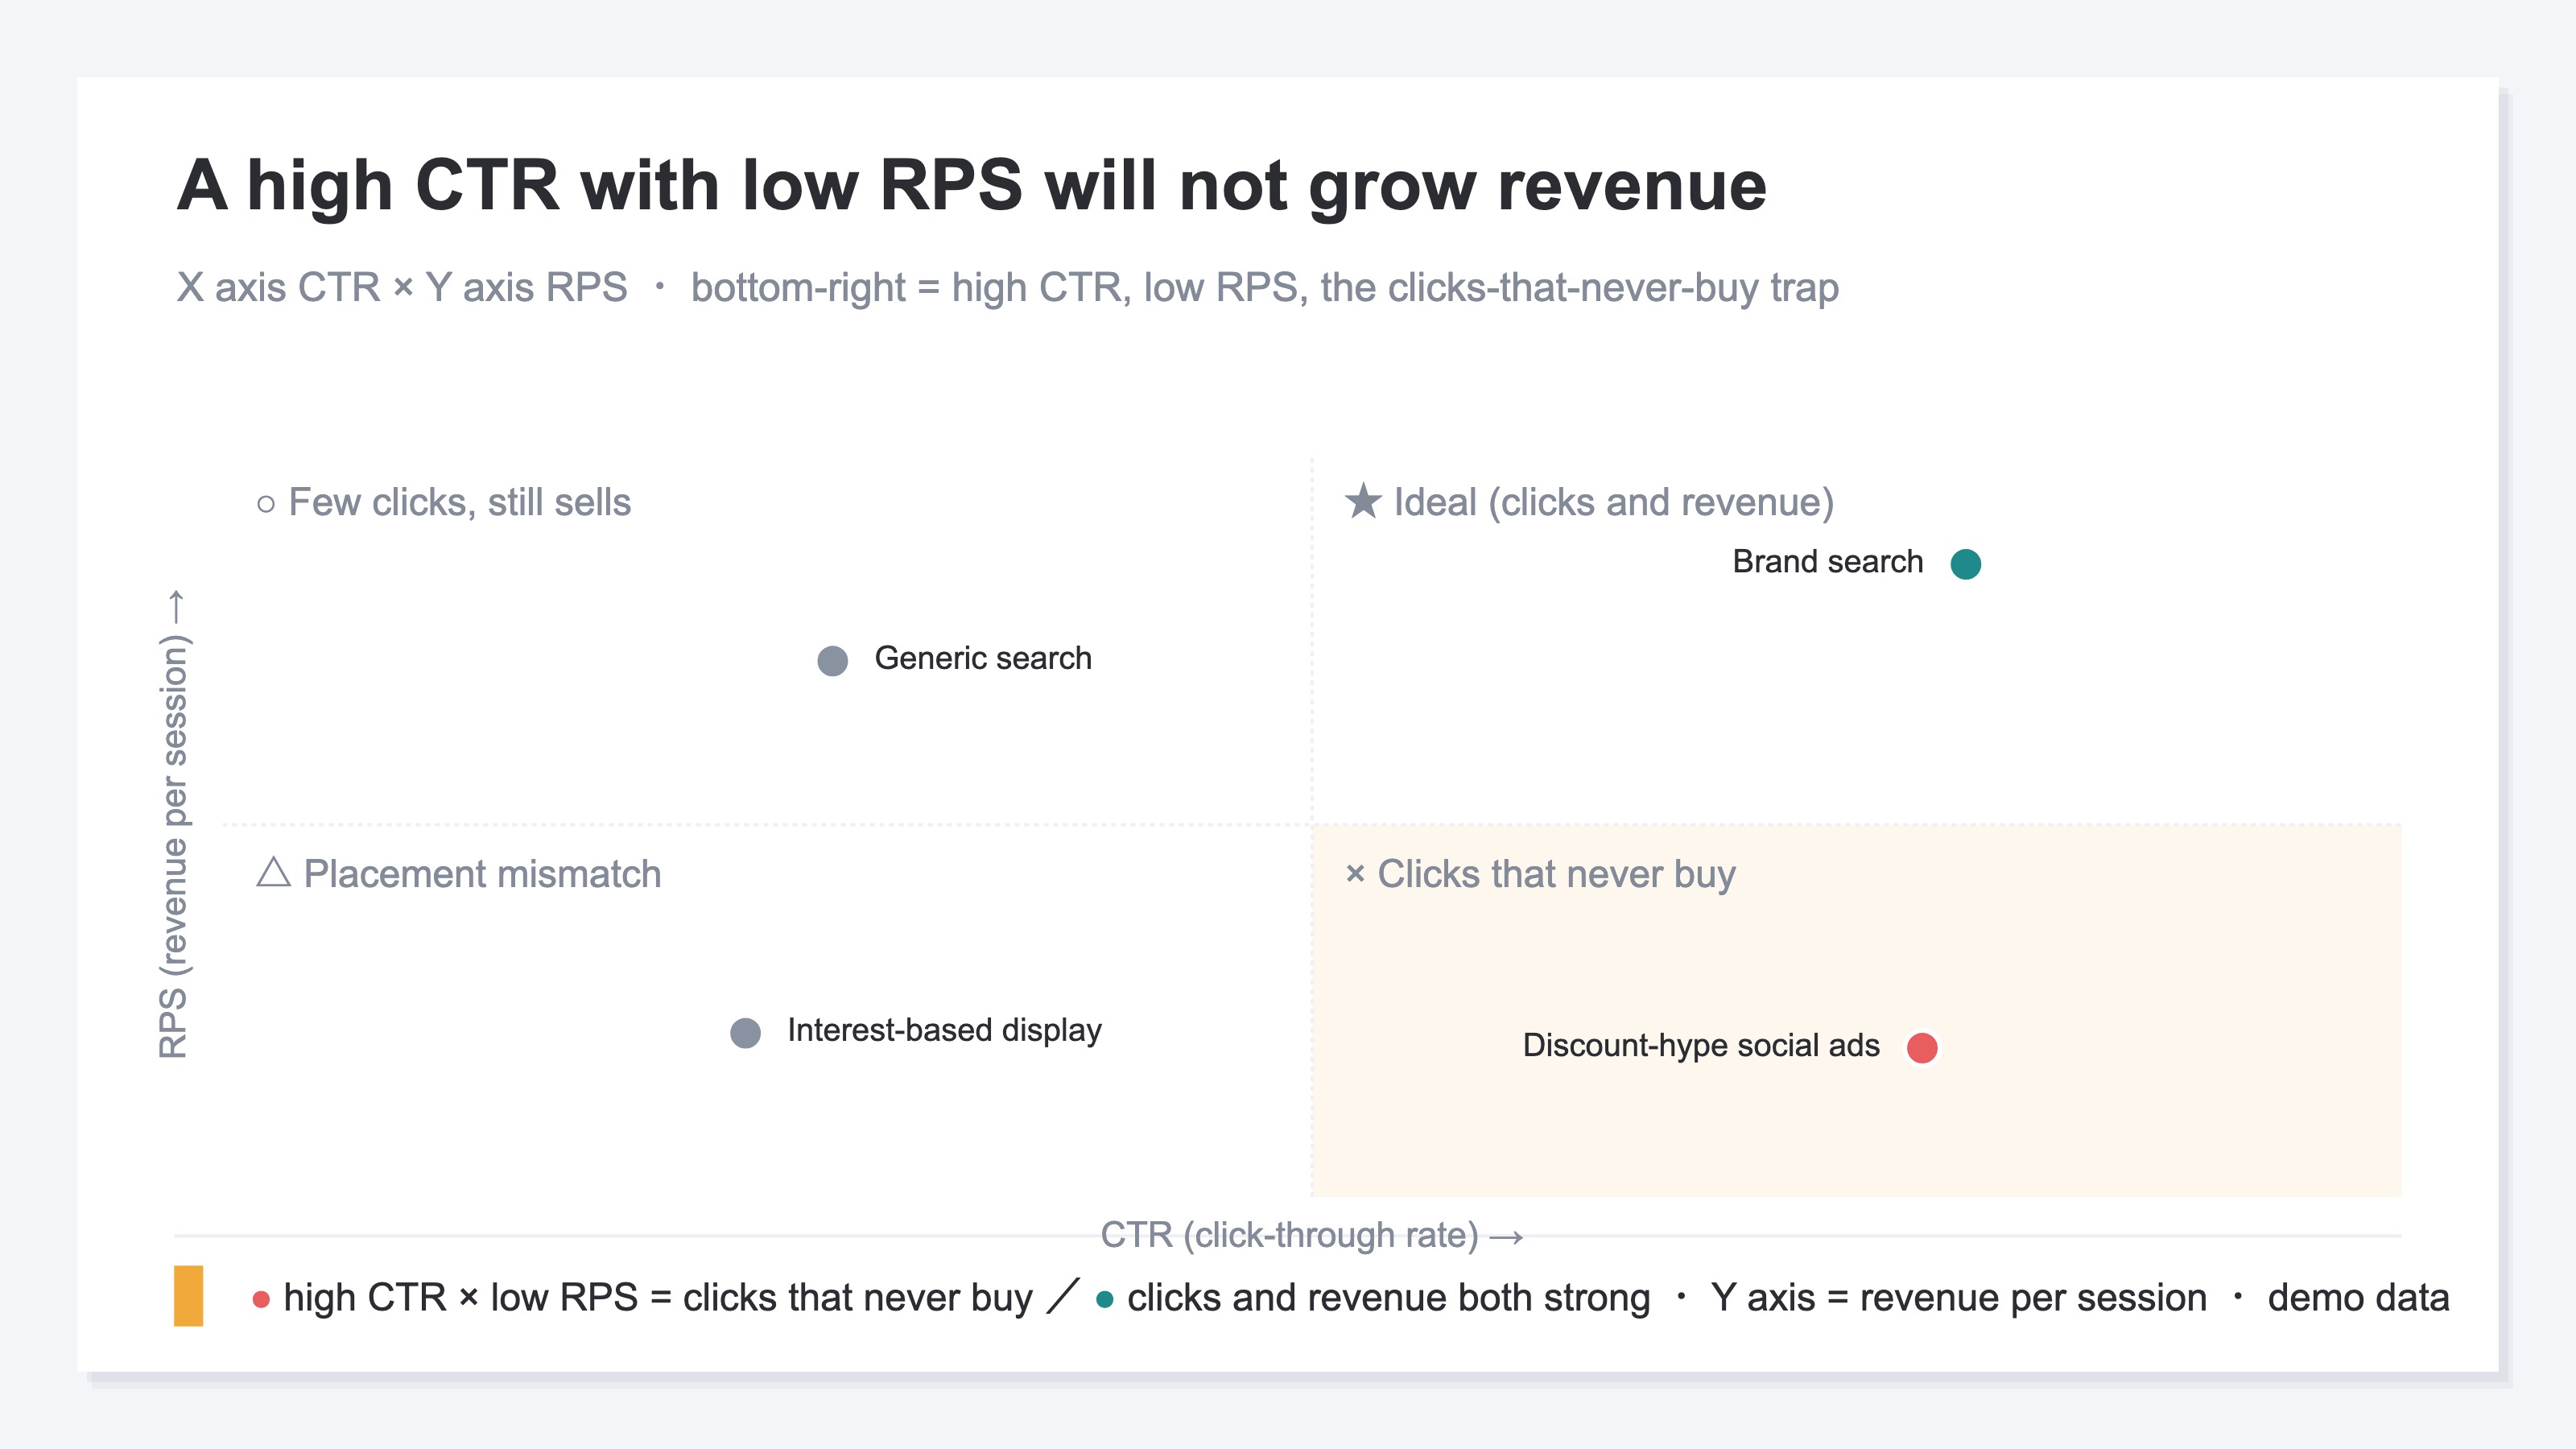
The bottom-right "high CTR × low RPS" is the trap of clicks that never buy: a channel with lots of clicks but no revenue, invisible if you only watch CTR. By contrast, top-right brand search is the ideal — high clicks and solid revenue.
The thinking itself is not hard. You just line up each channel's CTR with the RPS, AOV, and CVR that follow, and compare. What is heavy is assembling this every week, across channels, on bot-excluded valid clicks. Plain GA4 can give channel-level totals and CVR once you align UTMs, but it cannot fully remove bots and invalid clicks, so CTR inflation stays. And tying which click generated how much revenue, channel by channel, becomes a manual job every time. For when to use RPS vs. CVR, see RPS vs. CVR — How They Differ.
RevenueScope's solution
In short: GA4 and ad dashboards make it hard to spot "a channel with high CTR that does not sell." RevenueScope consolidates bot-excluded, per-channel revenue efficiency into one view.
Let us see how to spot "a high CTR that does not grow revenue" in actual numbers. RevenueScope consolidates per-channel revenue efficiency into one view, from GA4 and your site's revenue data. It shows four metrics — Revenue / AOV (average order value) / RPS (revenue per session) / CVR (conversion rate) — all after removing bots and invalid clicks.
| Channel | RPS (revenue per session) | AOV | CVR |
|---|---|---|---|
| Brand search | ¥130 | ¥5,200 | 2.8% |
| Generic search | ¥90 | ¥4,900 | 1.9% |
| Discount-hype social ads | ¥18 | ¥3,400 | 0.4% |
(Illustrative of how it looks per channel in RevenueScope. Figures are demo data.)
Reading this view (demo data for an apparel store), one thing is immediately clear. Discount-hype social ads post a high CTR thanks to flashy creative — yet their revenue per session (RPS) is ¥18 and CVR 0.4%, the lowest. Scale them on click volume and you buy a flood of clicks that never buy, deepening the loss. Brand and generic search, meanwhile, keep RPS and CVR high and leave solid revenue. For a deeper look at revenue per session, see What Is RPS? Revenue Per Session Explained.
The next move is clear. Pause the increase to high-CTR social ads, and send your next budget to efficient brand and generic search. Where CTR alone would tempt you to "scale the high-click social ads," per-channel RPS, AOV, and CVR set you straight.
Let us draw the boundary clearly. RevenueScope does not calculate ad CTR, CPC (cost per click), or ad spend itself — those are numbers in your ad dashboard, where you check them. What RevenueScope outputs is bot-excluded, per-channel revenue efficiency (Revenue / AOV / RPS / CVR / Sessions), available in five minutes with one tag. Check CTR in your ad dashboard, and use RevenueScope to compare how much revenue, and at what efficiency, each click generates.
6. FAQ#
Q. What is a normal CTR?
It varies by an order of magnitude across placements and industries. Search ads land at 5–7%, display ads at 0.5–1% [2]. What matters more than the benchmark is checking, for your own business, whether each click generates revenue.
Q. Why isn't revenue rising even though CTR is high?
Three main reasons: placement mismatch, CTR inflation from bots and invalid clicks, and broad reach to low-intent audiences. CTR alone cannot tell them apart, so compare revenue per session (RPS) and CVR channel by channel to find the channels that truly perform.
Q. Will raising CTR increase revenue?
Not necessarily. Even if you raise CTR, revenue will not grow if CVR is low. Hyping ad copy to lift CTR invites bounces when the LP does not match. Always view CTR and CVR together.
Q. Can RevenueScope produce CTR or CPC?
No. What RevenueScope outputs is the bot-excluded revenue efficiency of Revenue / AOV / RPS / CVR; it does not calculate ad CTR, CPC, or ad spend itself. Check CTR and cost per click in your ad dashboard, and use RevenueScope's per-channel revenue efficiency to compare whether those clicks actually sell.
Summary#
CTR is a basic metric for "what percentage of ad impressions resulted in a click." Four key points:
- CTR = Clicks ÷ Impressions. It measures how easily an ad is clicked, but the revenue that follows is invisible.
- A higher CTR is not always better. Placement mismatch, bot/invalid-click inflation, and broad low-intent reach all raise CTR with clicks that never buy.
- Benchmarks differ by an order of magnitude. A 3% on search ads and a 3% on display ads mean opposite things; averaging them misleads.
- To spot a high-CTR channel that does not sell, use bot-excluded per-channel RPS, AOV, and CVR, and send budget to the channels that truly perform.
Whether a CTR is good or bad is decided not by an industry benchmark's absolute value, but by your own post-click revenue efficiency (RPS, AOV, CVR). Keep yourself able to compare, channel by channel, how much revenue each click generates rather than chasing CTR — and you will run your ad budget without waste.
See which ads actually drive revenue, at a glance
Free up to 5,000 sessions/month, AI analyst included. No credit card required. Up and running in 5 minutes.