
"Is this CPA in our ad dashboard high or low?" — almost every EC operator has asked this question. Google Ads and Meta Ads always report CPA, but whether a given number is acceptable depends on context that the dashboard does not show.
Industry benchmarks vary widely. For EC overall, CPA typically lands between 1,000 and 5,000 JPY per conversion, but products with higher AOV can tolerate higher CPA. Bottom line: CPA cannot be judged in isolation. It must be compared against breakeven CPA — derived from AOV and gross margin — and then against real revenue, to decide whether a campaign is healthy.
This guide explains "What is CPA?" from the perspective of EC operators. We cover the definition, formula, differences from CPC and CAC, industry benchmarks, four levers to reduce CPA, and how to measure your own CPA, in five sections.
Table of contents
TL;DR#
-
CPA = Ad Spend ÷ Conversions
The cost of acquiring one conversion (purchase or signup) through advertising
-
Lower CPA isn't always better
The true threshold is breakeven CPA (= AOV × gross margin). Above this, every conversion loses money
-
The real call is made against actual revenue
Breakeven CPA is the "per-conversion line." Which channel actually keeps a profit only shows when you compare measured CPA against real revenue (RPS) by channel
1. What is CPA — the cost to acquire one conversion#
Bottom line: CPA measures the cost of acquiring one conversion through advertising. But all it shows is the "cost side."
CPA stands for Cost Per Acquisition, the cost of acquiring one conversion (purchase, signup) through advertising. Google Ads labels it "Cost per conversion," and Meta Ads calls it "Cost per result."
CPA measures the per-conversion efficiency of advertising. Comparing CPA across campaigns instantly shows which ones acquire conversions efficiently and which do not.
However, CPA is a cost-side metric. It says nothing about revenue, contribution margin, or profit generated by each acquired conversion. This is the first pitfall when interpreting CPA.
1.1 CPC and CAC — three cousins to keep straight#
CPA is often confused with two similar metrics: CPC (Cost Per Click) and CAC (Customer Acquisition Cost).
| Metric | Formula | Measures | Primary use |
|---|---|---|---|
| CPC | Ad spend ÷ Clicks | Cost per click | Creative efficiency |
| CPA | Ad spend ÷ Conversions | Cost per conversion | Campaign efficiency |
| CAC | Total marketing spend ÷ New customers | Cost per new customer | Business-level marketing efficiency |
CPC counts clicks, CPA counts conversions, and CAC counts new customers acquired against all marketing spend (not just paid ads). CPA is a channel-level metric, CAC is a business-level metric.
2. The CPA formula and a worked example#
Bottom line: the formula has only one form. Simple — but the value shifts depending on how you count the conversions in the denominator.
The formula has only one form.
CPA = Ad Spend ÷ Conversions
If you spent 500,000 JPY over a month and generated 200 purchase conversions, your CPA is 500,000 ÷ 200 = 2,500 JPY.
2.1 Campaign-level CPA comparison#
Comparing multiple campaigns side by side reveals where efficiency is leaking.
| Campaign | Ad spend | Conversions | CPA |
|---|---|---|---|
| Google Search | 200,000 JPY | 100 | 2,000 JPY |
| Meta Retargeting | 150,000 JPY | 80 | 1,875 JPY |
| Meta Prospecting | 150,000 JPY | 20 | 7,500 JPY |
| Total | 500,000 JPY | 200 | 2,500 JPY |
Meta Prospecting has a CPA roughly four times higher than the other campaigns. But pausing it on this signal alone may be premature — prospecting campaigns often look expensive on first-touch CPA yet pay back through LTV (customer lifetime value).
2.2 Target CPA — Google Ads' automated bidding#
Google Ads offers a bidding strategy called target CPA (tCPA). Advertisers set a target CPA, and Google's machine learning optimises bids to land near that target.
How to choose the target is the subject of the next section. Setting a target from dashboard numbers alone risks running ads that never turn a profit — you need breakeven CPA as the anchor.
3. Industry benchmarks — and why they mislead#
Bottom line: industry benchmarks are reference values only. You judge good-or-bad against your own breakeven CPA.
CPA varies significantly across industries. Search advertising benchmarks from international reports place median CPA roughly in the following ranges.
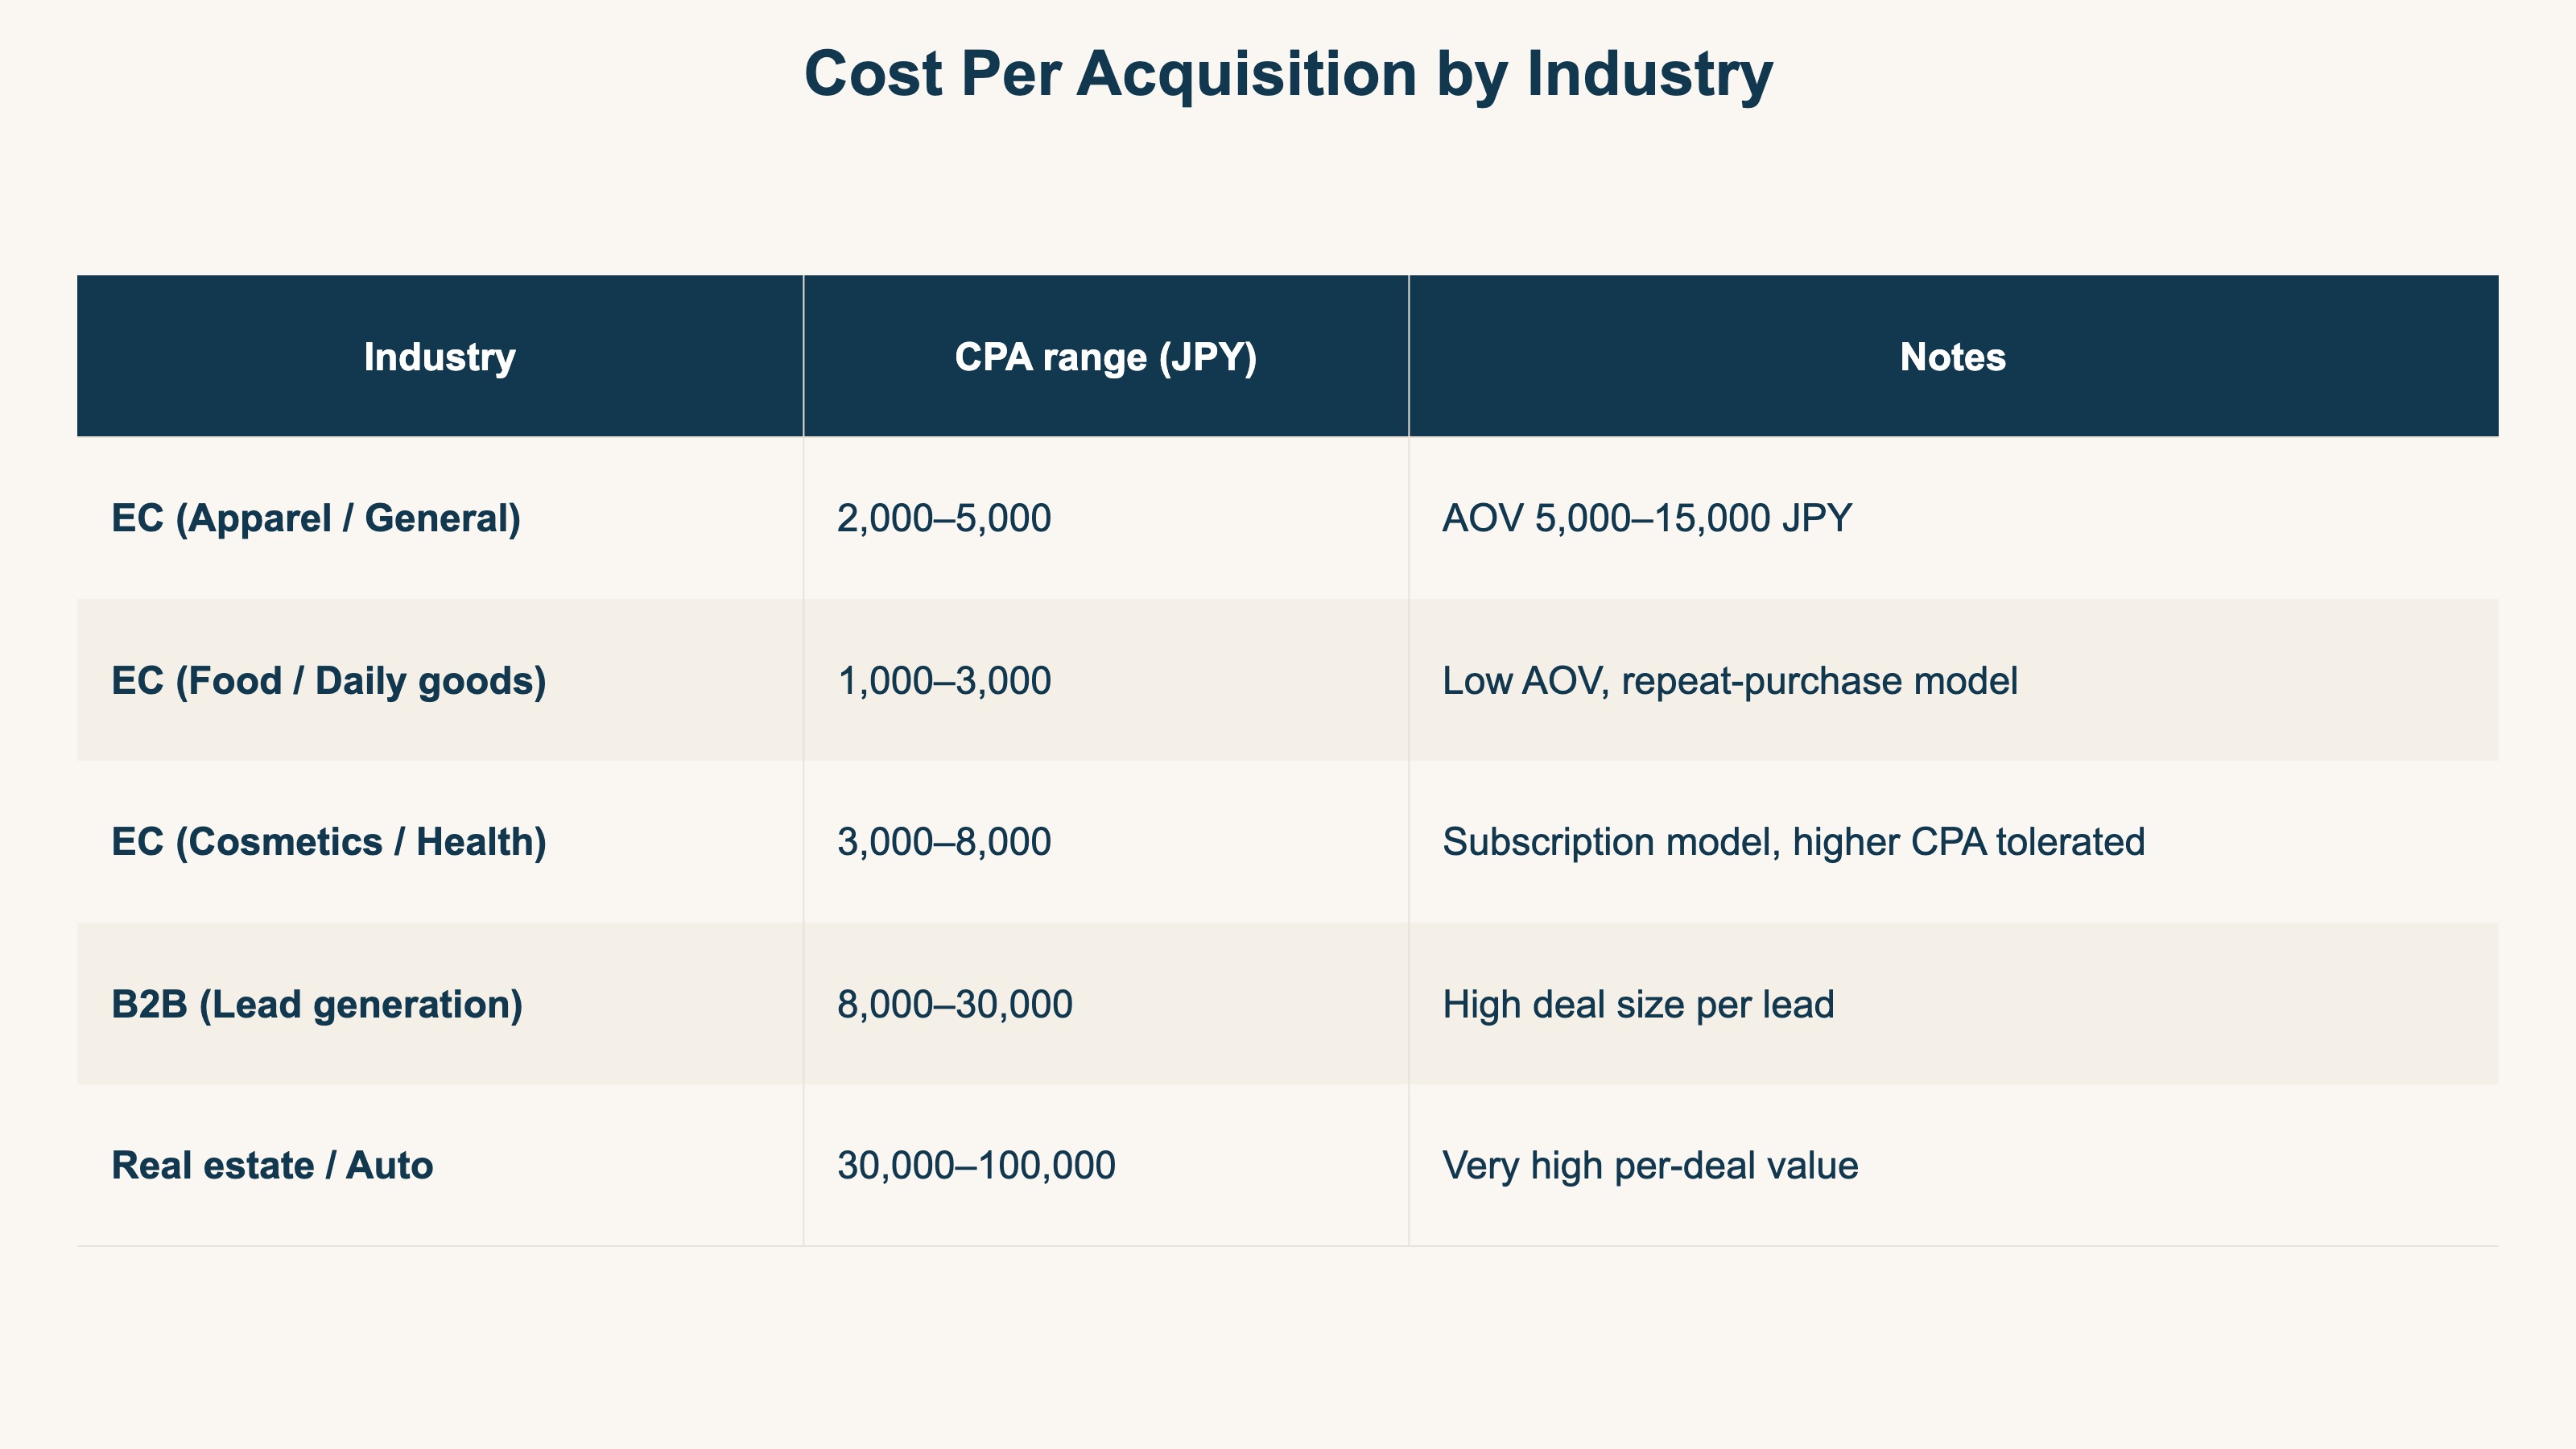
These ranges are reference values from international benchmark studies. Judging CPA solely against industry benchmarks is dangerous — you must always compare to your own breakeven CPA.
3.1 Breakeven CPA — the right number for your business#
Breakeven CPA is the line above which every conversion loses money. The formula is straightforward.
Breakeven CPA = AOV × Gross Margin
A product with AOV 5,000 JPY and gross margin 40% has a breakeven CPA of 5,000 × 0.4 = 2,000 JPY. Any CPA above this means each conversion piles up losses.
Different AOV and margin combinations produce different breakeven CPAs.
| AOV | Margin 30% | Margin 40% | Margin 50% |
|---|---|---|---|
| 3,000 JPY | 900 | 1,200 | 1,500 |
| 5,000 JPY | 1,500 | 2,000 | 2,500 |
| 10,000 JPY | 3,000 | 4,000 | 5,000 |
| 20,000 JPY | 6,000 | 8,000 | 10,000 |
The question "Is CPA 5,000 JPY high or low?" cannot be answered without knowing AOV and gross margin. Computing your breakeven CPA once gives you a starting point for judgment. But this is still only the "per-conversion line." Which channel actually clears that line and keeps a profit, as we'll see, needs to be checked against real revenue.
4. Four levers to reduce CPA#
Bottom line: there are four levers to reduce CPA. "LP CVR uplift" tends to deliver the largest swing.
CPA-reduction tactics fall into four buckets.
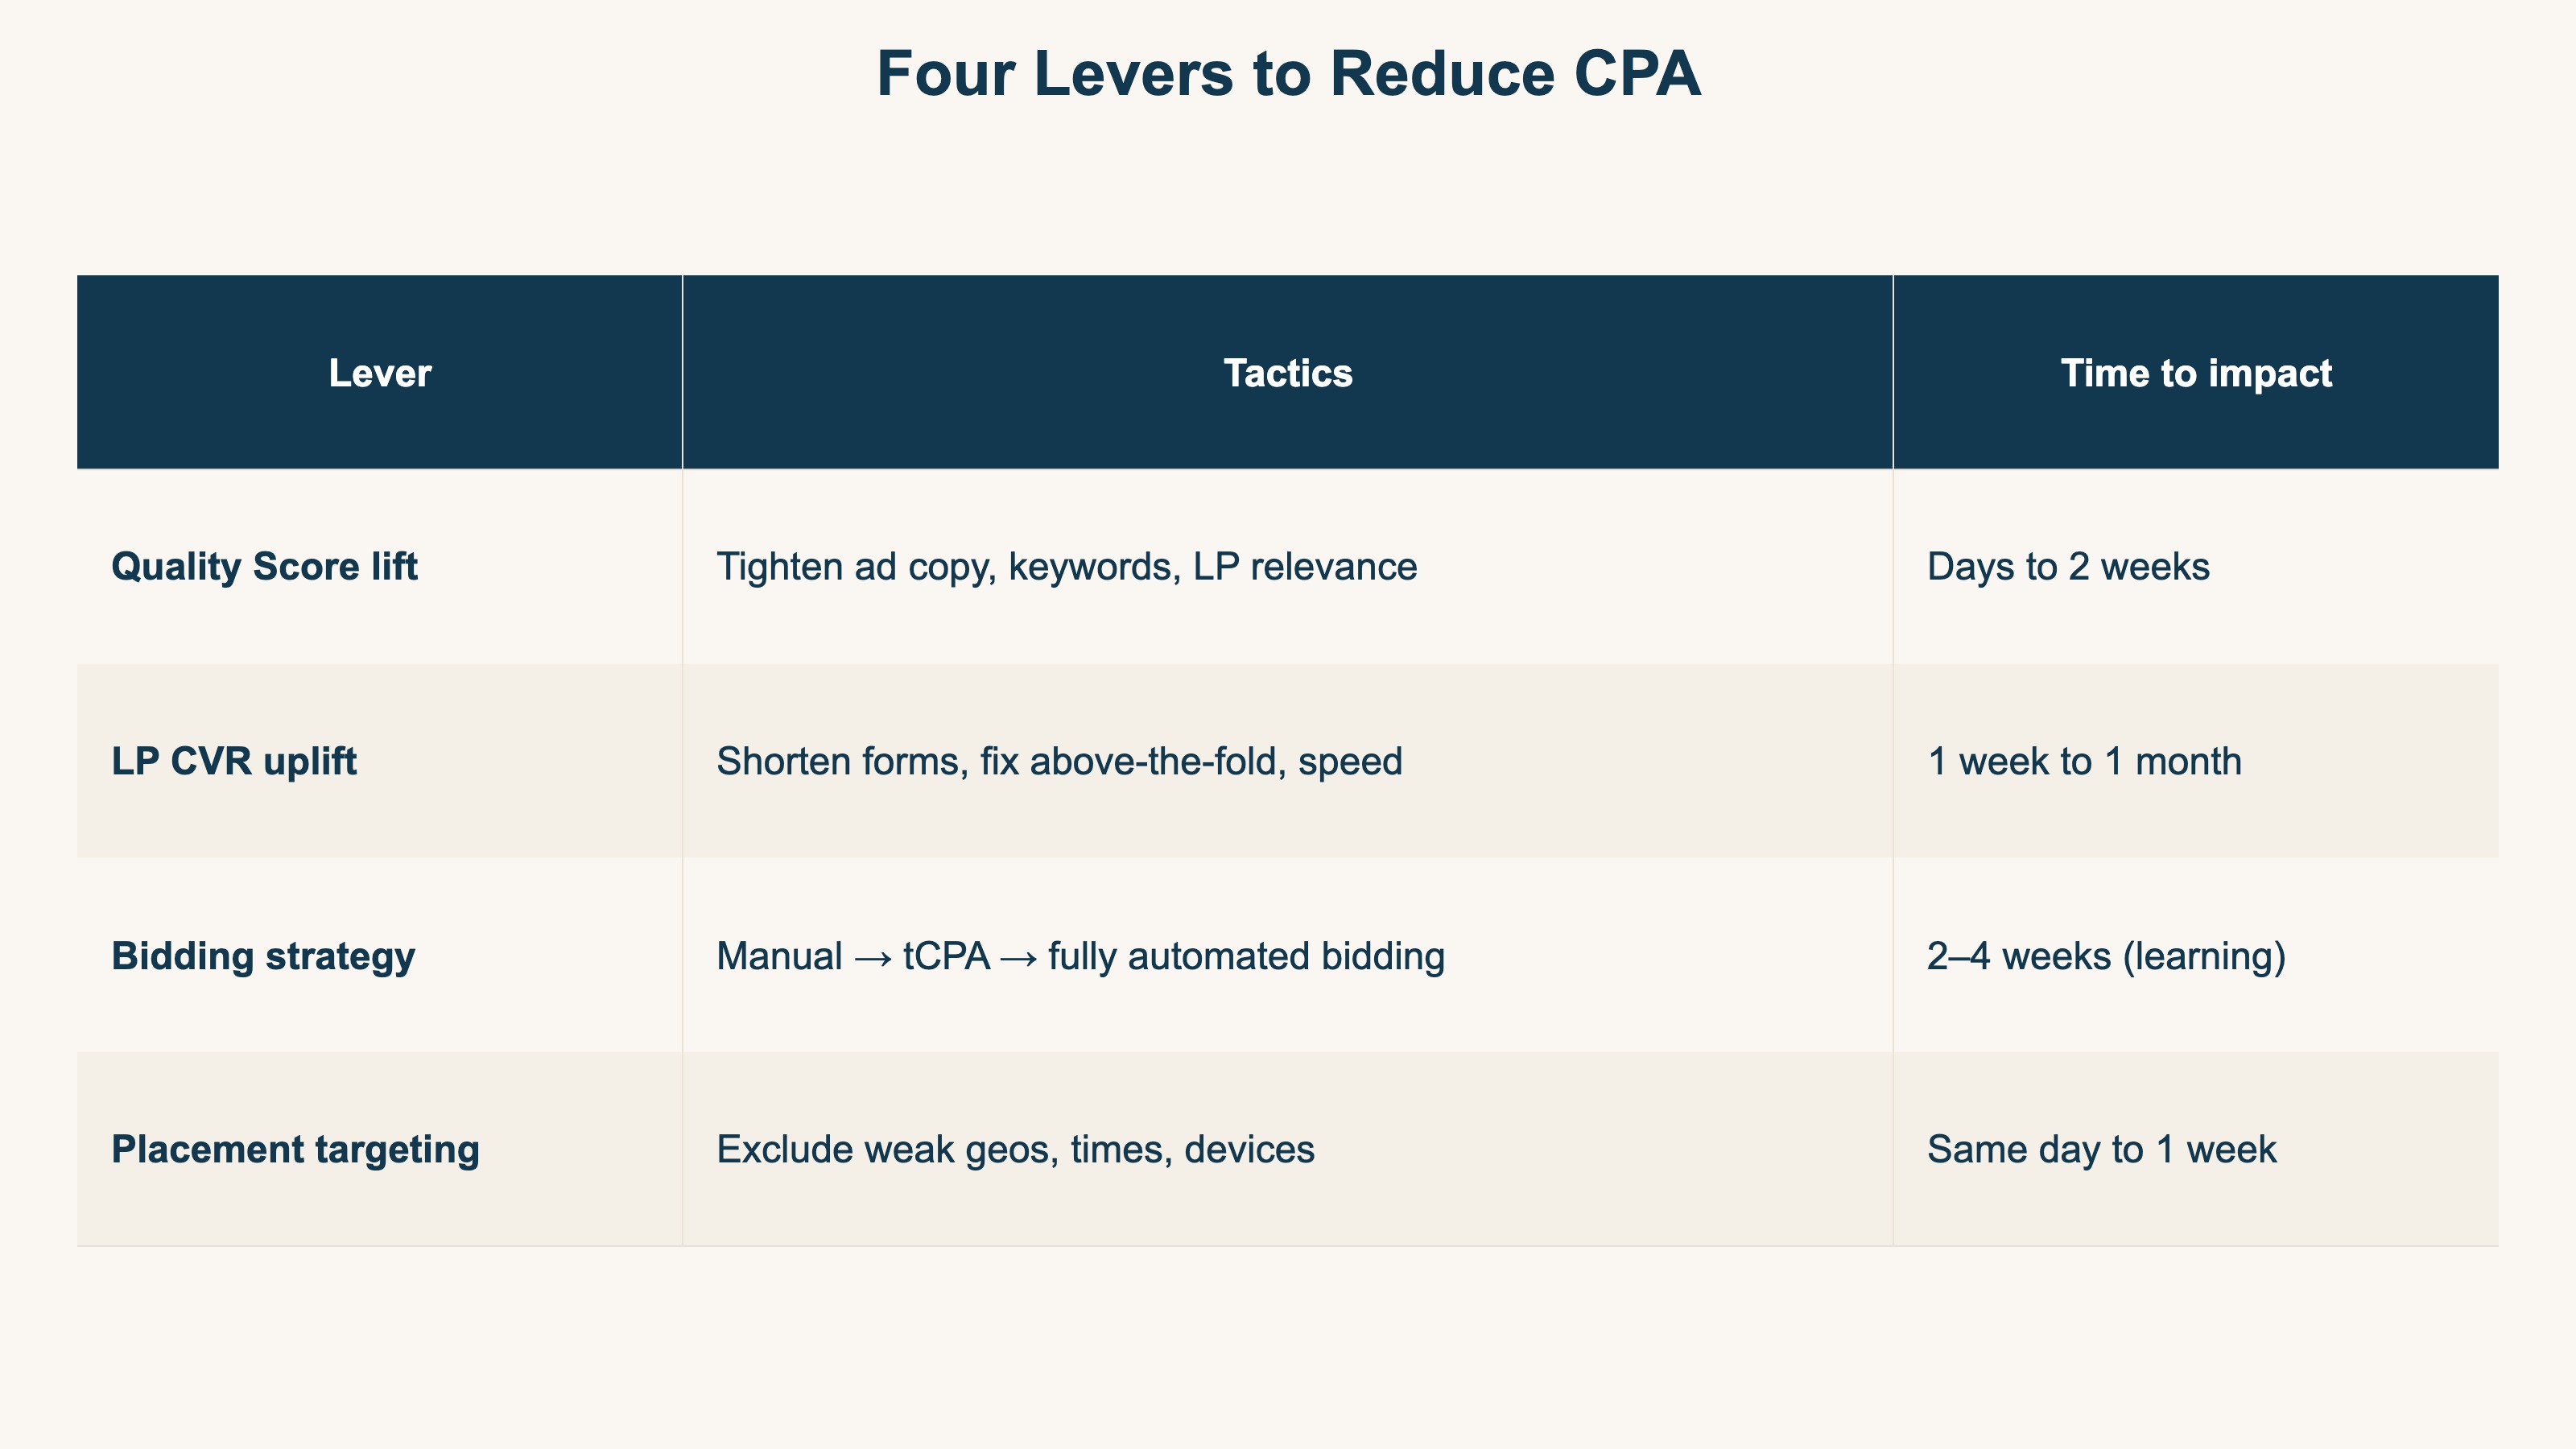
In practice, "LP CVR uplift" tends to deliver the largest swing. Because CPA is Ad Spend ÷ Conversions, doubling conversions halves CPA. For most EC sites, moving LP CVR from 1% to 2% beats anything you can do on the bidding side.
However, these levers only compound if you can trace which change actually moved CPA. The next section covers a 3-step path to measure it.
5. A 3-step path to measure your own CPA#
Bottom line: to turn CPA into a decision input, run three steps on your own data. The idea is simple — but maintaining it weekly across every channel is the heavy part.
To turn CPA from "a number on the dashboard" into "an input to business decisions," you need to run three steps on your own data.
Step 1: Identify ad traffic with UTM parameters#
The CPA in your ad dashboard counts only conversions the ad platform itself can attribute. When the same user clicks both a Google Ad and a Meta Ad, both platforms can claim the conversion.
Tagging every ad URL with consistent UTM parameters (utm_source, utm_medium, utm_campaign) lets your analytics tool de-duplicate ad traffic in one place. See The Right Way to Use UTM Parameters for details.
Step 2: Aggregate revenue and margin by channel#
Using UTM-identified channels, sum revenue, conversions, ad spend, and gross profit. Recompute CPA as measured conversions ÷ ad spend on your side, not the dashboard CPA.
Pairing the breakeven ROAS from ROAS Guide 2026 with the breakeven CPA above gives you a complete channel-level profit/loss view.
Step 3: Decide stop/continue against breakeven CPA#
Lay measured CPA against breakeven CPA for each channel.
| Channel | Measured CPA | Breakeven CPA | Decision |
|---|---|---|---|
| Google Search | 1,500 JPY | 2,000 JPY | ◯ Continue, add budget |
| Meta Retargeting | 1,800 JPY | 2,000 JPY | ◯ Continue |
| Meta Prospecting | 4,500 JPY | 2,000 JPY | × Improve or pause |
The idea itself isn't hard: tag with UTM, aggregate by channel, and compare measured CPA against breakeven CPA. What's hard is repeating it every week. Smoothing the gap between dashboard CPA and on-site measured CPA (double-counting), reconciling naming, excluding bots, and then keeping every channel aligned on the same terms — maintaining this prep by hand every week is quietly heavy. On top of that, a single-screen view of measured CPA × real revenue (RPS) by channel is structurally absent from GA4's standard reports.
RevenueScope — the solution
Bottom line: CPA can only be judged once you put ad spend (the denominator) and on-site measured revenue and RPS on one screen. RevenueScope takes that weekly reconciliation off your hands.
When you try to truly judge CPA, you keep hitting the same wall. The ad dashboard shows only "conversions within that platform" and the cost side. Breakeven CPA can be computed by formula, but which channel actually clears the line and keeps a profit needs ad spend (the denominator) and on-site measured revenue, RPS, and bot-excluded conversions on one screen. That's what's structurally absent from GA4.
RevenueScope brings in ad spend and shows measured ROAS, revenue, revenue per session (RPS), and conversion rate by channel on one screen (demo data shown). It also lays the gap between dashboard CPA and on-site measured CPA (double-counting) side by side, so you can decide — by the numbers — which ad channel clears breakeven and keeps a profit, and where to send the next budget.
Let me be clear about one thing. What RevenueScope computes is the ROAS of ad channels with ad spend brought in, and revenue efficiency (RPS) by channel. It does not calculate gross margin (profit after cost of goods) or LTV. The gross-margin figure used for breakeven CPA is something you input from your own business. What RevenueScope takes off your hands is the weekly manual work of turning CPA from a "cost-side number" into a "judgment matched against real revenue."
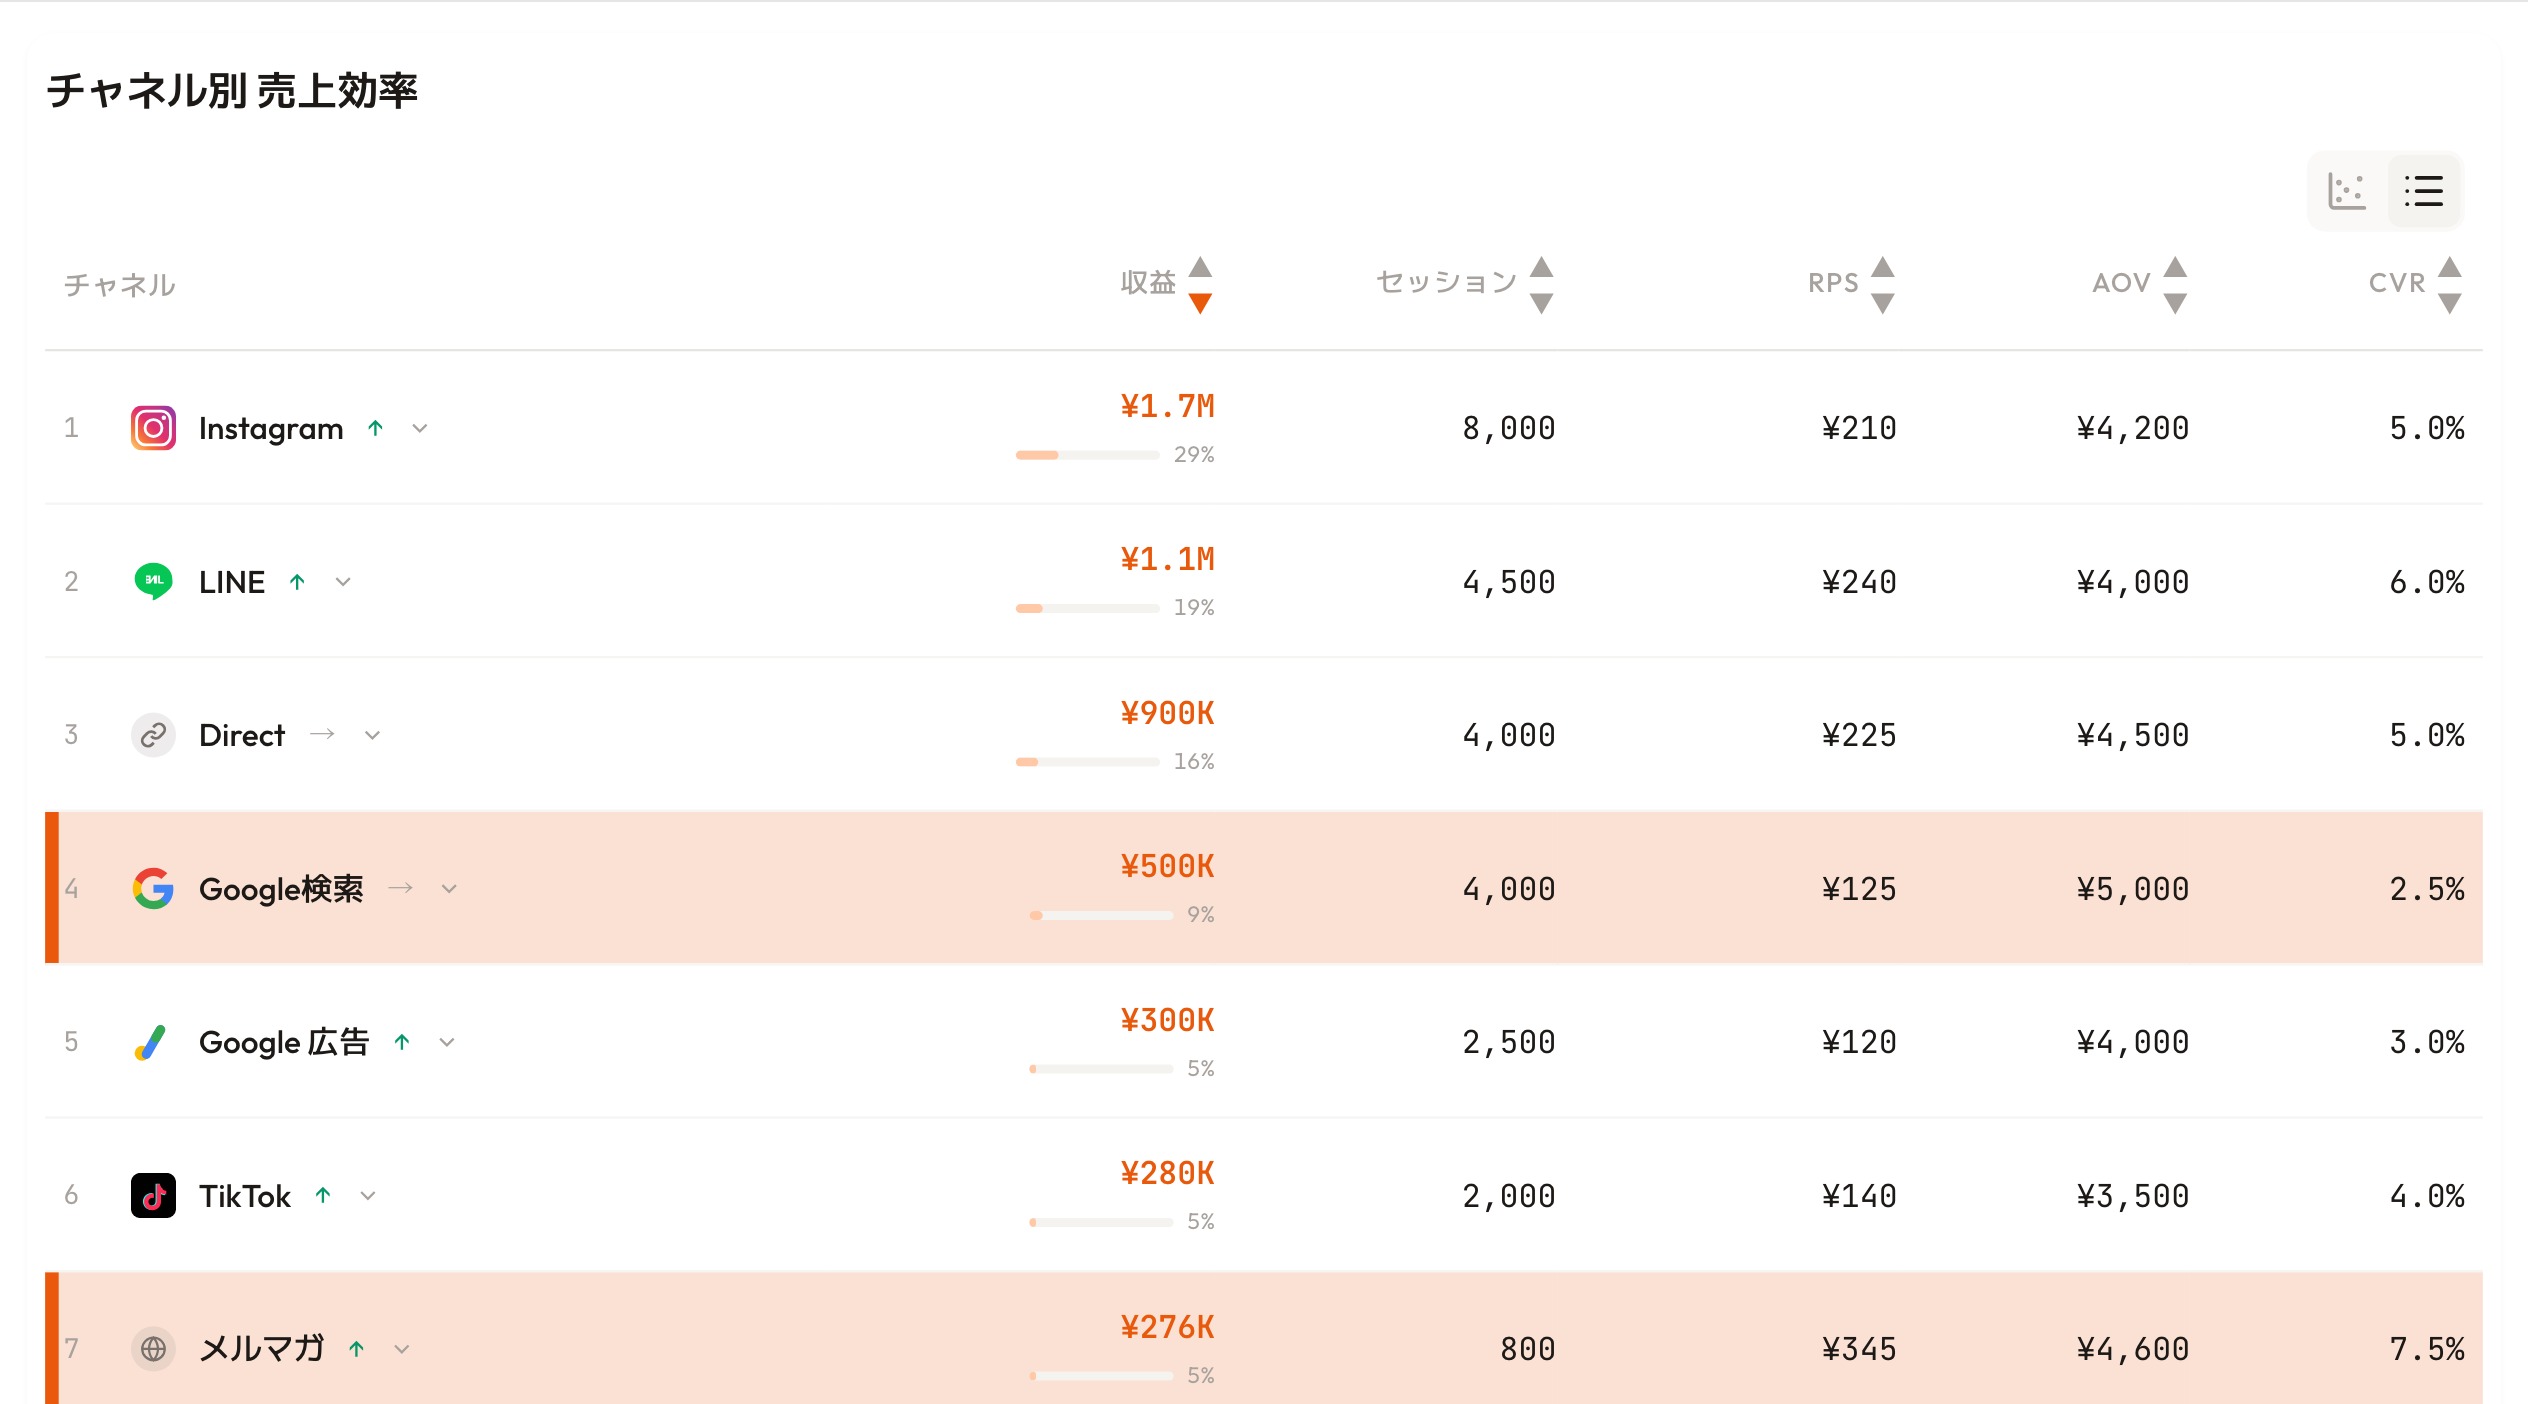
RevenueScope's dashboard (demo data shown). Judge budget allocation by revenue efficiency (RPS) per channel, not by the CPA number alone.
See which ads actually drive revenue, at a glance
Free up to 5,000 sessions/month, AI analyst included. No credit card required. Up and running in 5 minutes.
References#
- METI "FY2024 Survey on Electronic Commerce" Report PDF August 2025 [1]
- Dentsu "Advertising Expenditures in Japan 2024" Press release February 2025 [2]
- Google Ads Help "About Target CPA bidding" Official help [3]
- Meta Business Help Center "About ad costs" Official help [4]
- LocaliQ "Search Advertising Benchmarks" Benchmark report [5]