
"We launched every AOV uplift lever we could find. AOV is up — but monthly revenue is flat, or slightly down year over year." This is one of the most common patterns operators hit. Revenue splits into "sessions × CVR (purchase rate) × AOV (average order value)." If AOV rises while CVR drops and thin-margin orders pile up, the product of that multiplication doesn't grow.
This article maps the 10 most common AOV-uplift levers to their risks, lists the signals that catch trouble early, and lays out defense moves by risk. Then it connects to one more view: telling whether the AOV lift is real or only apparent, using per-channel and new-vs-returning revenue efficiency. For raising AOV itself, see Average Order Value (AOV) — Calculation and Levers; for joint optimization with CVR, see Raising CVR and AOV Together — A 4-Area Frame.
Table of Contents
Key Takeaways#
-
Each of the 10 AOV levers has side effects on CVR, stock, repeat, or measurement
The levers that work the hardest tend to have the loudest side effects
-
"Overall AOV went up" is not the same as success
Lean on one channel or new buyers and you get thin margin or broken repeat, and revenue stays flat
-
Watch the warning signals early — by channel and by new vs returning
Monthly retrospectives are too late. The thinking is simple, but redoing it every week is heavy
-
Inventory turnover and LTV are accounting / CRM / inventory (ERP) territory
What RevenueScope adds is per-channel, new-vs-returning AOV and revenue efficiency
-
Whether an AOV lift is real is decided by spotting the apparent AOV
Per-channel, new-vs-returning revenue per session (RPS) exposes thin-margin, unsustainable lifts
1. Why Revenue Falls When You Raise Average Order Value#
Bottom line: Revenue is "sessions × CVR × AOV." Raise AOV alone and, if the others fall, revenue doesn't grow.
Revenue splits like this:
Sessions × CVR (purchase rate) × AOV (average order value) = Revenue
Raise AOV by 20% while CVR drops 20% at the same time, and revenue falls 4% even with flat traffic. The point: "you can't measure a lever's effect in isolation." AOV and revenue per session are different metrics — the difference is covered in RPS vs AOV.
Almost every AOV-uplift lever pushes the customer to add a bit more, or to choose something more expensive. When that pressure crosses the tolerance line, customers either abandon the purchase or return it later. Baymard reports that surprise costs at checkout — shipping, tax, fees — account for 48% of cart abandonment[1]. Raising the free-shipping threshold and cart-stage upselling can flip into primary CVR-drop sources when designed carelessly.
A rising AOV also pressures inventory and repeat. Bundles miss sales when a partner SKU runs dry; subscriptions trade first-order AOV for short-term churn that breaks repeat. Japan's BtoC ecommerce market reached roughly 24.8 trillion yen in 2023 (Reiwa 5)[2], and the structure that compresses margin through AOV-uplift competition surfaces alongside that growth.
2. 10 AOV Levers and Their Risks#
Bottom line: The levers that work hardest carry the biggest side effects. Per lever, hold the primary risk (first signal) and secondary risk (downstream effect).
We grouped the most common AOV-uplift plays into 10 levers and mapped each to its primary risk (first signal) and secondary risk (downstream effect). Numbers map to the positions on the next 4-quadrant chart.
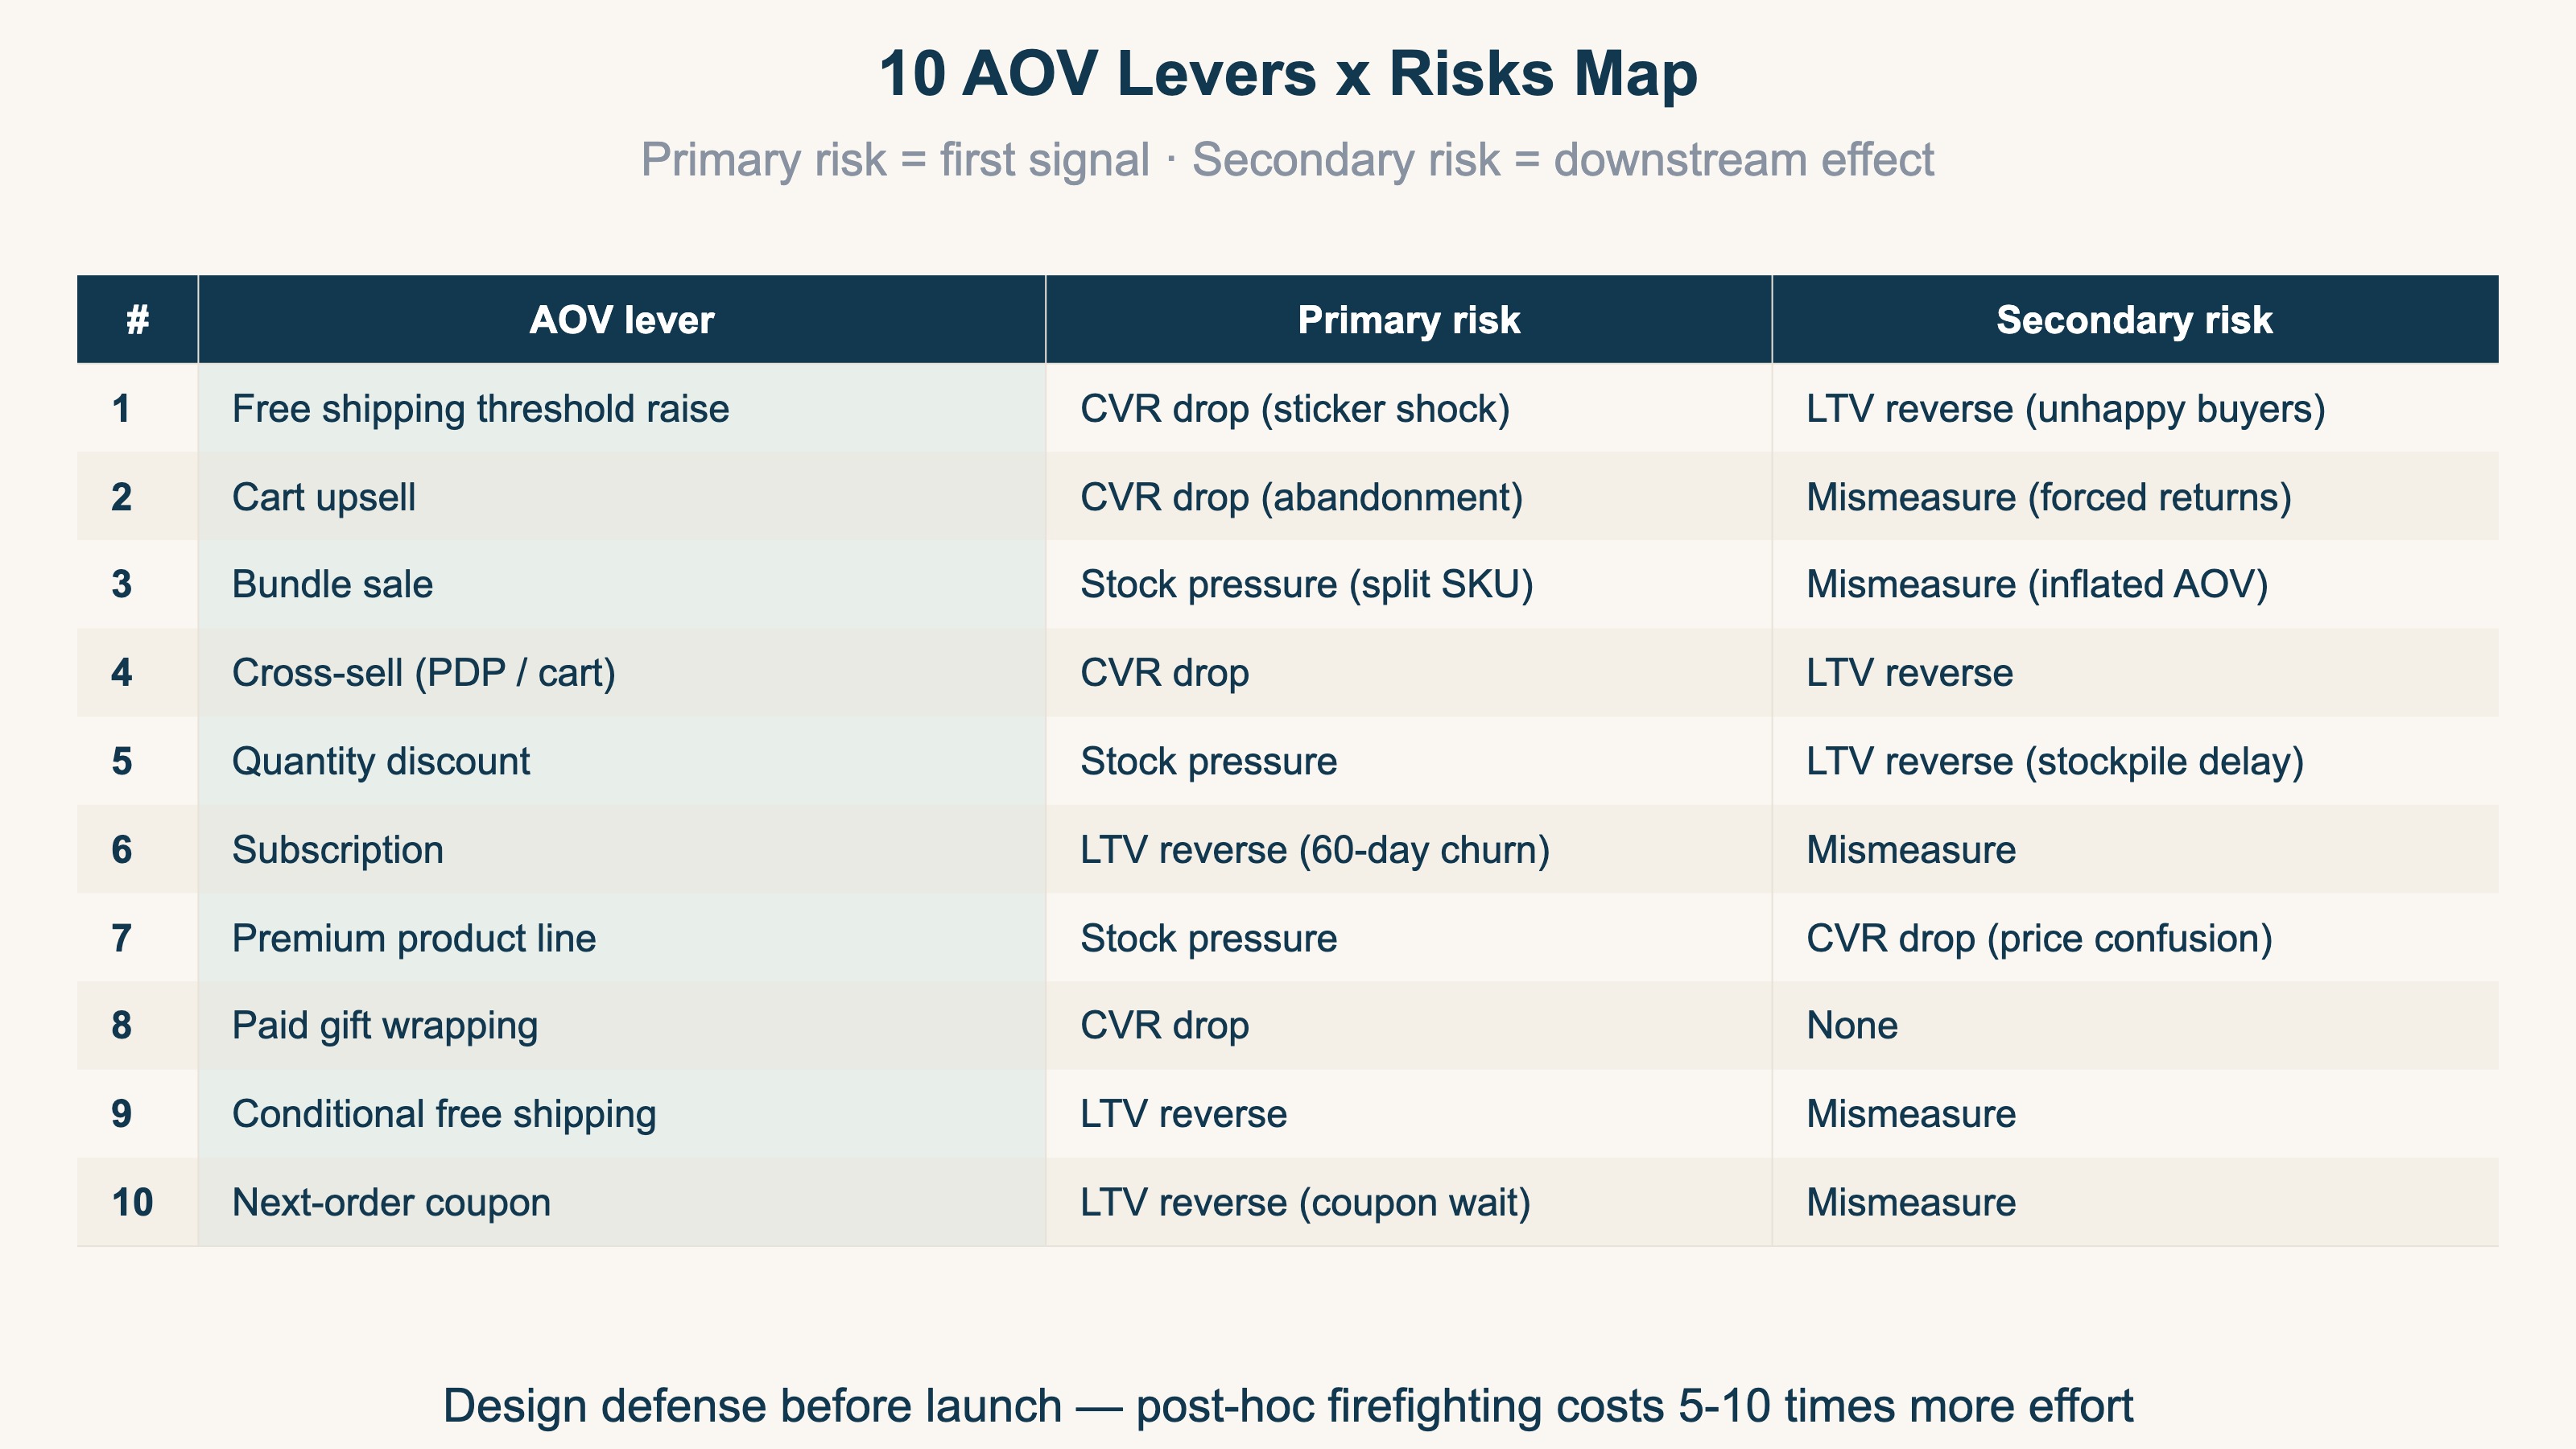
- Free-shipping threshold raise: primary = CVR drop (sticker shock) / secondary = repeat broken (unhappy buyers)
- Cart upsell: primary = CVR drop (abandonment) / secondary = mismeasurement (forced returns)
- Bundle sale: primary = stock pressure / secondary = mismeasurement (inflated unit AOV)
- Cross-sell (PDP / cart): primary = CVR drop / secondary = repeat broken
- Quantity discount: primary = stock pressure / secondary = repeat broken (stockpile, then delay)
- Subscription: primary = repeat broken (60-day churn) / secondary = mismeasurement
- Premium product line: primary = stock pressure / secondary = CVR drop (price confusion)
- Paid gift wrapping: primary = CVR drop / secondary = none
- Conditional free shipping: primary = repeat broken / secondary = mismeasurement
- Next-order coupon: primary = repeat broken (coupon-wait) / secondary = mismeasurement
These risks group into four areas by where they hit.
- CVR (purchase rate) drop: surprise costs, complex product choices, pushy upsells
- Stock pressure: one half of a bundle runs dry, promo-linked reorder misses
- Broken repeat: first-order AOV up at the cost of the buy-again rate
- Mismeasurement: judging AOV on pre-return, pre-cancel totals and mistaking it for success
The 4-quadrant map below places the 10 levers on "AOV uplift (x-axis) × CVR risk (y-axis)." Bottom-right (high effect, low risk) is the priority zone; top-right (high effect, high risk) is the double-edged zone where defense is mandatory.
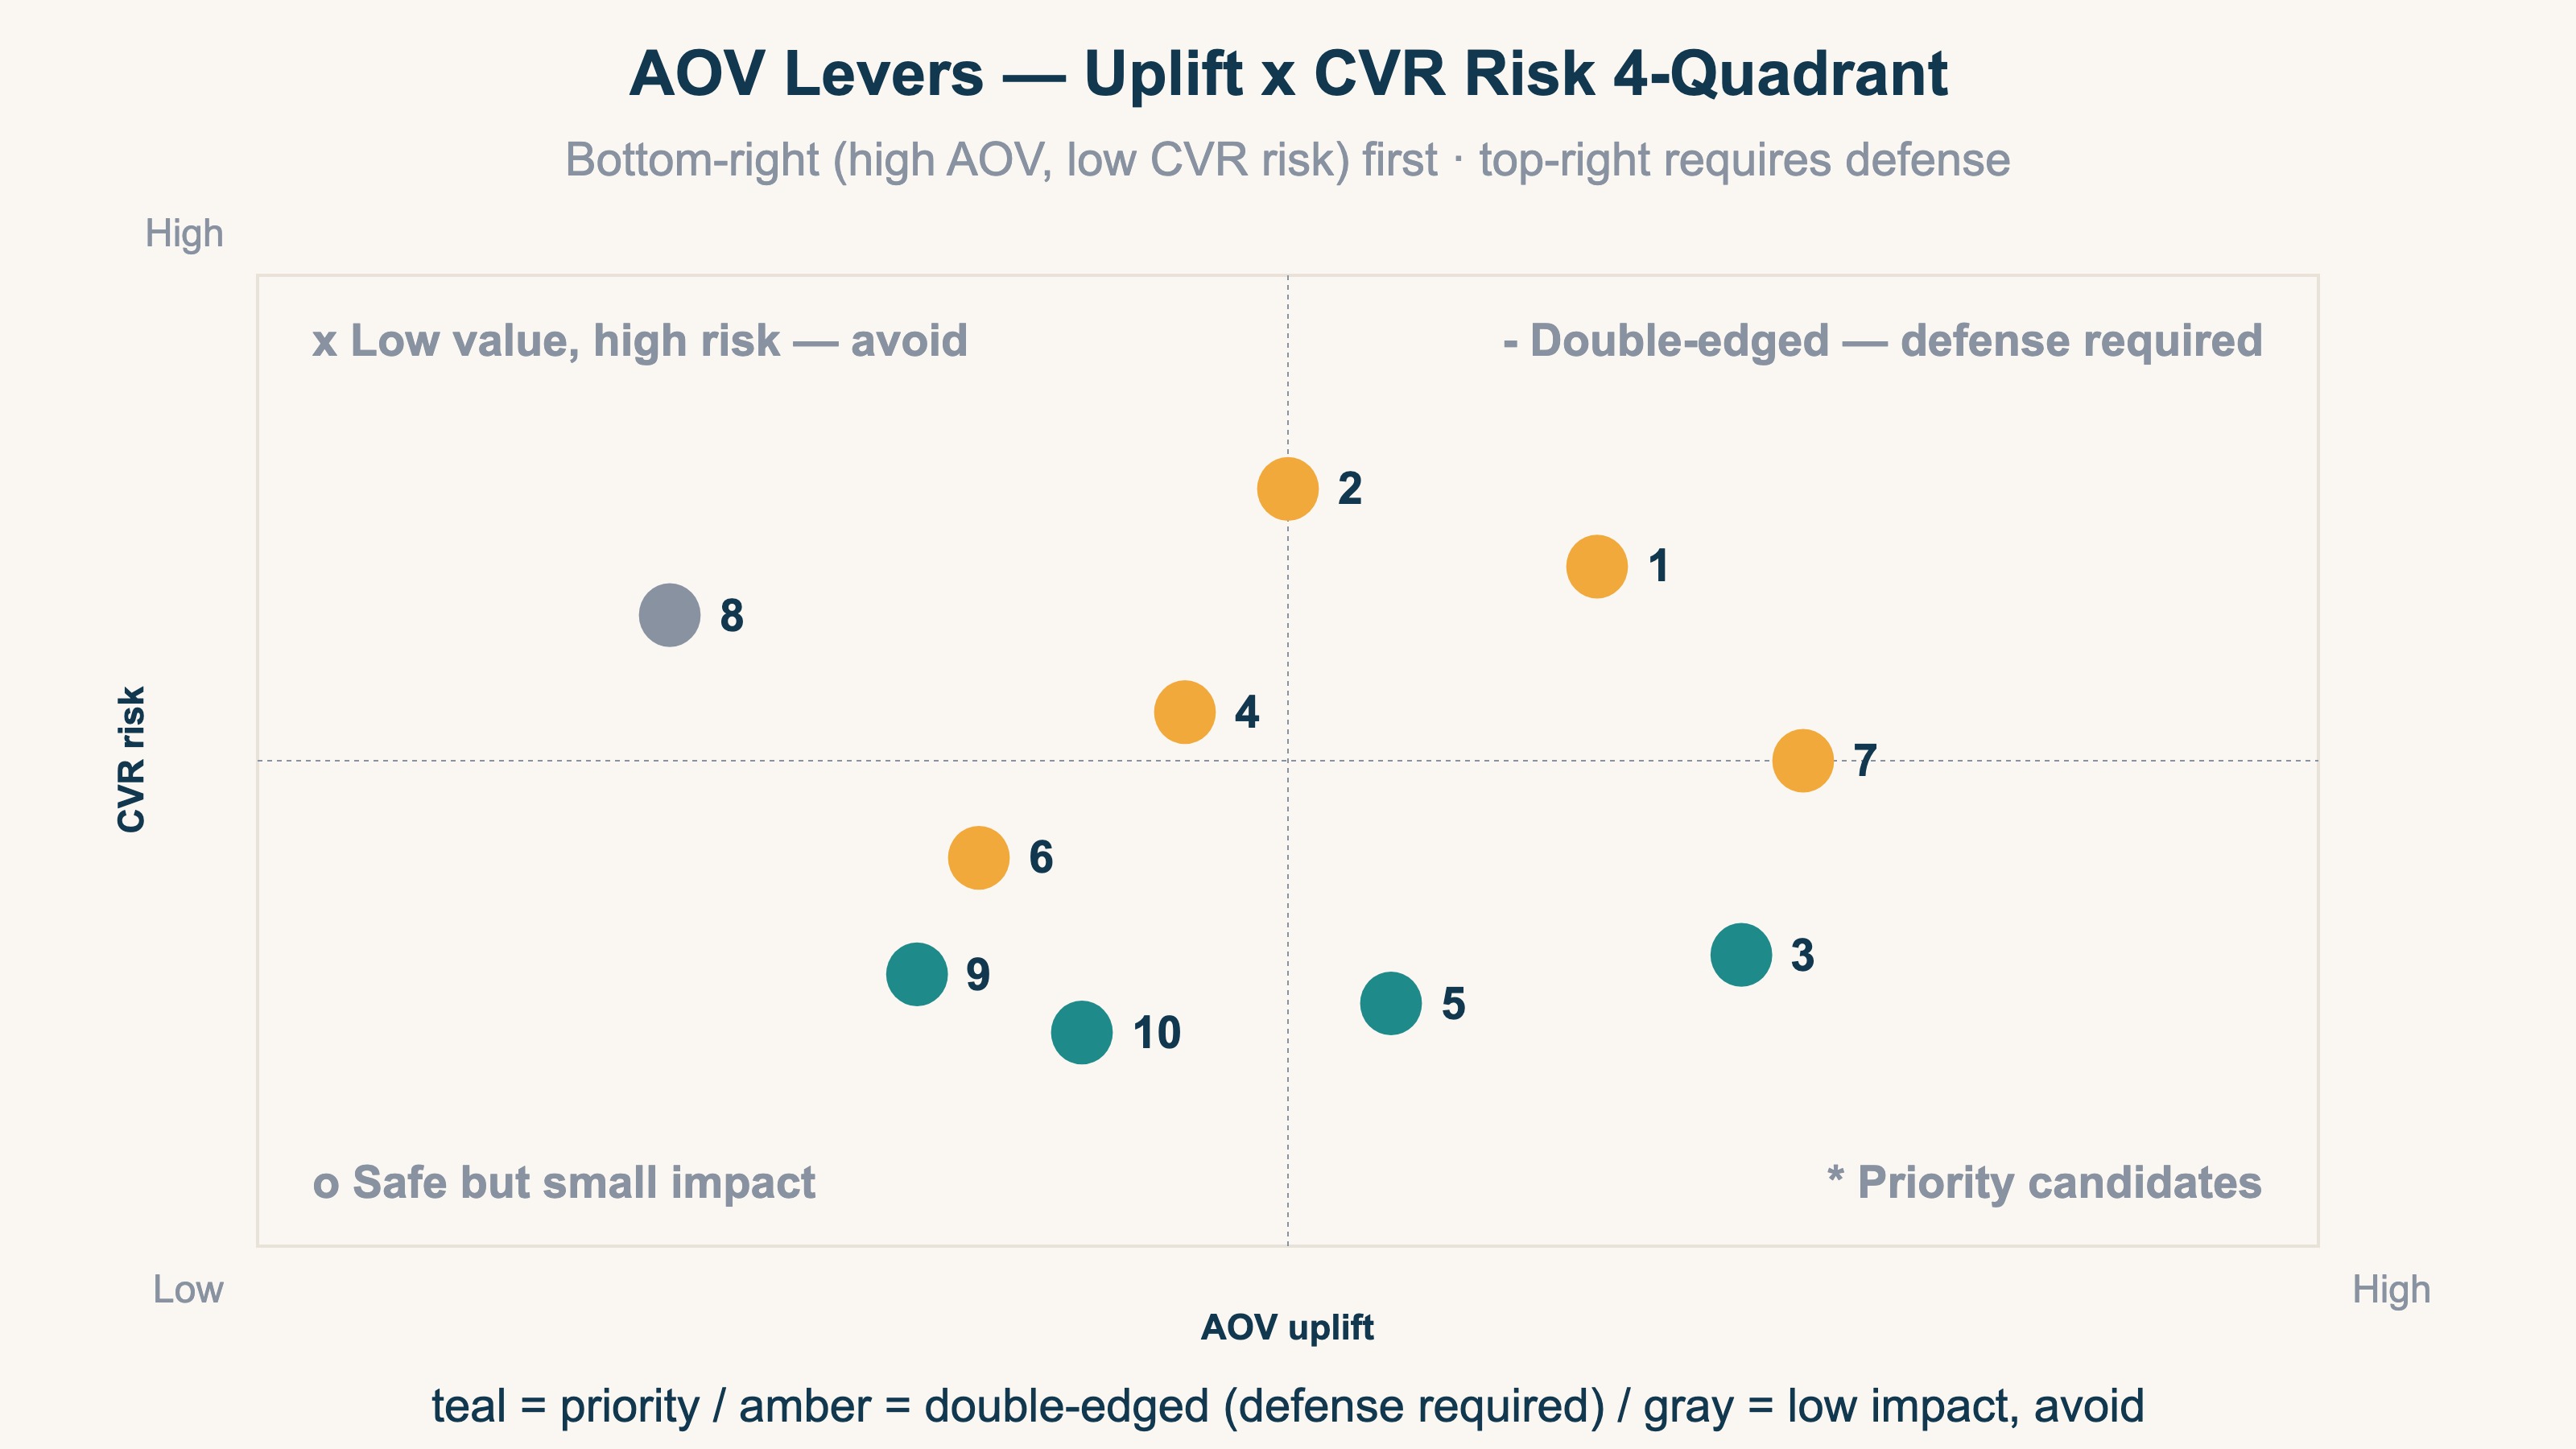
These four aren't independent. The forced feel of an upsell (a CVR-drop risk) can lower next-order intent and bleed into broken repeat. The can-coexist vs must-sacrifice quadrants are organized in Raising CVR and AOV Together — A 4-Area Frame. This article digs into the must-sacrifice side: the signals and how to contain them.
3. Five Signals to Catch the Reversal Early#
Bottom line: Signals are too late in the monthly close. Watch them weekly, by channel and by new vs returning. The thinking is simple, but keeping it up is heavy.
Catching the warning signs in a monthly retrospective is too late. Here are five signals to watch and the thresholds that should warn you.
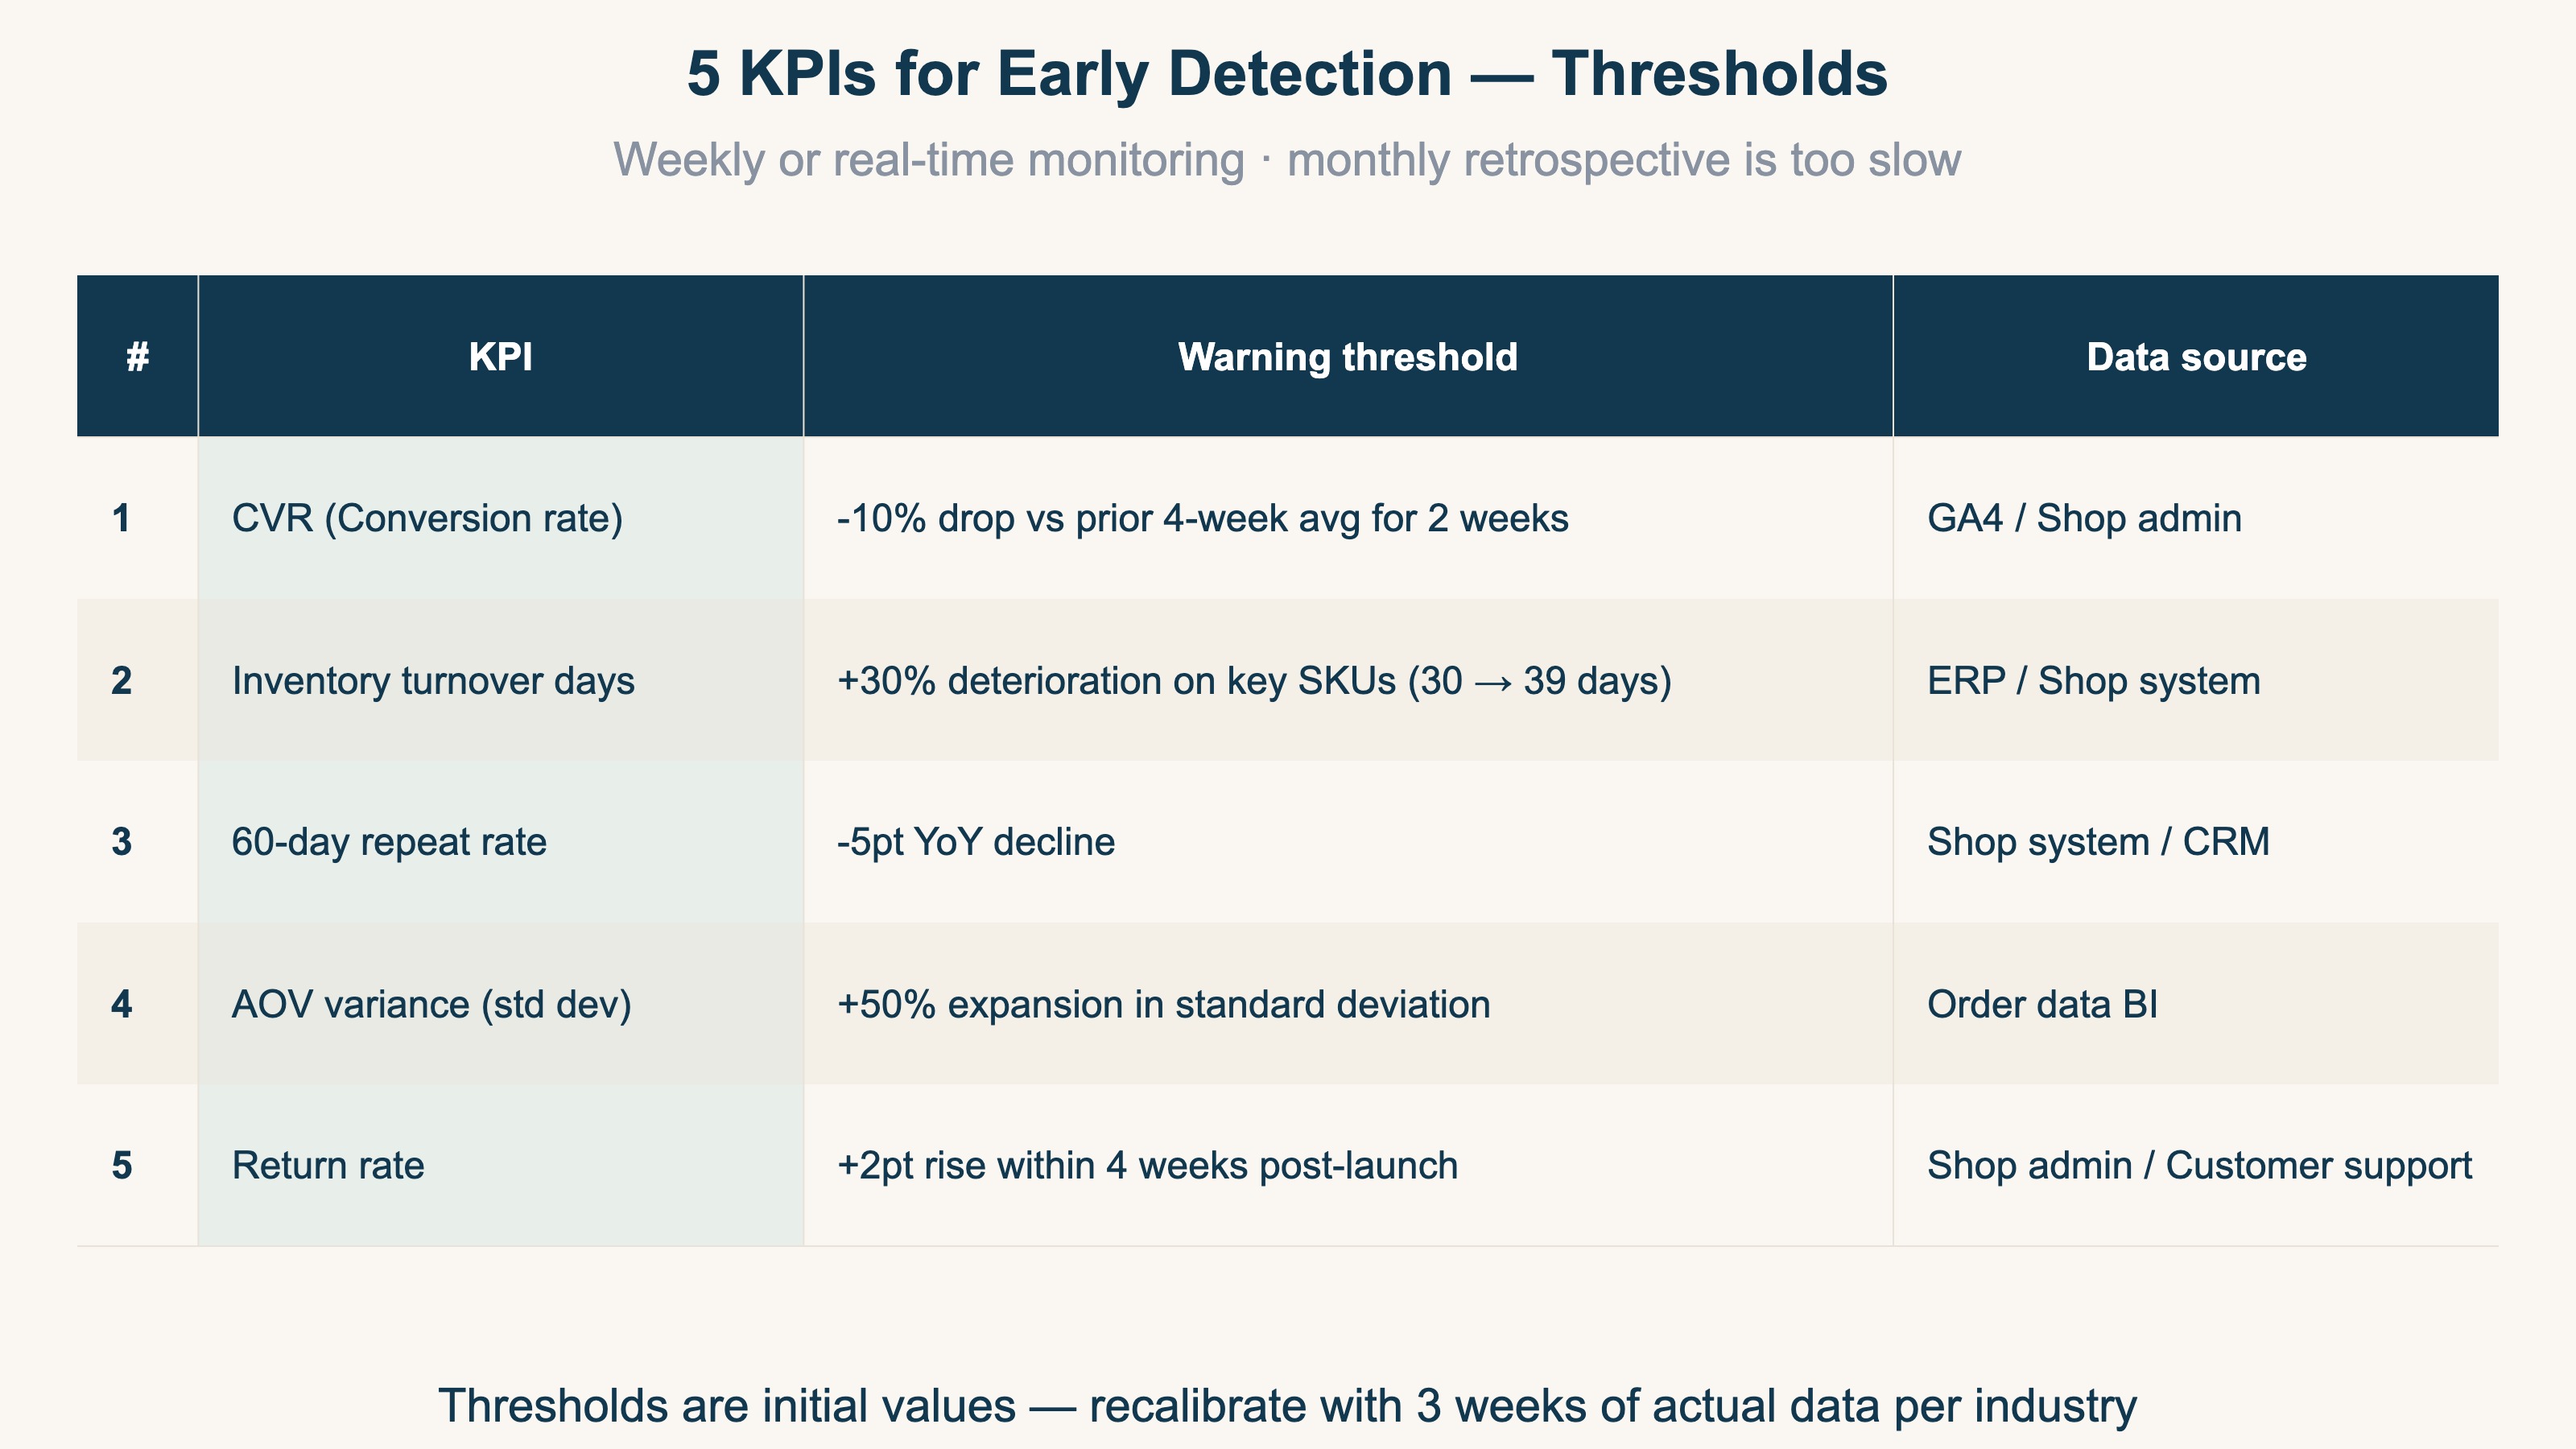
- CVR (purchase rate): warn when it drops -10% or more vs the prior 4-week average for 2 consecutive weeks
- RPS (revenue per session): AOV rose but RPS is flat to down — a sign thin orders are increasing
- AOV spread: when one channel or new/returning AOV spikes alone, one segment is over-reacting
- Inventory turnover days: warn at +30% or more deterioration on key SKUs (30 to 39 days)
- 60-day repeat rate: warn at a -5pt or more decline year over year
Of the five, CVR, RPS, and AOV spread can be read from your on-site sales data (per-channel revenue analysis). Inventory turnover days and the 60-day repeat rate, by contrast, need numbers from accounting / inventory (ERP) or CRM, pulled from a separate system. The hard part isn't the mechanism. What's heavy is keeping this up — by channel and by new vs returning, re-aggregated every week. The more metrics and channels you add, the more the manual aggregation piles up.
4. Defense Moves by Risk#
Bottom line: Decide what to play back when a signal fires. Set the thinking per risk ahead of time — but checking whether it works has to continue every week.
Once a signal fires, what do you play back? Deciding a stance per risk cuts post-launch firefighting. The thinking itself isn't hard.
- For a CVR drop: tier the free-shipping threshold / make the upsell "skip" path explicit / show the total price up front (kills surprise-cost shock). For a full purchase-rate audit, see the 30-point CVR Checklist
- For stock pressure: sync bundle combinations with inventory / cap promo-linked stock / raise safety stock on top SKUs
- For broken repeat: make the subscription's 2nd-cycle skip free / shorten next-order coupon validity (stops the stockpile-wait) / win-back tactics aimed at drifting customers
- For mismeasurement: compute AOV excluding returns and cancellations / publish a per-unit figure alongside bundles / read revenue per session (RPS) too
The thing to watch: deciding the move is easy, but confirming it works is heavy. Unless you compare, week by week and channel by channel and new vs returning, how revenue efficiency moved after a lever shipped, you won't notice the apparent AOV.
RevenueScope's solution
Bottom line: Is the AOV lift real or only "apparent"? RevenueScope tells them apart by bringing per-channel, new-vs-returning AOV and revenue per session onto one screen.
Every defense move above shares one premise: after a lever ships, you compare whether it works "by channel and by new vs returning," every week. By hand that's heavy, and it doesn't last.
GA4 gives you overall AOV, but bringing "AOV and revenue per session (RPS) for new and for returning visitors, by channel" onto one screen isn't something the standard reports surface. So "overall AOV went up, but is it an apparent AOV skewed toward one channel or new buyers?" stays hard to see.
RevenueScope brings, from your on-site sales data, per-channel AOV and revenue per session (RPS) onto one screen, revenue-first. It counts only real visits, with bots (automated traffic) removed.
| Channel | AOV | RPS (per session) | CVR (purchase rate) |
|---|---|---|---|
| Bundle-coupon traffic | 9,800 | 150 | 1.5% |
| Organic search | 5,200 | 240 | 4.6% |
| Newsletter | 6,100 | 330 | 5.4% |
| Retargeting ads | 5,800 | 210 | 3.6% |
(Figures are demo data in yen. An illustration of how it looks per channel in RevenueScope.)
In this table, bundle-coupon traffic has the highest AOV (9,800) yet the lowest RPS (150) and CVR (1.5%). It looks great on AOV alone, but it barely sells — an "apparent AOV." Newsletter, by contrast, sits mid-range on AOV but earns the highest RPS. Look at overall AOV only, and this gap gets buried.
Splitting new vs returning shows what's inside the lift, too.
| Stage | New-customer AOV | Returning-customer AOV |
|---|---|---|
| Before the bundle launch | 5,000 | 6,500 |
| After the bundle launch | 6,800 | 6,400 |
(Figures are demo data in yen. Returning = visitors who came back on a different day.)
After launch, new-customer AOV rose (6,800) while returning-customer AOV slipped a little (6,400). The AOV lift skewed toward a one-time reaction from new buyers and didn't reach the people who buy again — an unsustainable kind of lift.
Let's draw an honest line here. Inventory turnover, LTV (customer lifetime value), and gross margin are outside RevenueScope — they belong to accounting software or CRM / inventory (ERP) systems that join order data per customer (the LTV concept is in the customer lifetime value (LTV) guide). What RevenueScope adds is comparing per-channel, new-vs-returning AOV and revenue per session (RPS), revenue-first, to tell a real AOV lift from an "apparent AOV."
FAQ#
Q. Should I stop running AOV-uplift levers?
No. The levers themselves work. The problem is judging success on "overall AOV went up" alone. Lean on one channel or new buyers and revenue can stay flat through thin margin or broken repeat. Run the levers alongside CVR, RPS, and per-channel / new-vs-returning AOV, and check that it isn't an apparent AOV.
Q. How do I tell whether it's an "apparent AOV"?
Look beyond overall AOV — split it by channel and by new vs returning. If, say, only coupon traffic has high AOV while its revenue per session (RPS) is low, that channel is thin-margin. If only new-customer AOV rises while returning customers stay flat, it's an unsustainable kind of lift.
Q. Can RevenueScope cover inventory or LTV risk too?
No. Inventory turnover, LTV (customer lifetime value), and gross margin are outside RevenueScope — they belong to accounting software or CRM / inventory (ERP) systems. What RevenueScope reads is per-channel, new-vs-returning AOV and revenue per session (RPS). It adds the part where you tell, revenue-first, whether an AOV lift is real or only apparent.
Summary#
AOV-uplift levers belong to the decisions where launch order and defense order must be designed together. Revenue is "sessions × CVR × AOV," and raising AOV alone won't grow it if CVR falls or thin-margin orders increase. What matters is not settling for "overall AOV went up." Split by channel and by new vs returning, and tell whether the lift is real or an "apparent AOV" skewed toward one part. Inventory turnover and LTV are accounting / CRM / inventory (ERP) territory, and while the thinking is simple, redoing it every month is heavy. On top of that, having per-channel, new-vs-returning revenue efficiency ready to compare makes it easier to decide which lever to defend and where to invest next.
See which ads actually drive revenue, at a glance
Free up to 5,000 sessions/month, AI analyst included. No credit card required. Up and running in 5 minutes.