
"Paid sessions are coming in, but purchases aren't growing." "There's a lot of drop-off after items go into the cart." Run an ecommerce store and you hit this kind of discomfort again and again.
Bottom line: the levers for improving CVR (Conversion Rate — the rate from purchasing sessions ÷ all sessions) can be organized into 6 areas, 30 items. But even if you fix all 30 from the top down, sometimes revenue doesn't move as much as you'd expect. The reason: a higher rate doesn't necessarily raise revenue per session.
So the 30 items aren't a "manual you complete by filling everything in" — they're a directional map that surveys where the room to improve is. This guide organizes the 30 checks as a map, then lays out the view for verifying the effect by revenue after you fix things, from an ecommerce operator's perspective.
Table of contents
Key takeaways#
-
CVR levers organize into 6 areas, 30 items
The foundation like render speed, forms and navigation, trust, pricing, cart and checkout, and the "one more nudge" systems. Each area has a different rough effect and effort.
-
Even after fixing all 30, revenue sometimes doesn't move
The rate goes up, but bot contamination, a tilt toward low-value channels, and the mixing of traffic sources mean revenue per session doesn't rise.
-
Verify the effect by the "session's price tag" (RPS), not by rate
After fixing, line up RPS by channel with bots excluded and compare. This is the part that's heavy by hand and the part you miss if you only chase the rate.
1. The 30 items are a directional map, not a step-by-step manual#
Bottom line: the 30 items below aren't a "fix from the top to complete it" manual — they're a map for surveying where the upside is.
CVR is one of the three numbers that determine revenue.
Revenue = Sessions × CVR × AOV (average order value = revenue ÷ orders)
The levers are scattered across the following 6 areas. Survey the whole as a map, then size up the areas that look weak for your store.
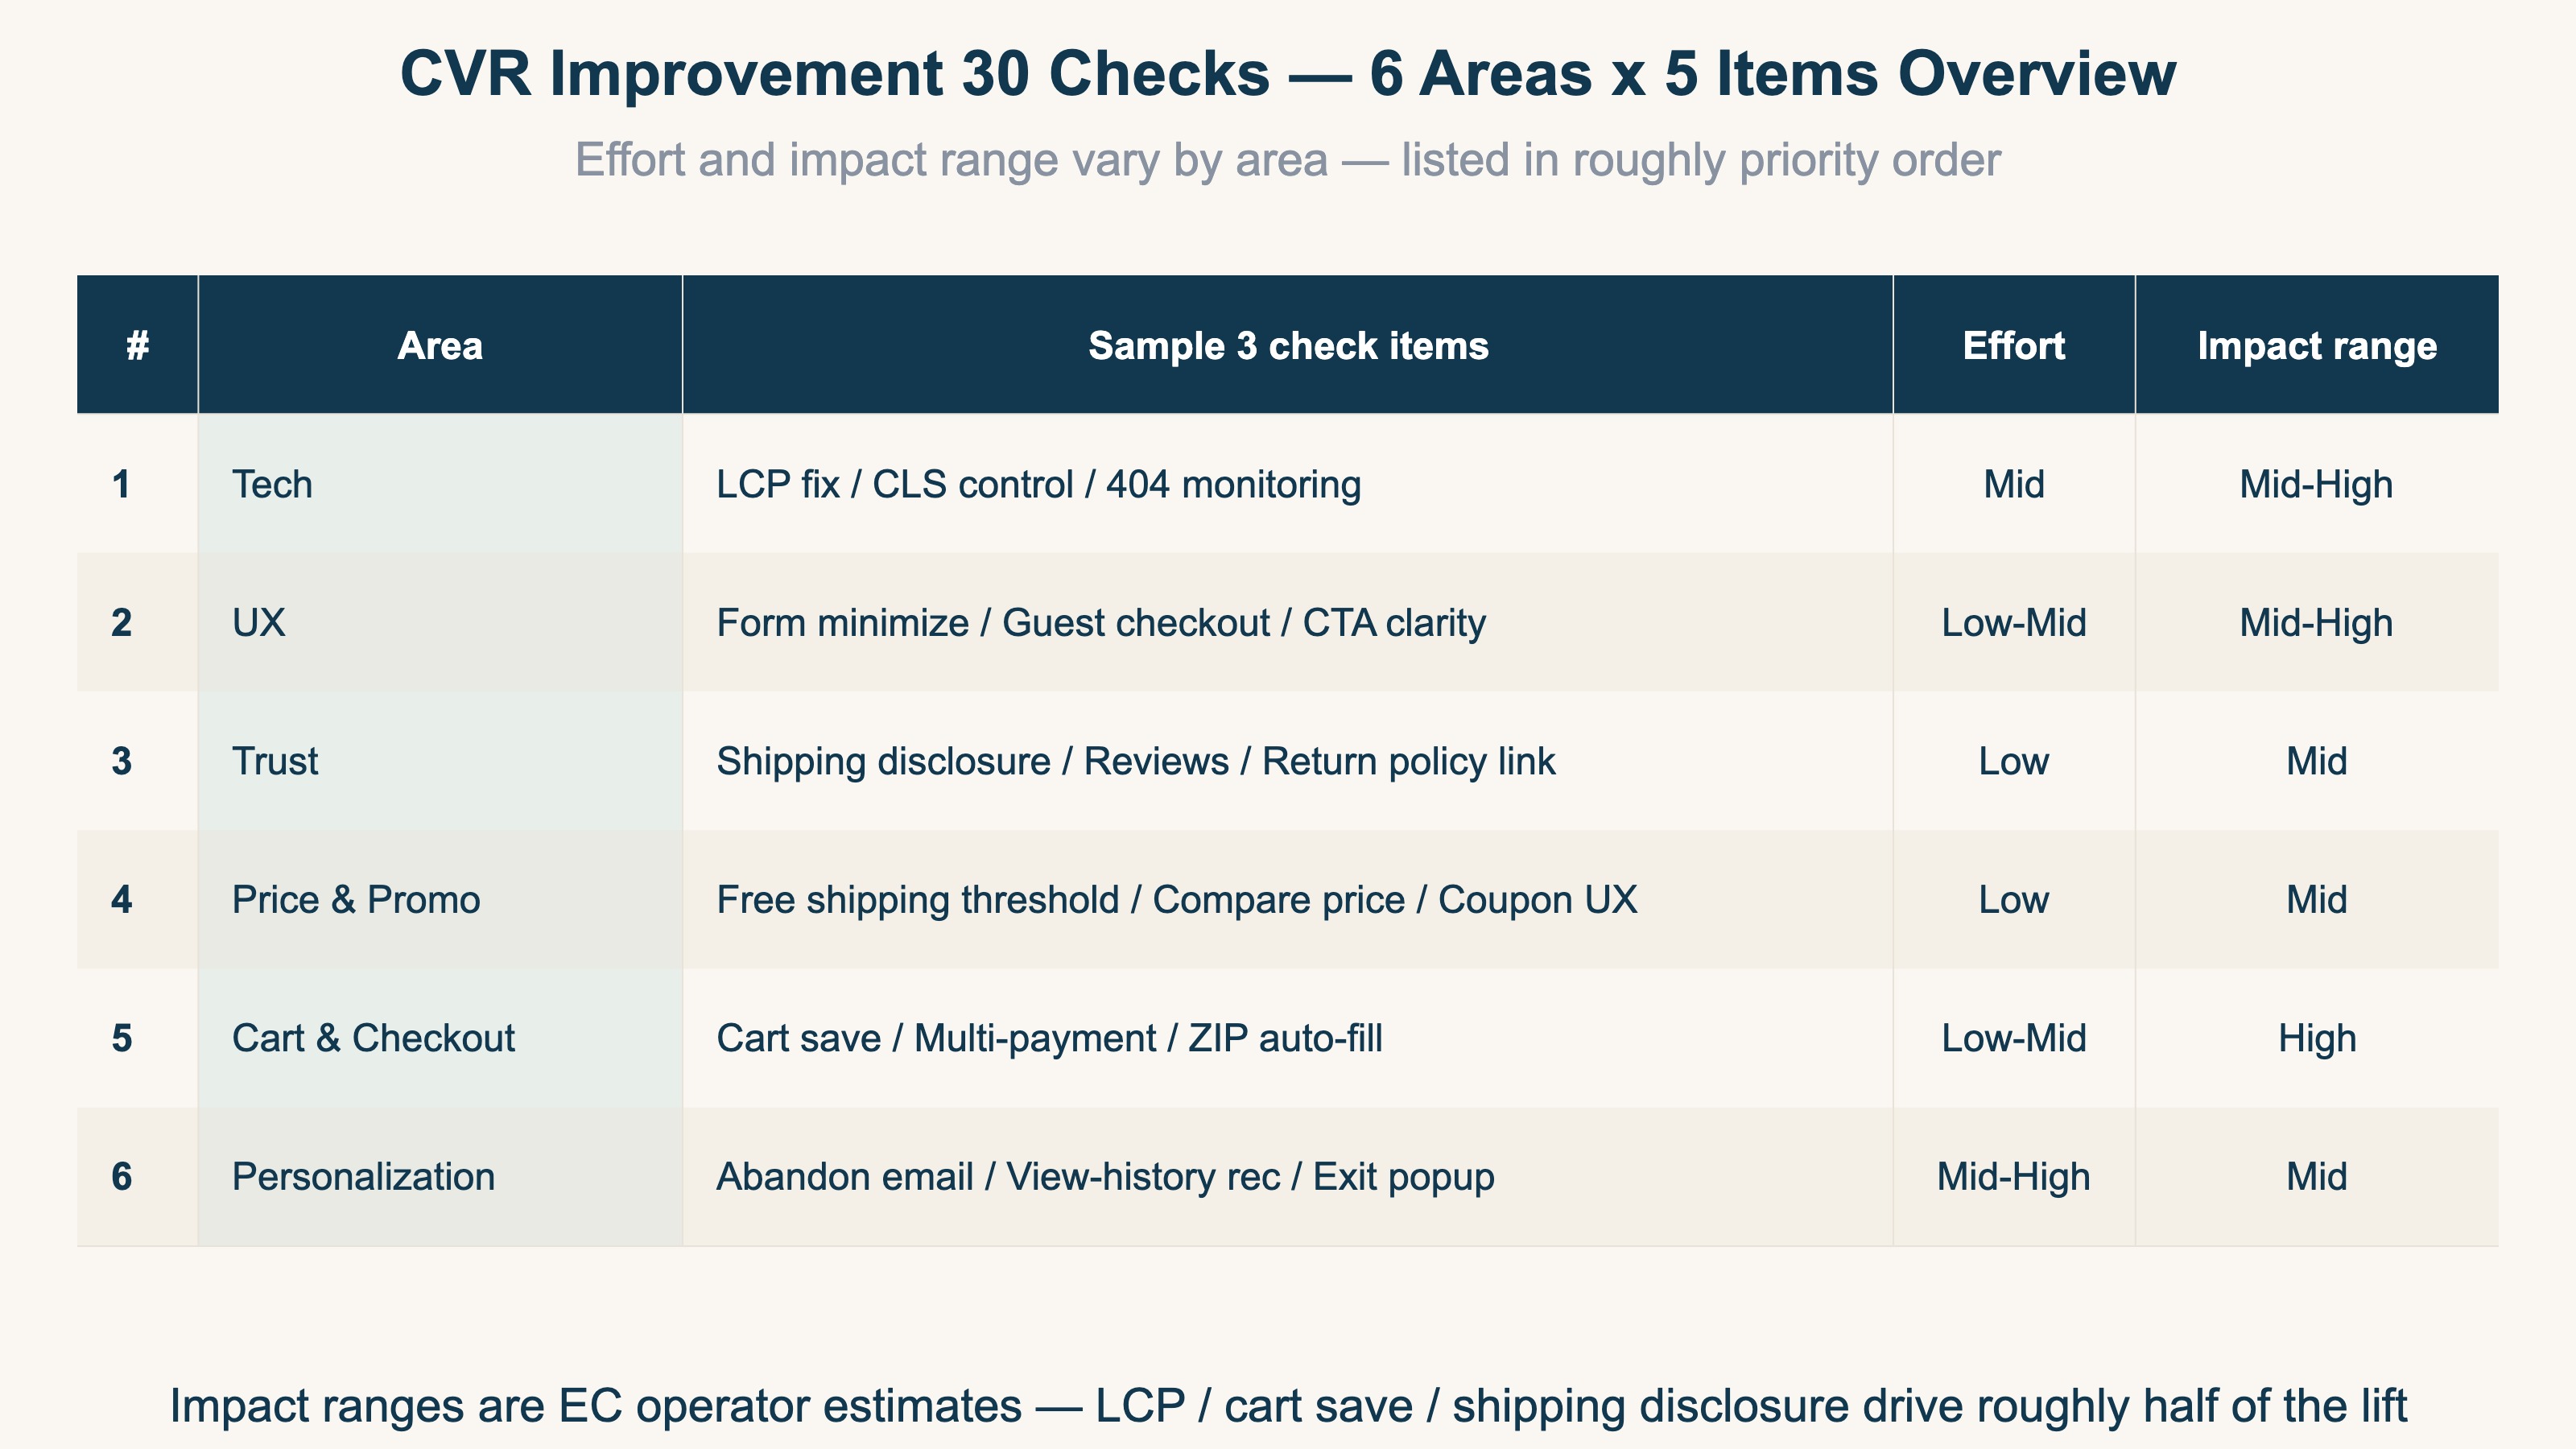
Tech (foundation): 1. LCP (rendering of the largest element) within 2.5 seconds / 2. CLS (layout shift during load) at 0.1 or below / 3. 404 error monitoring / 4. broken mobile layout / 5. HTTPS and Mixed Content. When Web Vitals[1] are broken, every improvement layered on top struggles to take effect.
UX (drop-off): 6. trim input fields to 8 or fewer / 7. enable guest checkout / 8. CTA button color and label / 9. search-bar accuracy / 10. whether the add-to-cart button sits in a visible position on mobile.
Trust: 11. shipping cost and delivery time disclosed up front / 12. a path to the return and refund policy / 13. review count and star rating / 14. payment logos shown / 15. a contact path.
Pricing & promotion: 16. comparison price displayed / 17. free-shipping threshold clearly shown / 18. clarity of coupon application / 19. alternatives offered for out-of-stock items / 20. restraint in flash-sale messaging.
Cart & checkout: 21. cart held 7+ days even without login / 22. 3 or more payment methods / 23. postal-code autofill / 24. numeric keyboard invoked / 25. specific error wording.
One more nudge: 26. recommendations based on browsing history / 27. cart-abandonment recovery email / 28. exit-intent popup / 29. perks pitched to returning visitors / 30. chat launch right before exit.
These 30 are, at most, "a list of fix candidates." Filling all of them isn't the goal. Next, let's think about the order to start in.
2. Fix in order of high impact and low effort#
Bottom line: the order to fix is "high impact, low effort" first. In a 4-quadrant view, you start from the top-left.
Place the 30 items on the two axes of "size of effect" and "effort to fix," and a priority order emerges. The top-left — high impact, low effort — holds LCP improvement, cart persistence, up-front shipping disclosure, form minimization, and the like. Starting here, motion comes more easily for less labor.
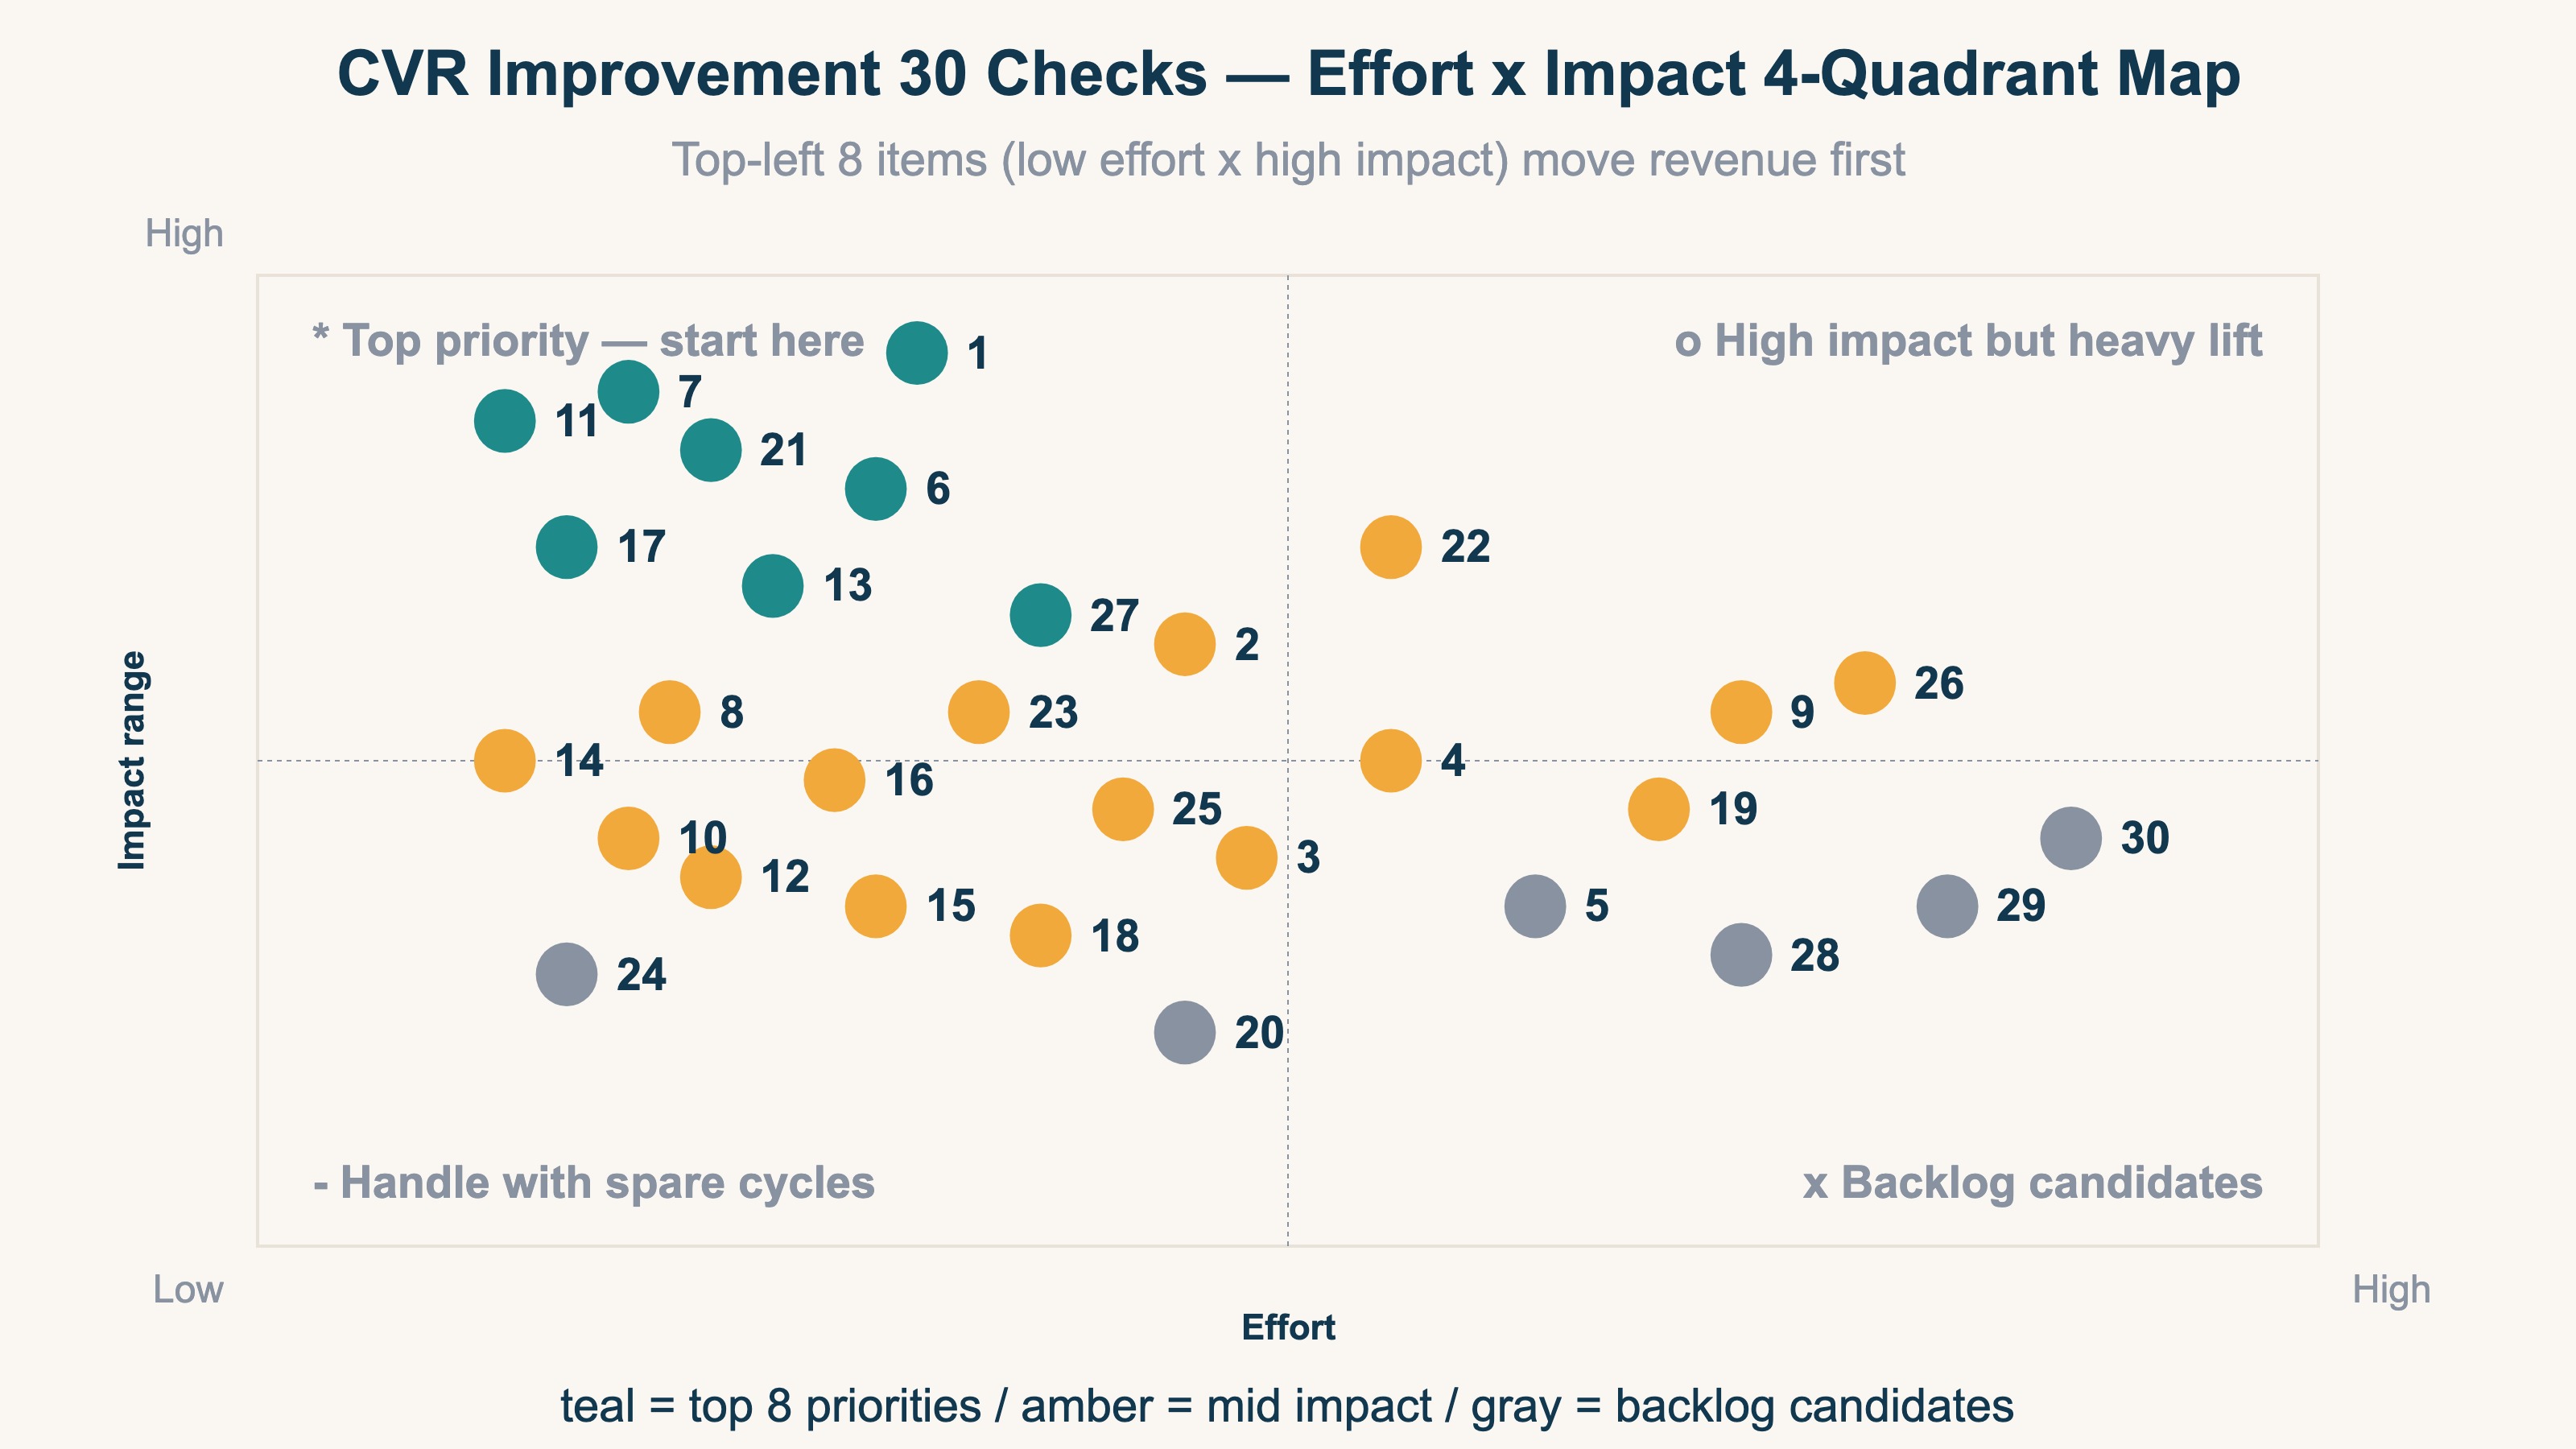
For example, a site that requires account creation can cut a lot of drop-off just by opening up guest checkout. Required account creation is a regular near the top of cart-abandonment reasons[2]. Render speed is the same: the sense that CVR steps up a level when LCP shrinks from 4 seconds to 2 seconds is often talked about.
That said, ranges like these are rough estimates based on operators' felt sense, not guaranteed numbers. They swing widely by product, customer base, and price band. So don't stop at the expected value of "fixing should raise it X%" — proceed on the premise of verifying how the actual numbers moved after you fixed. The way of thinking to raise CVR while balancing AOV is laid out in Improving CVR and AOV simultaneously: a 4-area frame from the revenue decomposition formula.
3. Three holes where CVR rises but revenue doesn't#
Bottom line: the reason revenue is hard to grow even after fixing the 30 items and raising CVR is that there are three holes the rate alone can't see.
The rate only expresses "what % of the whole bought" — it doesn't reflect how much revenue that purchase was, or who bought. Three holes open up here.
The first is bot contamination. When automated, program-driven access slips into the denominator of sessions, the rate calculation itself goes off. Bots can pretend to be human and leave at 0 seconds, lowering the rate or, conversely, swelling the numbers of a particular channel.
The second is a tilt toward low-value channels. Hand out coupons widely and the rate spikes for a moment, but the average order value (AOV) drops, and sometimes revenue barely grows. The way to read AOV is laid out in How to correctly calculate and raise AOV (average order value).
The third is the mixing of traffic sources. Across organic search, ads, and email, the same CVR produces wildly different revenue per visit. And when the source turns into Direct or (not set), which channel the result belongs to gets split, so leveling the rate across the whole gives you no decision material[3]. For the entry point to splitting channels correctly, see What goes into utm_source for Meta Ads, after all too.
4. Watch quality by revenue per session (RPS), not by rate#
Bottom line: to clear the three holes, watch quality by channel using RPS (Revenue Per Session = revenue per session, revenue ÷ sessions) rather than the rate.
RPS is a number like a session's price tag, expressing "how much revenue one visit produced, on average." Even at the same CVR, if you're tilted toward low-value channels, RPS won't rise. Conversely, some channels have a plain rate yet a thick revenue per visit. The point is to look not by the height of the rate, but by the thickness of revenue beyond the rate.
What bites here is the structural weakness of GA4 (free web analytics). GA4 outputs sessions and CV, but it doesn't set per-channel RPS as the protagonist of a single screen. Lining up channels side by side on clean numbers after bots are excluded also becomes manual work hopping across multiple reports. The thinking behind RPS itself is laid out in detail in What is RPS (revenue per session): calculation and improvement.
The idea itself isn't hard. What's heavy is, every month, by channel, and by new versus returning, removing bots and keeping the price tag (RPS) — not the rate — lined up. After you fix the 30 items, verify the effect by the quality of revenue, not the rate. This repetition is exactly the part that drops out if you only chase the rate.
RevenueScope solution
Bottom line: lining up per-channel RPS and bot-exclusion counts on a single screen, on human-only numbers — that's heavy in GA4's standard reports; it's RevenueScope's domain.
As long as you look at the rate leveled across the whole, the three holes stay invisible. RevenueScope judges bots by behavior, removes them from the totals, and shows per-channel real revenue and RPS on human visits only. How many were excluded as bots in each channel (the bot-exclusion count) lines up on the same screen too, so a channel that "had lots of sessions but almost no humans" is obvious at a glance.
For example, here's what "asking RevenueScope" looks like (demo data):
| Channel | Recorded sessions (incl. bots) | Of which excluded as bots | RPS (JPY) |
|---|---|---|---|
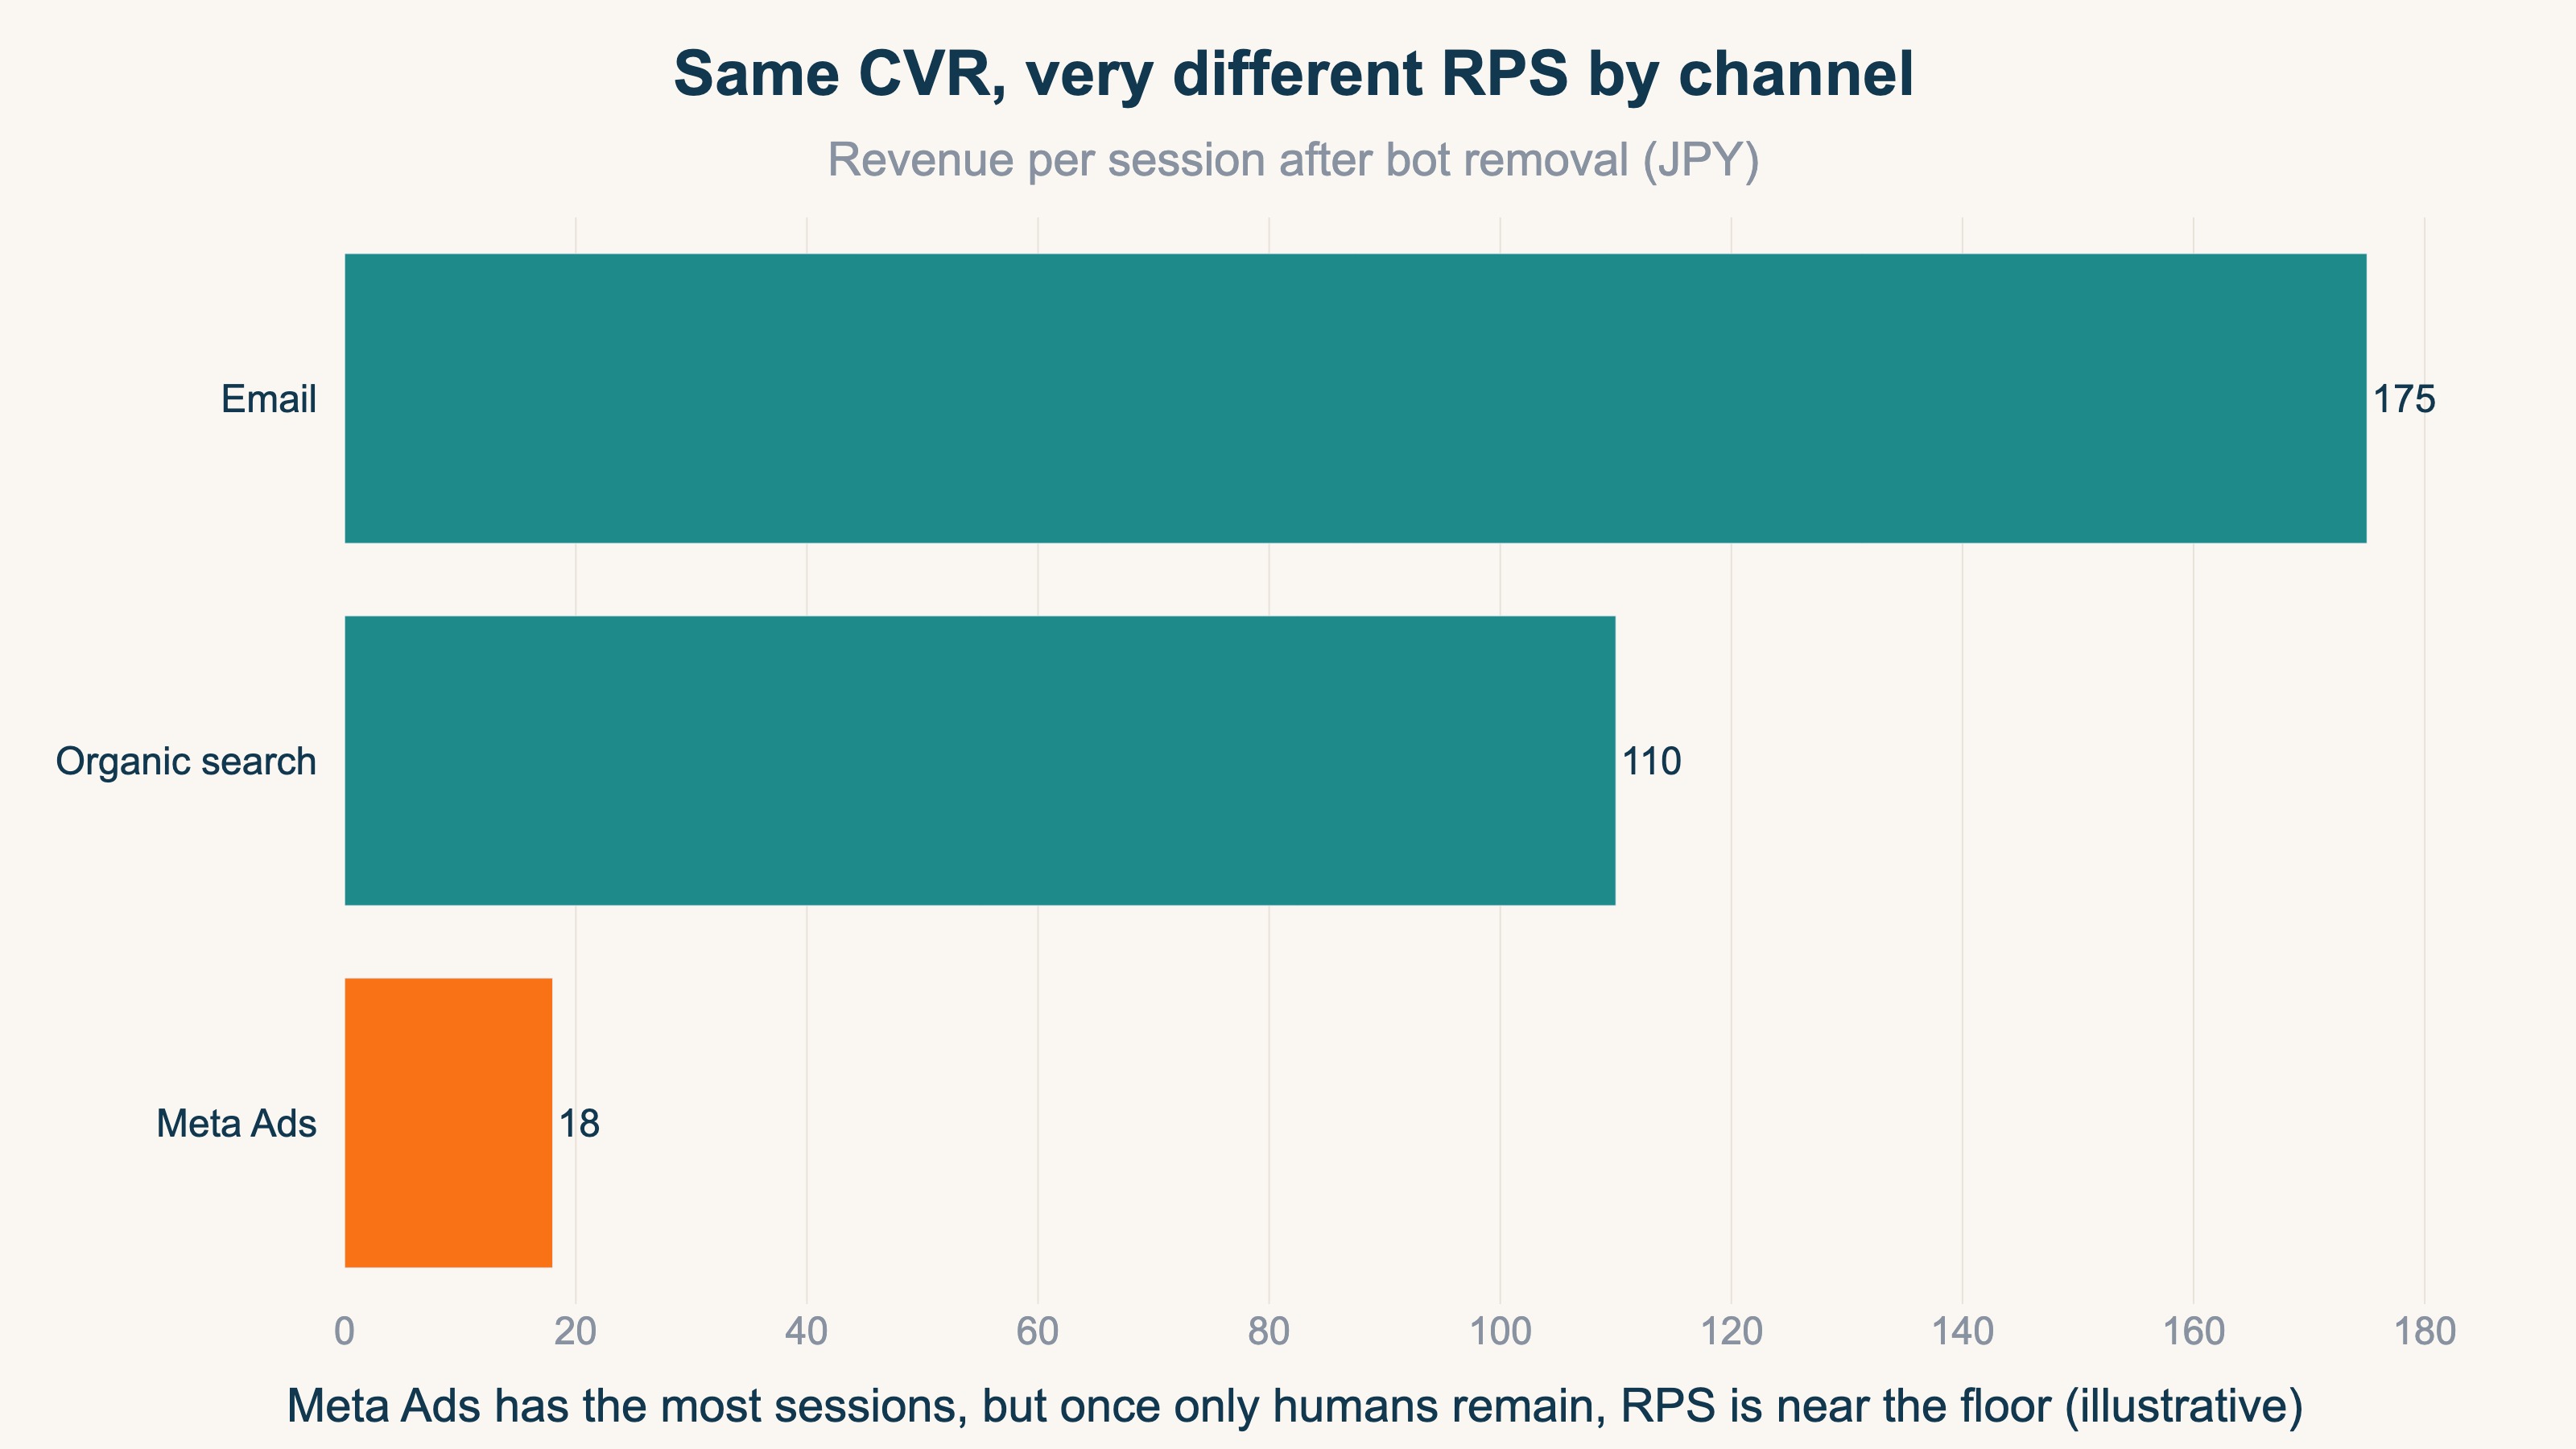
| Meta Ads | 1,400 | 760 | 18 |
| Organic search | 720 | 40 | 110 |
| 240 | 6 | 175 |
Meta Ads has the most sessions, but most of them are bots, and with humans only, RPS is near the floor. What you thought was a "channel that pays off if you fix it" by looking at the rate alone takes on a different shape when seen on bot-excluded revenue. Split it further by new versus returning and the rate differences get even clearer.
| Segment | CVR | RPS (JPY) | AOV (JPY) |
|---|---|---|---|
| New | 1.1% | 70 | 4,600 |
| Returning | 3.8% | 190 | 5,900 |
You can also switch how attribution is assigned (look only at the last touchpoint, or also credit the first touchpoint) and compare. On the other hand, what RevenueScope produces goes up to revenue, AOV, RPS, CVR, and sessions, plus their decomposition. It doesn't handle gross margin, LTV (customer lifetime value), inventory, or CRM numbers. Think of it as a tool to use as the foundation for continuously verifying the result of fixing the 30 items by the quality of per-channel revenue, not the rate. The design for putting revenue on a single screen is also covered in The correct design for a revenue dashboard.
FAQ#
Q. Do I have to fix all 30 items from the top in order?
No. The 30 items are a map for surveying "where the upside is," and filling all of them isn't the goal. Starting from the high-impact, low-effort ones and verifying how revenue moved each time you fix produces results within limited time.
Q. Why doesn't revenue grow even though CVR went up?
Because the rate only reflects "what % bought," not the amount of that purchase or its source. With bot contamination, a tilt toward low-value channels, or the mixing of traffic sources, the rate can rise while revenue per visit (RPS) doesn't. Verify by RPS rather than the rate and you'll notice the gap.
Q. Can't you see RPS with GA4 alone?
You can do the calculation itself from sessions and revenue in GA4. But setting per-channel RPS as the protagonist of a single screen, or lining up all channels on numbers after bots are excluded, becomes manual work hopping across multiple reports. Keeping up this view every month is the heavy part, in practice.
Summary#
The levers for improving CVR can be organized into 6 areas, 30 items, but even if you fix all 30, sometimes revenue doesn't move as much as you'd expect. There are three holes — bot contamination, a tilt toward low-value channels, and the mixing of traffic sources — that you miss if you only watch the rate. So use the 30 items as a directional map, and fix the high-impact, low-effort ones first. And after fixing, keep verifying revenue per session (RPS) rather than the rate, lined up by channel and by new versus returning, with bots removed. Seeing the effect by revenue, not the rate — that's the fork that connects the 30 checks to revenue growth.
See which ads actually drive revenue, at a glance
Free up to 5,000 sessions/month, AI analyst included. No credit card required. Up and running in 5 minutes.


