You spent on ads and new customers came in — but how much it cost to win each one stays vague. It is a common state in EC. The number that captures "what it cost to win one customer" is CAC (Customer Acquisition Cost).
CAC is not just a measure of ad efficiency. Whether the cost is cheap or expensive alone does not decide whether the acquisition is profitable. Here's the formula, how it differs from CPA, the benchmark against LTV, how tolerance varies by business type, and how to read the revenue efficiency that comes after acquisition — with charts and simple math.
Table of Contents
Summary#
-
CAC = the total cost of acquiring one new customer
The formula is "total acquisition cost ÷ new customers." It includes not just ad spend but labor and tool costs
-
It measures a different unit than CPA
CPA = cost per action in advertising. CAC = total cost per customer, with a wider cost scope
-
Judge CAC alongside LTV, not alone
The benchmark is LTV ÷ CAC = 3:1. If one customer's profit is three times the acquisition cost, it's healthy
-
CAC tolerance varies by business type
The higher the margin and the more customers repeat, the higher the CAC you can afford
-
What comes after acquisition is "revenue efficiency"
Which channel sells efficiently is read from RPS and AOV by channel and by new-vs-repeat
1. What Is CAC: the Formula and Cost Scope#
Bottom line: CAC is "the total cost of winning one new customer." Add up everything you spent on acquisition, then divide by new customers.
CAC (Customer Acquisition Cost) is the number for how much you spent to add one new customer. The formula is simple:
CAC = total acquisition cost ÷ new customers
Spend 1,000,000 yen across ads, labor, and tools in a month, gain 200 new customers, and CAC is 5,000 yen. The part people skip is the cost scope — enter only ad spend and you've basically computed CPA, not CAC. A proper CAC includes the labor and tooling behind acquisition. The more you add in, the closer it gets to reality.
2. CAC vs. CPA#
Bottom line: CPA is per "action," CAC is per "customer." And the cost scope is wider for CAC.
The metric most confused with CAC is CPA (Cost Per Acquisition). The names look alike, but they measure different units.
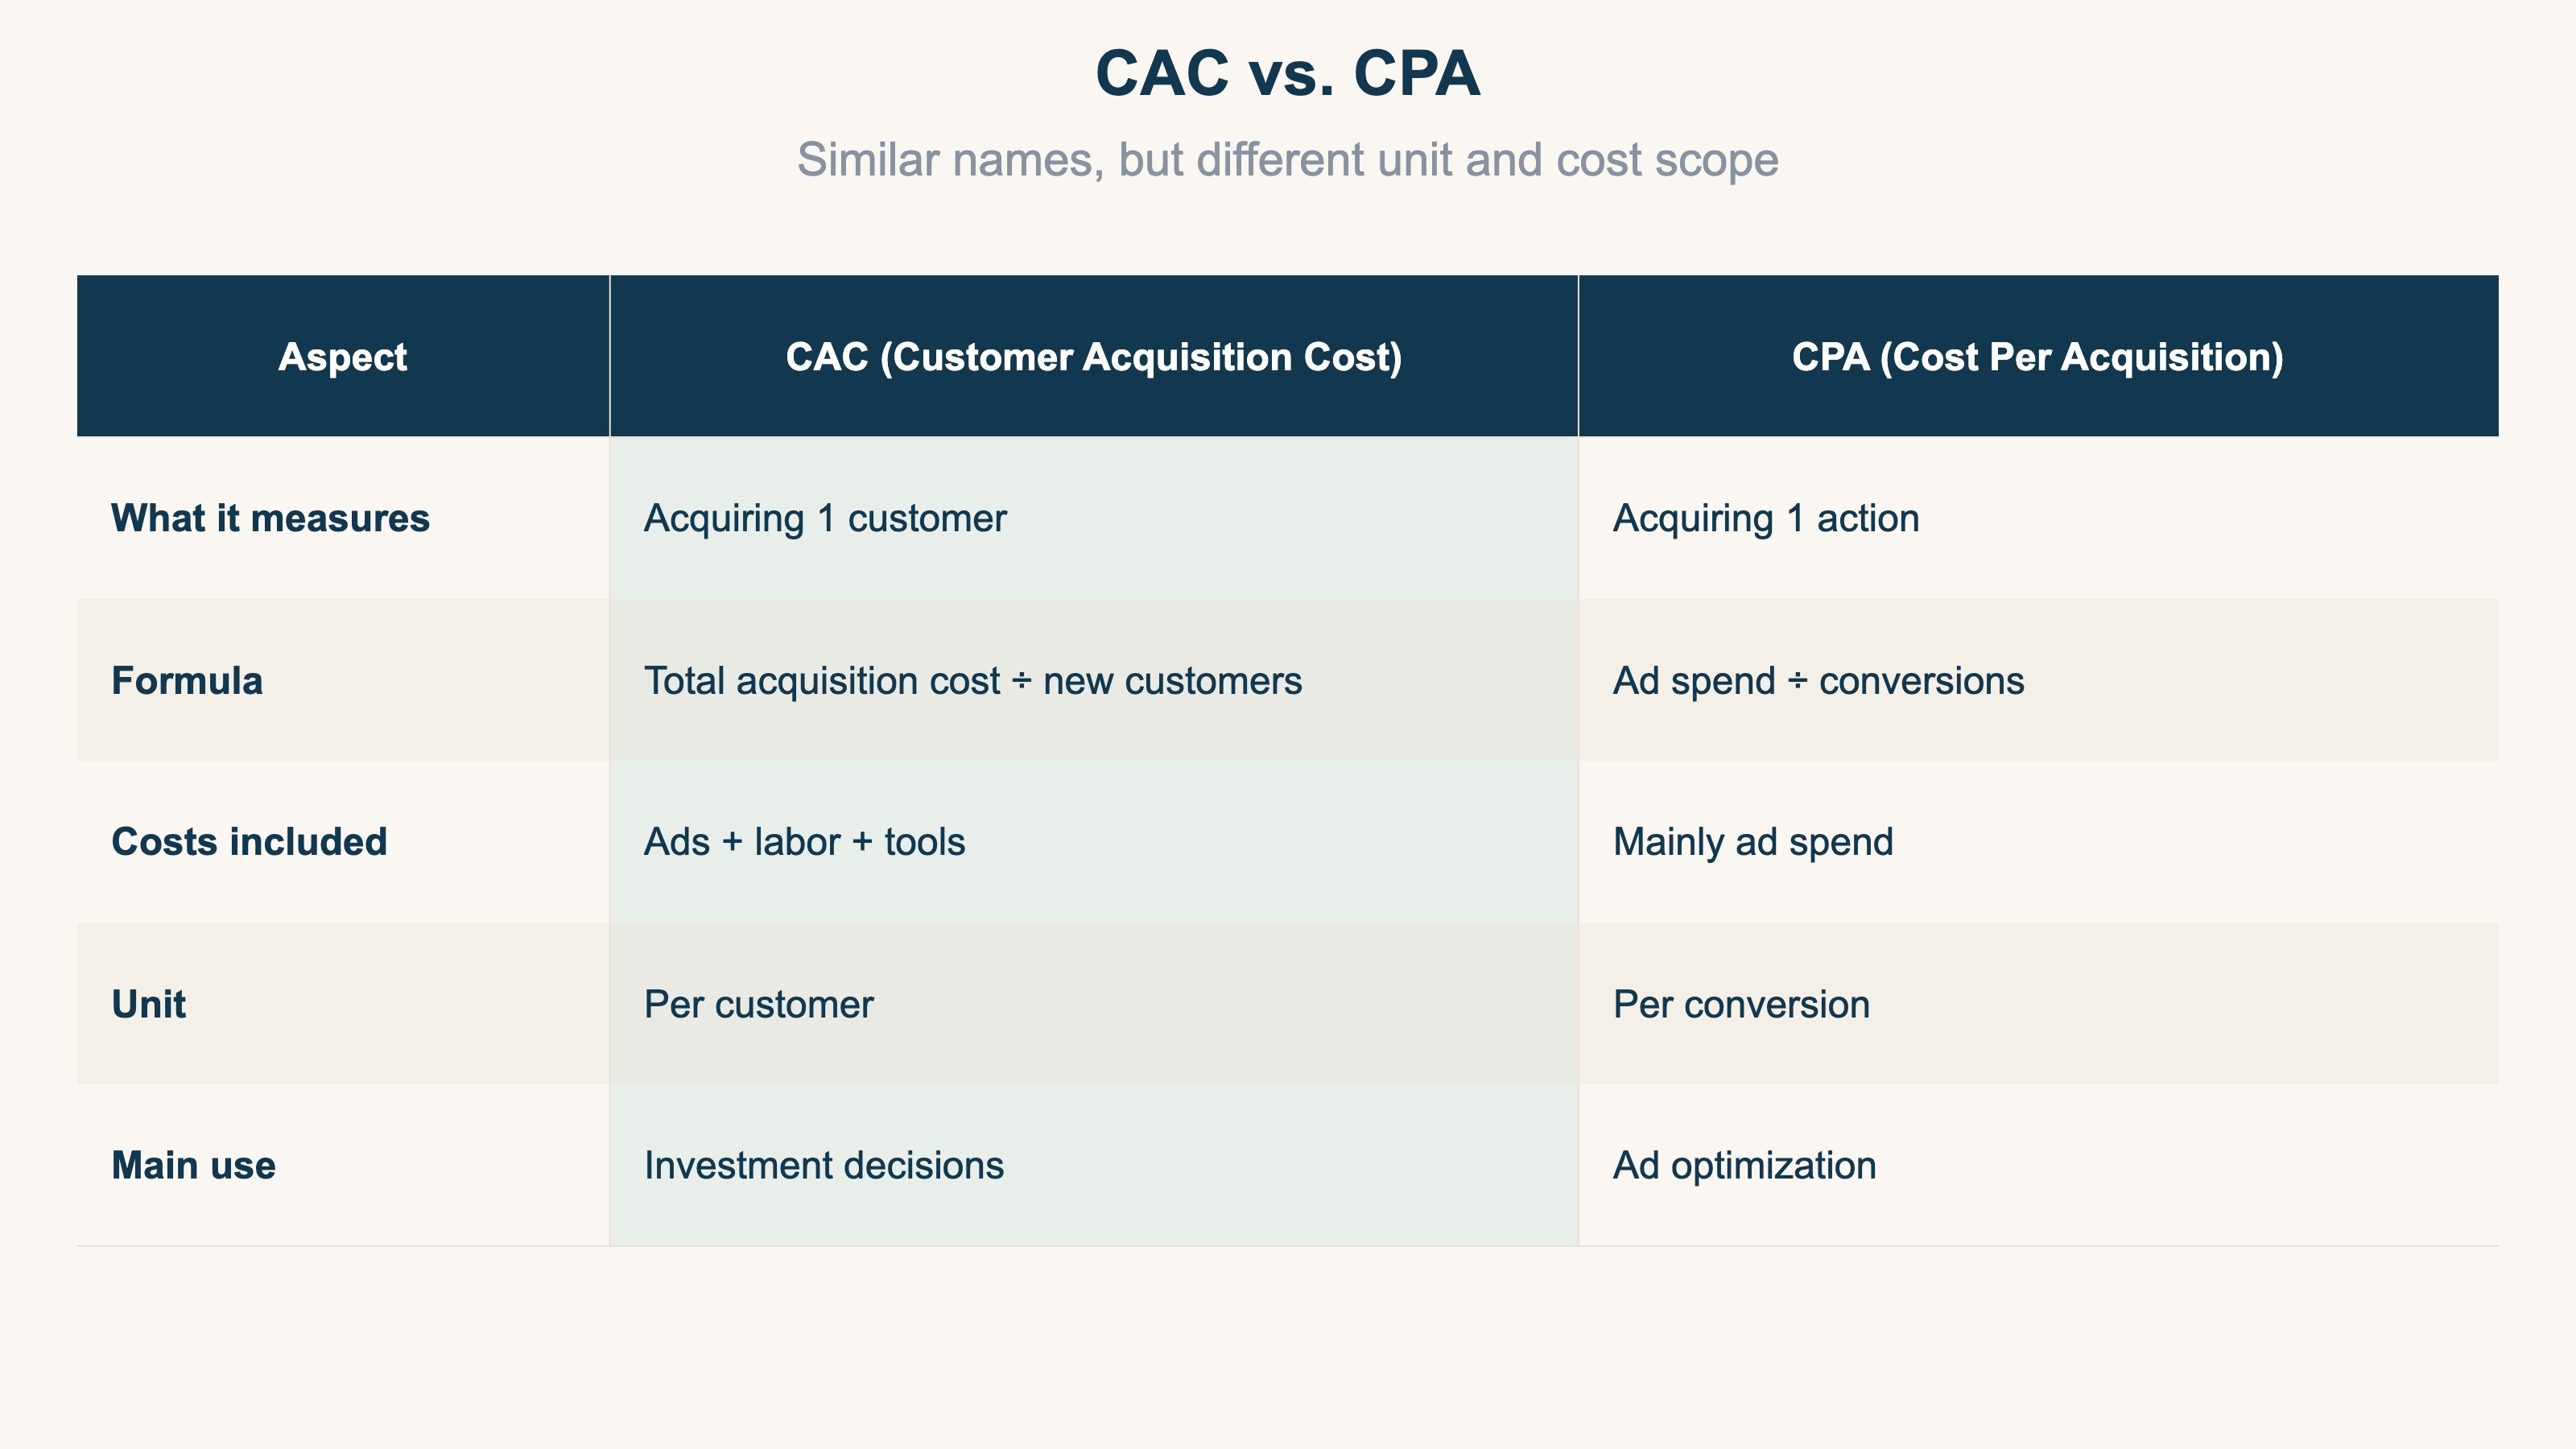
CPA = ad spend ÷ conversions, a per-action metric for ad efficiency. CAC = total cost ÷ new customers, a per-customer metric for business-wide efficiency. If the same person converts twice on day one, CPA counts two, CAC counts one customer, and CAC includes labor and tools. So CPA measures ad-channel efficiency, while CAC measures business-wide acquisition efficiency. Use CPA to tune ads, CAC to decide how much to invest. For more on CPA alone, see What is CPA: the basic metric for cost per action.
3. LTV and CAC: the 3:1 Benchmark#
Bottom line: CAC can't be judged on its own. Line it up against LTV (customer lifetime value) and read it against a 3:1 benchmark.
A CAC of 5,000 yen is neither good nor bad until you know the profit that customer will generate — their LTV (customer lifetime value, the total revenue or profit one customer generates over the long term). The common benchmark is "LTV ÷ CAC = 3:1": if the lifetime profit from one customer is three times the acquisition cost, you're healthy [1][2].
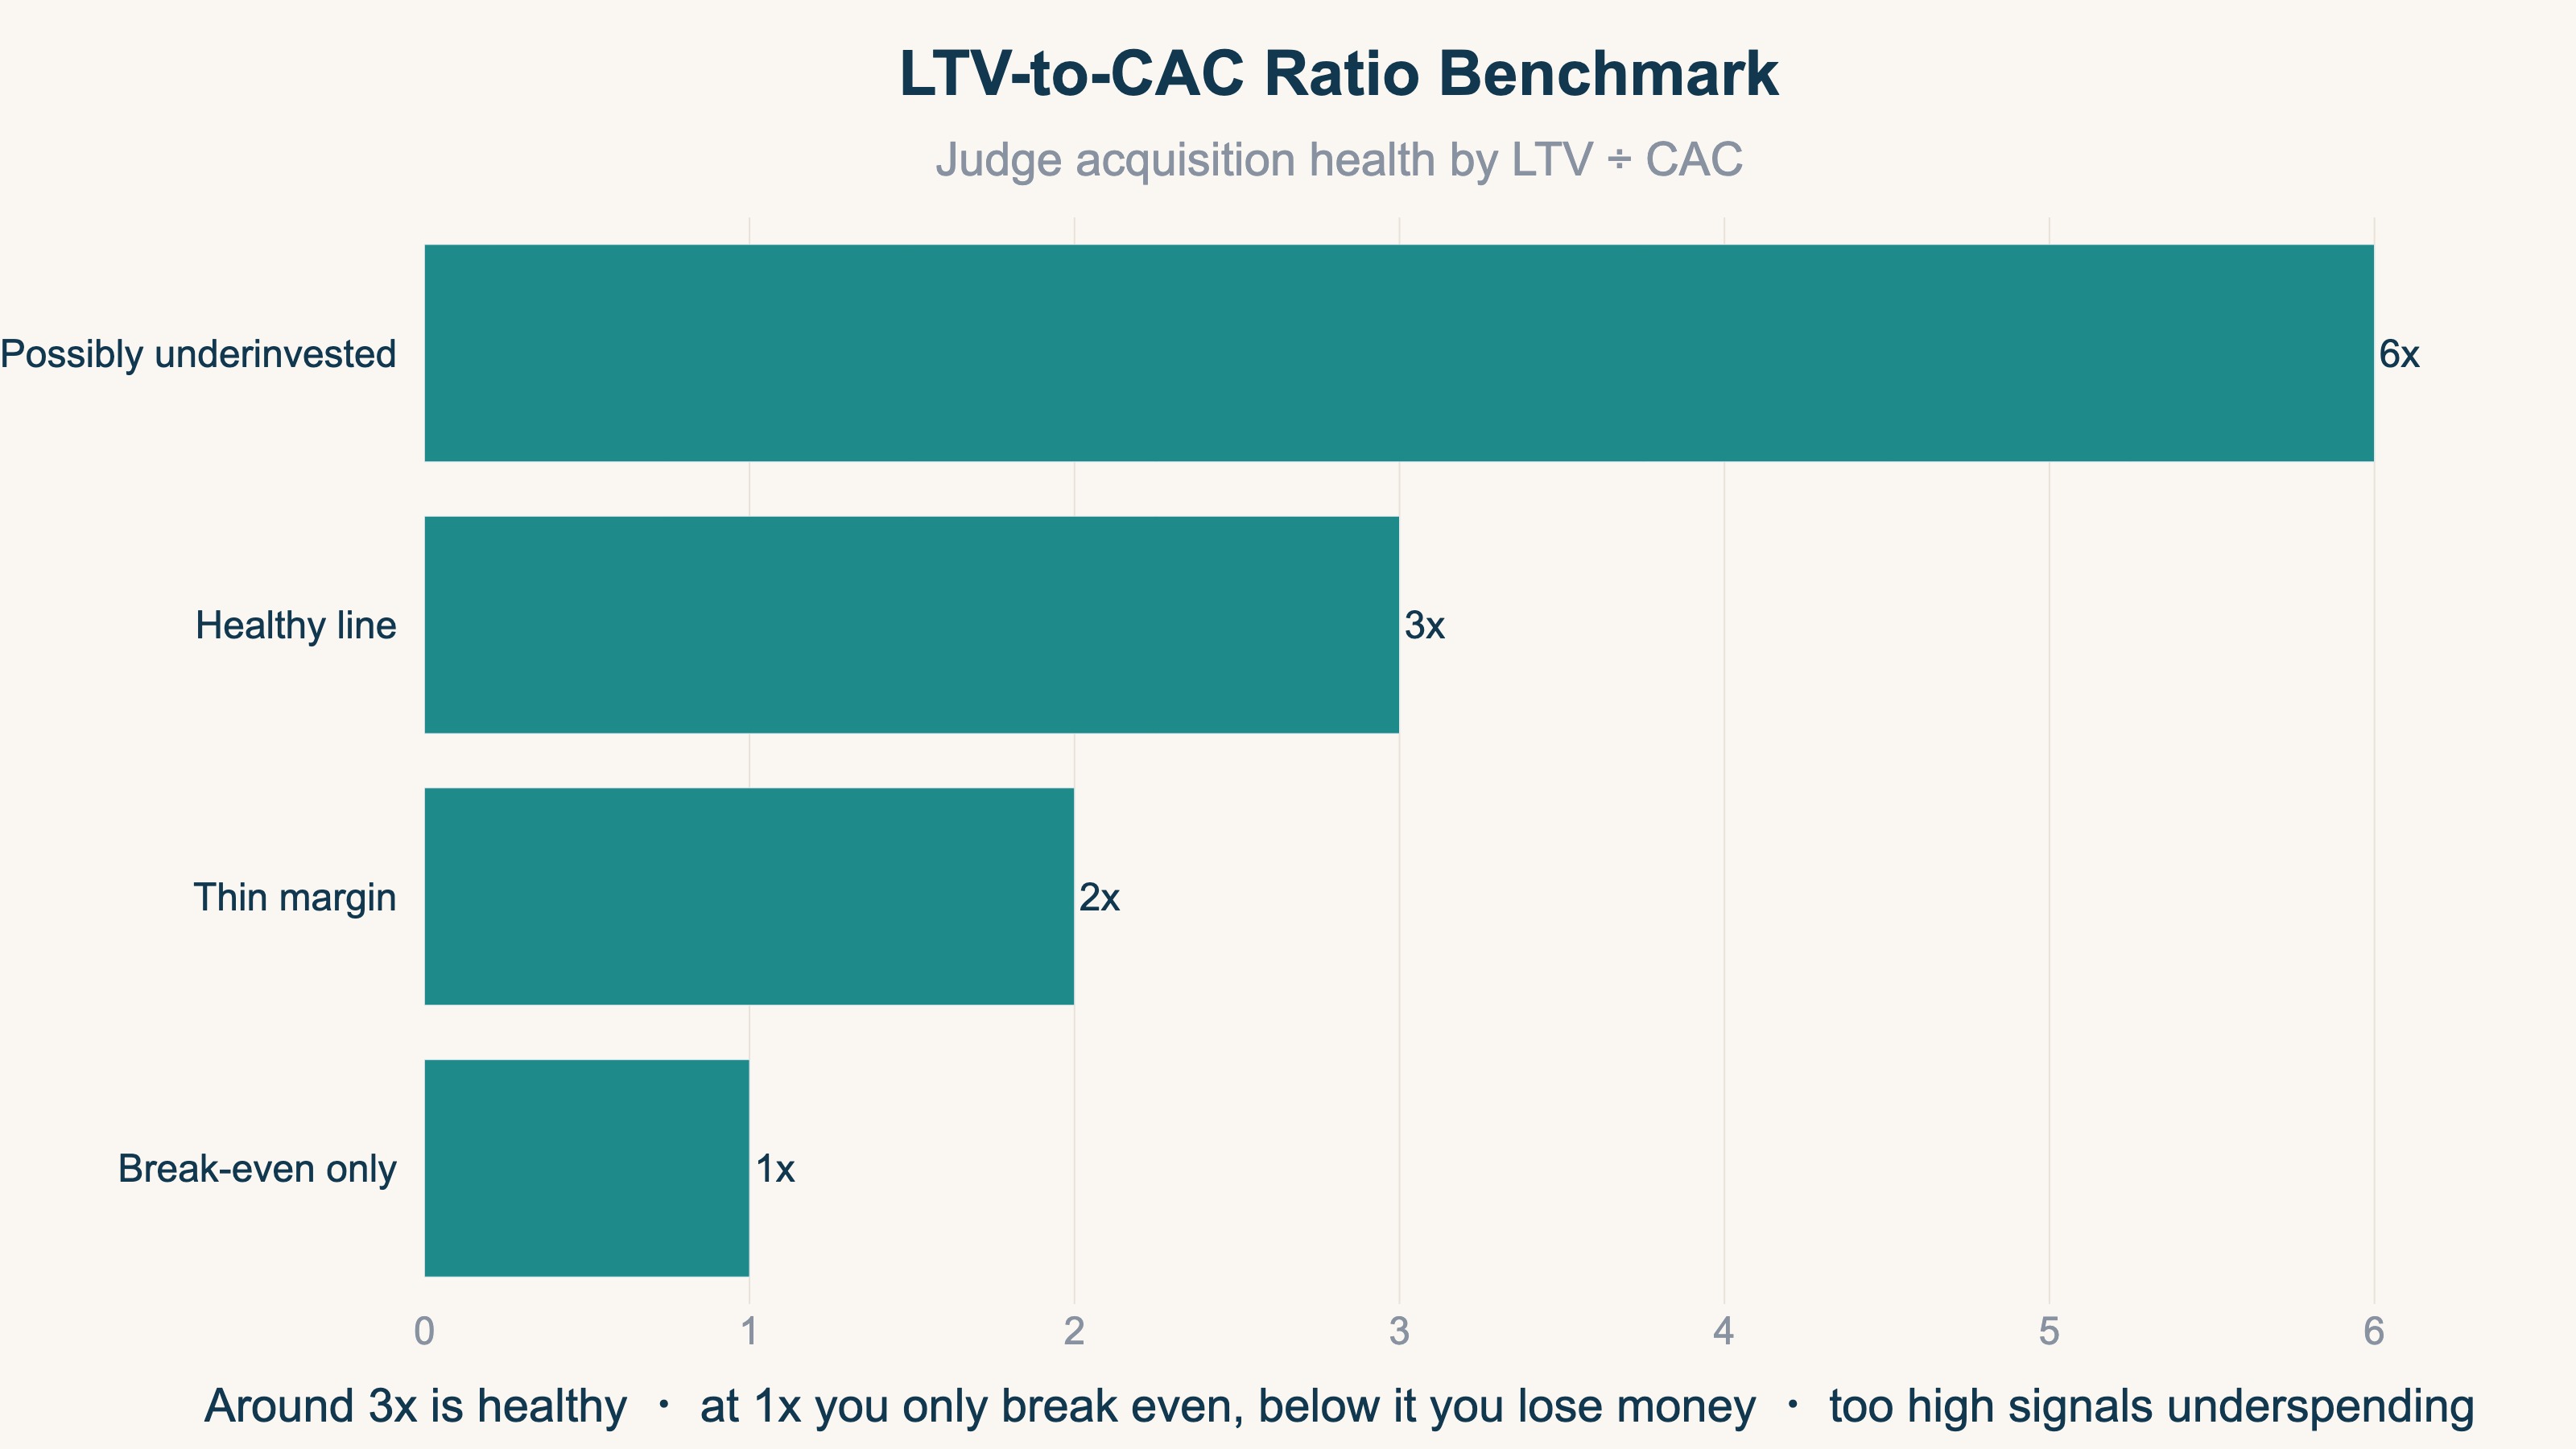
Below 1x, you lose money the more customers you win. Between 1x and 3x you recover but with a thin cushion, and around 3x is the healthy line. Well above 5x may signal you are underspending and leaving growth on the table.
Let us be clear about what's measurable here. The "confirmed values" of LTV, gross margin, and payback period need cost, accounting, and CRM data — analytics alone can't produce them. We leave the exact LTV calculation to How to calculate LTV (customer lifetime value). What this article covers next is the step before that: the revenue-side view of "after you win customers, which channel sells how efficiently."
4. How CAC Tolerance Varies by Business Type#
Bottom line: the ceiling on affordable CAC differs by business. The higher the margin and repeat rate, the more CAC you can spend.
The tolerance for "how much CAC is acceptable" is set less by the industry label and more by the product's gross margin and repeat rate. Even at the same CAC of 5,000 yen, some businesses can afford it and some can't.
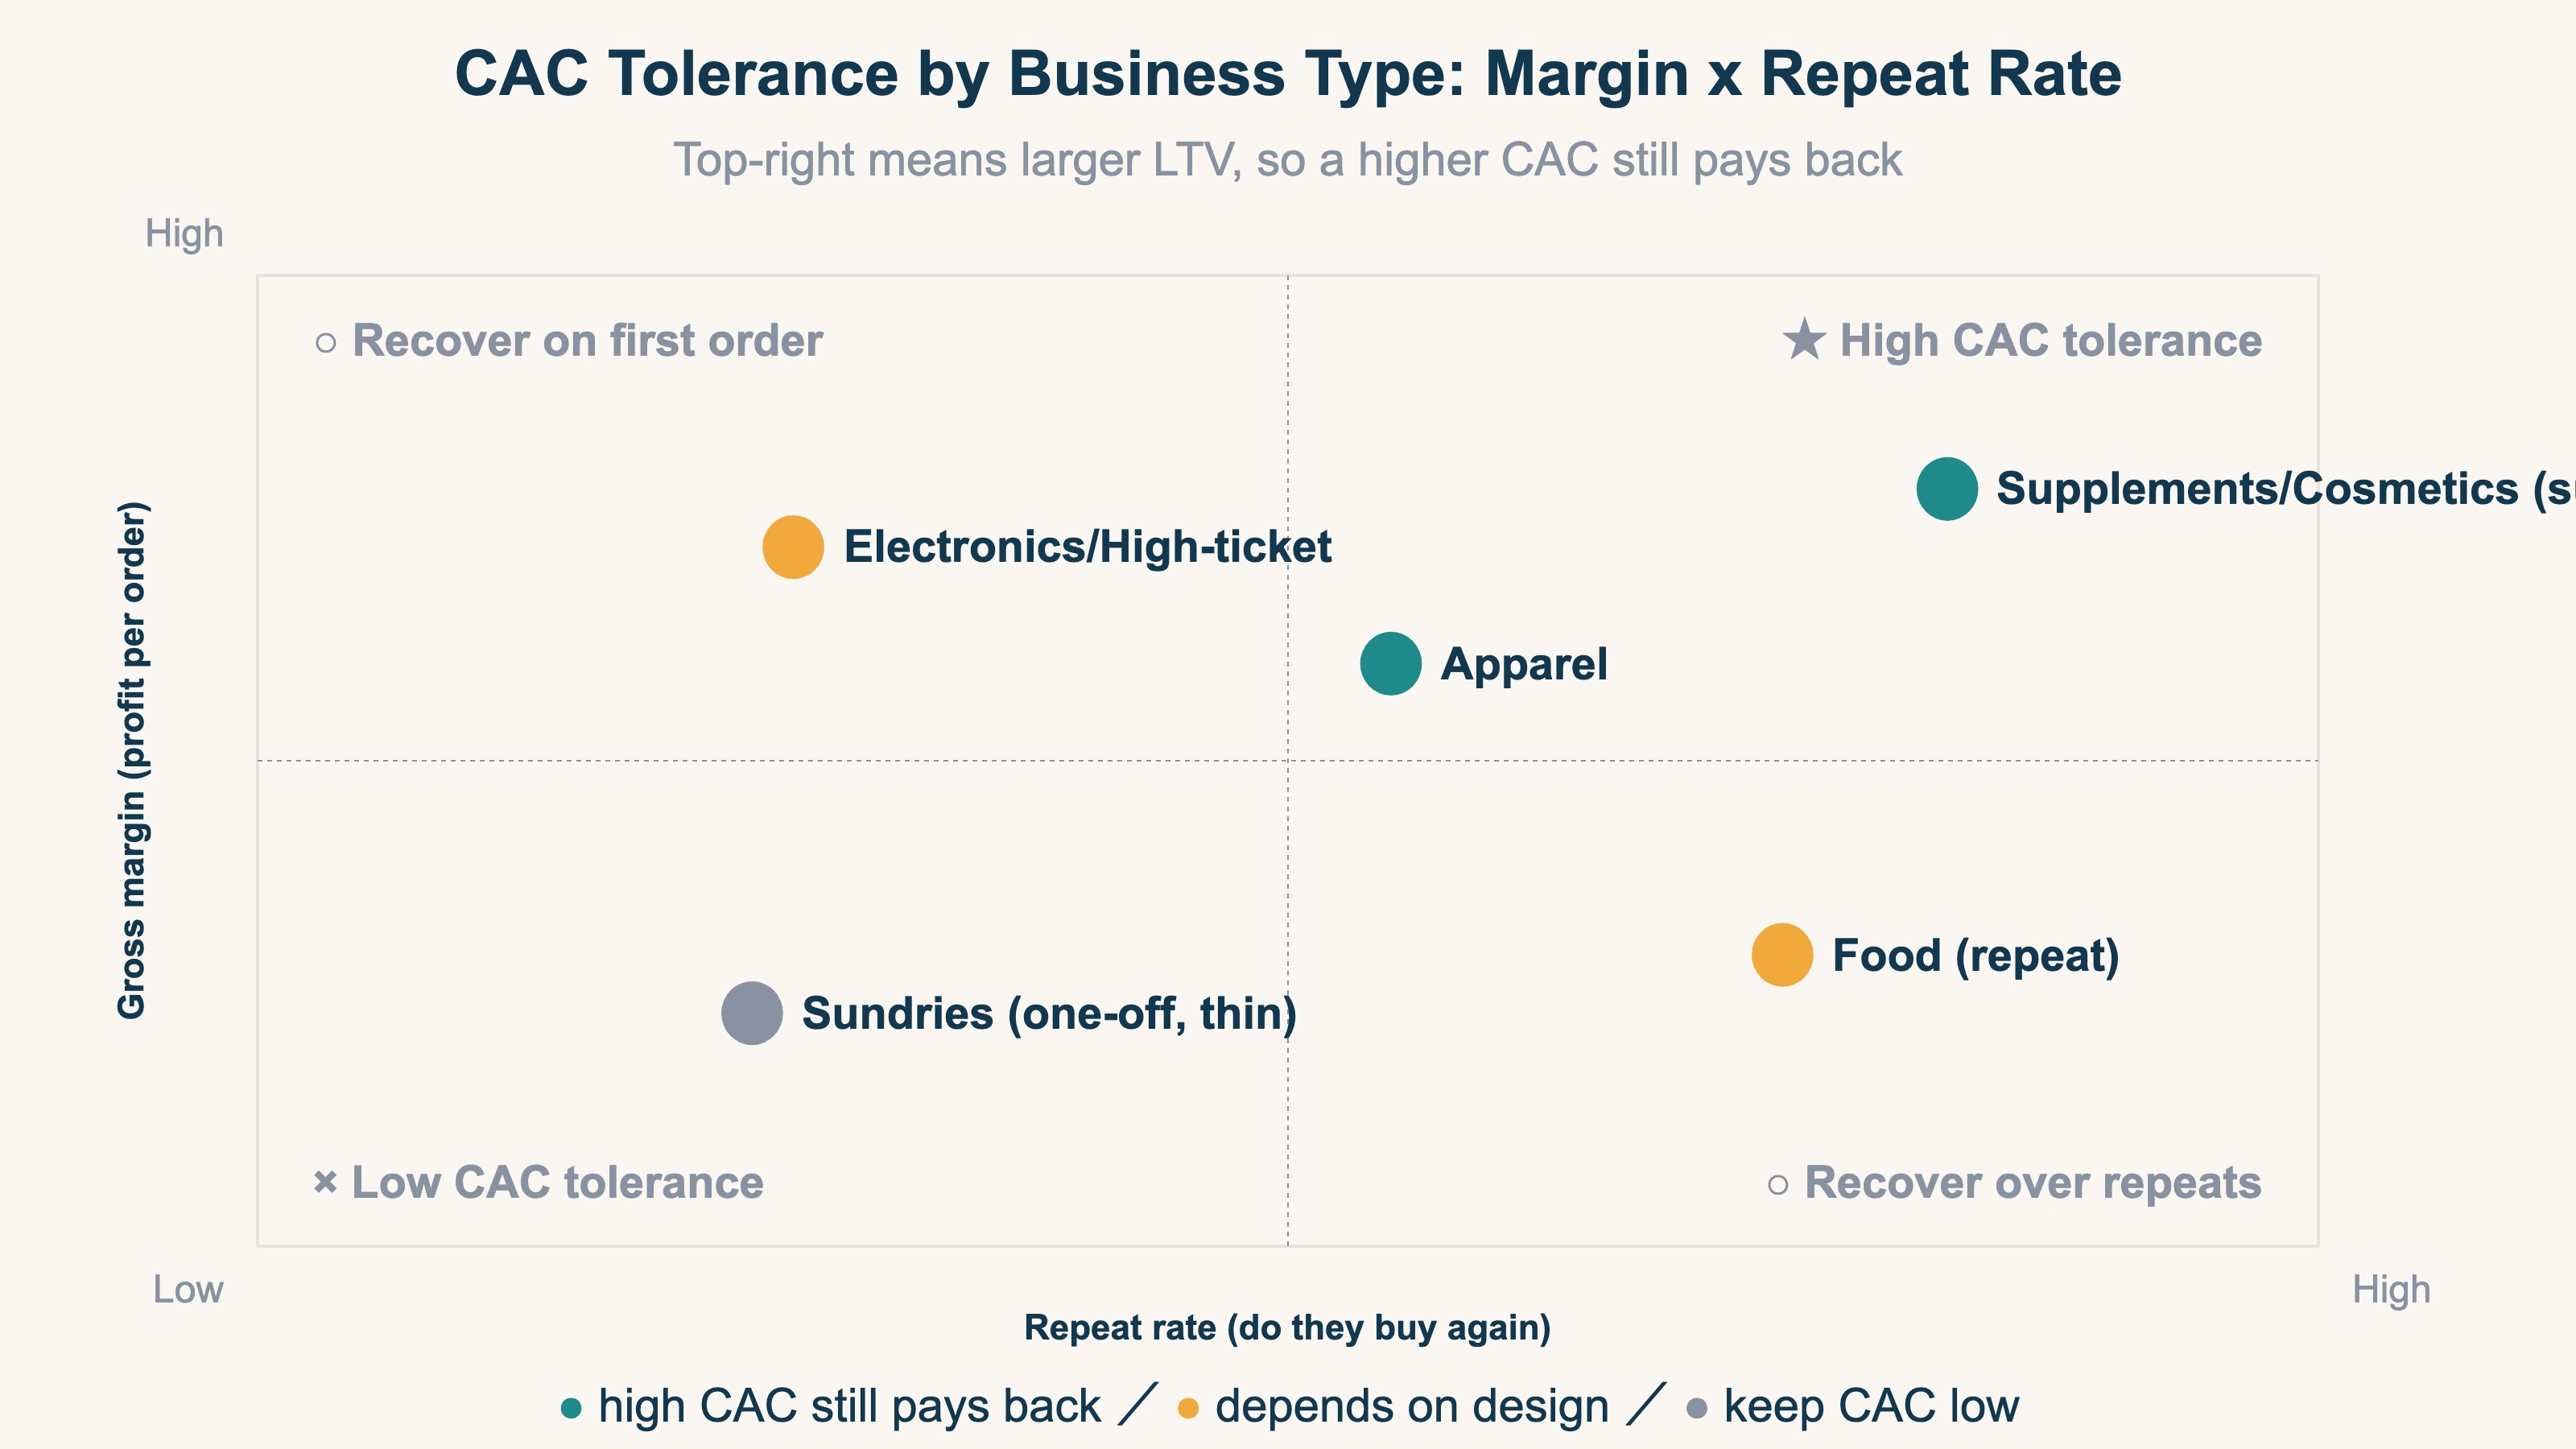
High-margin products bought on subscription — supplements, cosmetics — give one customer a large LTV, so a higher initial CAC pays back as they reorder. Thin-margin food or one-off sundries have a smaller LTV, so the affordable CAC is lower. That's why borrowing another company's "average CAC" is risky [3][4]; derive your own tolerance from your own gross margin and repeat rate. For how to find gross margin, see Gross margin: finding your EC break-even.
5. Reading the Revenue Efficiency After Acquisition#
Bottom line: after you compute CAC, what matters is comparing "revenue efficiency after acquisition" by channel and by new-vs-repeat. The idea is simple; lining it up every month is the heavy part.
Once CAC tells you "how much it cost to win them," the next thing that matters is "after you win them, which channel sells how efficiently." A cheap-CAC channel where the relationship ends after one purchase and an expensive-CAC channel whose customers keep buying have wildly different value at the same CAC.
The idea behind telling them apart is not hard. For each channel, line up revenue per session (RPS), average order value (AOV), and conversion rate (CVR), then split new from repeat and compare the revenue efficiency. That separates the "cheap to acquire but one-and-done" channels from the "expensive but loyal" ones. For the details of RPS and AOV, see What is RPS (revenue per session): the formula and how to get it in GA4 and What is AOV (average order value): how to calculate and raise it.
The heavy part is doing this every month, across channels, by hand. GA4 is built around sessions, so visit and conversion counts are easy, while putting revenue efficiency by channel and by new-vs-repeat on one screen means gathering ad spend and customer figures elsewhere and rebuilding them. Splitting new from repeat to line up "which one sells how efficiently" every month is, structurally, a manual reassembly.
RevenueScope's solution
Let us see how "after computing CAC, decide your next move by revenue efficiency after acquisition" actually looks. RevenueScope consolidates per-channel revenue efficiency into one view, from GA4 and your site's revenue data. It shows four metrics: Revenue / AOV (average order value) / RPS (revenue per session) / CVR (conversion rate). And you can view the same numbers split by new and repeat customers.
| Channel | RPS (revenue/session) | AOV | CVR |
|---|---|---|---|
| Google Search | ¥120 | ¥4,800 | 2.5% |
| Meta retargeting | ¥70 | ¥3,900 | 1.8% |
| Meta prospecting | ¥18 | ¥4,500 | 0.4% |
| Customer type | RPS (revenue/session) | AOV | CVR |
|---|---|---|---|
| New | ¥35 | ¥4,200 | 0.9% |
| Repeat | ¥140 | ¥5,600 | 3.4% |
(Illustrative of how it looks per channel and by new-vs-repeat in RevenueScope. Figures are demo data for an apparel store.)
The per-channel table shows Meta prospecting lowest at RPS ¥18, and Google Search most efficient at RPS ¥120. Steer budget by cheap acquisition alone and money flows to channels that don't sell.
The new-vs-repeat table is a clue to what sits before LTV. Repeat customers run RPS ¥140 / AOV ¥5,600 / CVR 3.4% — roughly four times the revenue efficiency of new customers (RPS ¥35). A channel that produces loyal repeat buyers can pay back even a higher initial CAC over time. Even without a confirmed LTV figure, you can size up "is this channel likely to keep selling for the long term" from the revenue-efficiency gap between new and repeat.
Let us draw the boundary clearly. RevenueScope does not output the confirmed values of CAC, LTV, gross margin, or payback period themselves. Cost, labor, and customer counts are accounting and CRM numbers, and they belong to a domain that needs unit cost and long-term per-customer tracking. What RevenueScope outputs is not the cost side but the revenue side — "how much revenue, and at what efficiency, you generated after acquisition," as RPS / AOV / CVR / Sessions by channel and by new-vs-repeat. Compute CAC from accounting data, and use RevenueScope to compare the revenue efficiency that follows.
The next move this points to is clear: send budget to channels with high repeat revenue efficiency even if CAC is a bit higher, and pause on channels that only win new visitors with low RPS. The "post-acquisition efficiency" that CAC alone can't show fills in the last piece of the decision.
FAQ#
Q. Should CAC include labor costs?
Ideally, yes. Including the labor for ad operations and content creation gets you a CAC closer to reality. If monthly tracking is hard, start with ad spend plus tool costs, and add labor once you're used to it.
Q. Should I look at CAC or CPA?
Use them for different purposes. CPA suits improving ad creative and bids; CAC suits deciding whether to grow or shrink overall ad investment. Ideally, watch both.
Q. Does the CAC mindset change for new vs. repeat customers?
It does. Repeat customers generate revenue without an added acquisition cost, so CAC is mainly "how much it cost to win new customers." On top of that, looking at the revenue-efficiency gap (RPS, AOV) between new and repeat helps you size up "is this channel likely to keep selling and pay back." Confirmed LTV belongs to the accounting side, but the efficiency gap before it is visible from revenue data.
Q. Can RevenueScope output CAC or LTV?
No. The confirmed values of CAC, LTV, gross margin, and payback period need cost, accounting, and CRM data, and RevenueScope does not measure them. What RevenueScope outputs is the revenue-side efficiency before that — RPS / AOV / CVR by channel and by new-vs-repeat. Compute CAC from accounting data, and use RevenueScope to compare which channel sells efficiently after acquisition.
Summary#
CAC is the total cost of winning one new customer. Include not just ad spend but labor and tool costs, and it gets closer to reality. But CAC can't be judged on its own. Reading it against LTV at a 3:1 benchmark, and setting your tolerance from your own gross margin and repeat rate rather than the industry label — these are the foundation.
And the easily missed piece is the "revenue efficiency after acquisition." At the same CAC, a one-and-done inflow and a loyal one have different value. Line up RPS and AOV by channel and by new-vs-repeat, and even without a confirmed LTV you can size up "is this channel likely to pay back." Start by computing your CAC for the past month, then line up the revenue efficiency that follows.
See which ads actually drive revenue, at a glance
Free up to 5,000 sessions/month, AI connection included. No credit card required. Up and running in 5 minutes.
References#
- [1] Shopify "Customer Lifetime Value (CLV): What It Is and How to Calculate" (2024)
- [2] HubSpot "Customer Lifetime Value (CLV): How to Calculate & Improve It" (2024)
- [3] Ministry of Economy, Trade and Industry (METI) "FY2024 Survey on Electronic Commerce" (2025)
- [4] Dentsu "2024 Advertising Expenditures in Japan" (2025)