
The first stumble in website improvement is that there are too many places to fix, and you can't decide "where to start." Product pages, checkout, shipping, SEO, ads—line them up as they come to mind, and each looks about as important as the next, so nothing moves. The short version: instead of trying to do it all at once, narrow to just three for this week, starting with what moves revenue most.
What matters is not picking those three by "whatever caught my eye." The problem that stands out and the problem that moves revenue are, in fact, different things. This article works through, in order: how to read your site's current position in numbers, how to set priority by revenue impact, and how to pick and run this week's three. Finally, it shows how to let AI pick those three for you.
Contents
This article in brief#
- The real reason website improvement stalls isn't that there's too much to do—it's that your site's "current position" isn't visible in numbers. First, use four figures (visits, RPS, CVR, bounce rate) to find where you're weak
- Set priority not by "what caught your eye" or "what's easiest," but by "what moves revenue most." The problem that stands out and the problem that moves revenue are different things
- Narrow to the top three, and this week do only those. Look at your current position again each week and re-pick the next three—that's the surest way to keep moving forward
1. Why "where to start" stops you#
The short version: the real reason you stall isn't that there's too much to do—it's that your site's "current position" isn't visible in numbers.
Ideas for improvement are endless if you look. Swap the product photos, add payment options, revisit shipping, write articles, run ads—each one looks "probably worth doing." But when you can't tell where your site is leaking right now, every idea looks the same size, and you can't choose. So, before lining up ideas, first check your current position.
Your current position comes into view with just four figures: visits (how many people come), RPS (revenue per session), CVR (the share of visitors who buy), and bounce rate (the share who leave right after arriving). Line these four up and you can see at a glance whether "traffic is short," "people come but don't buy," or "people arrive and leave at once."
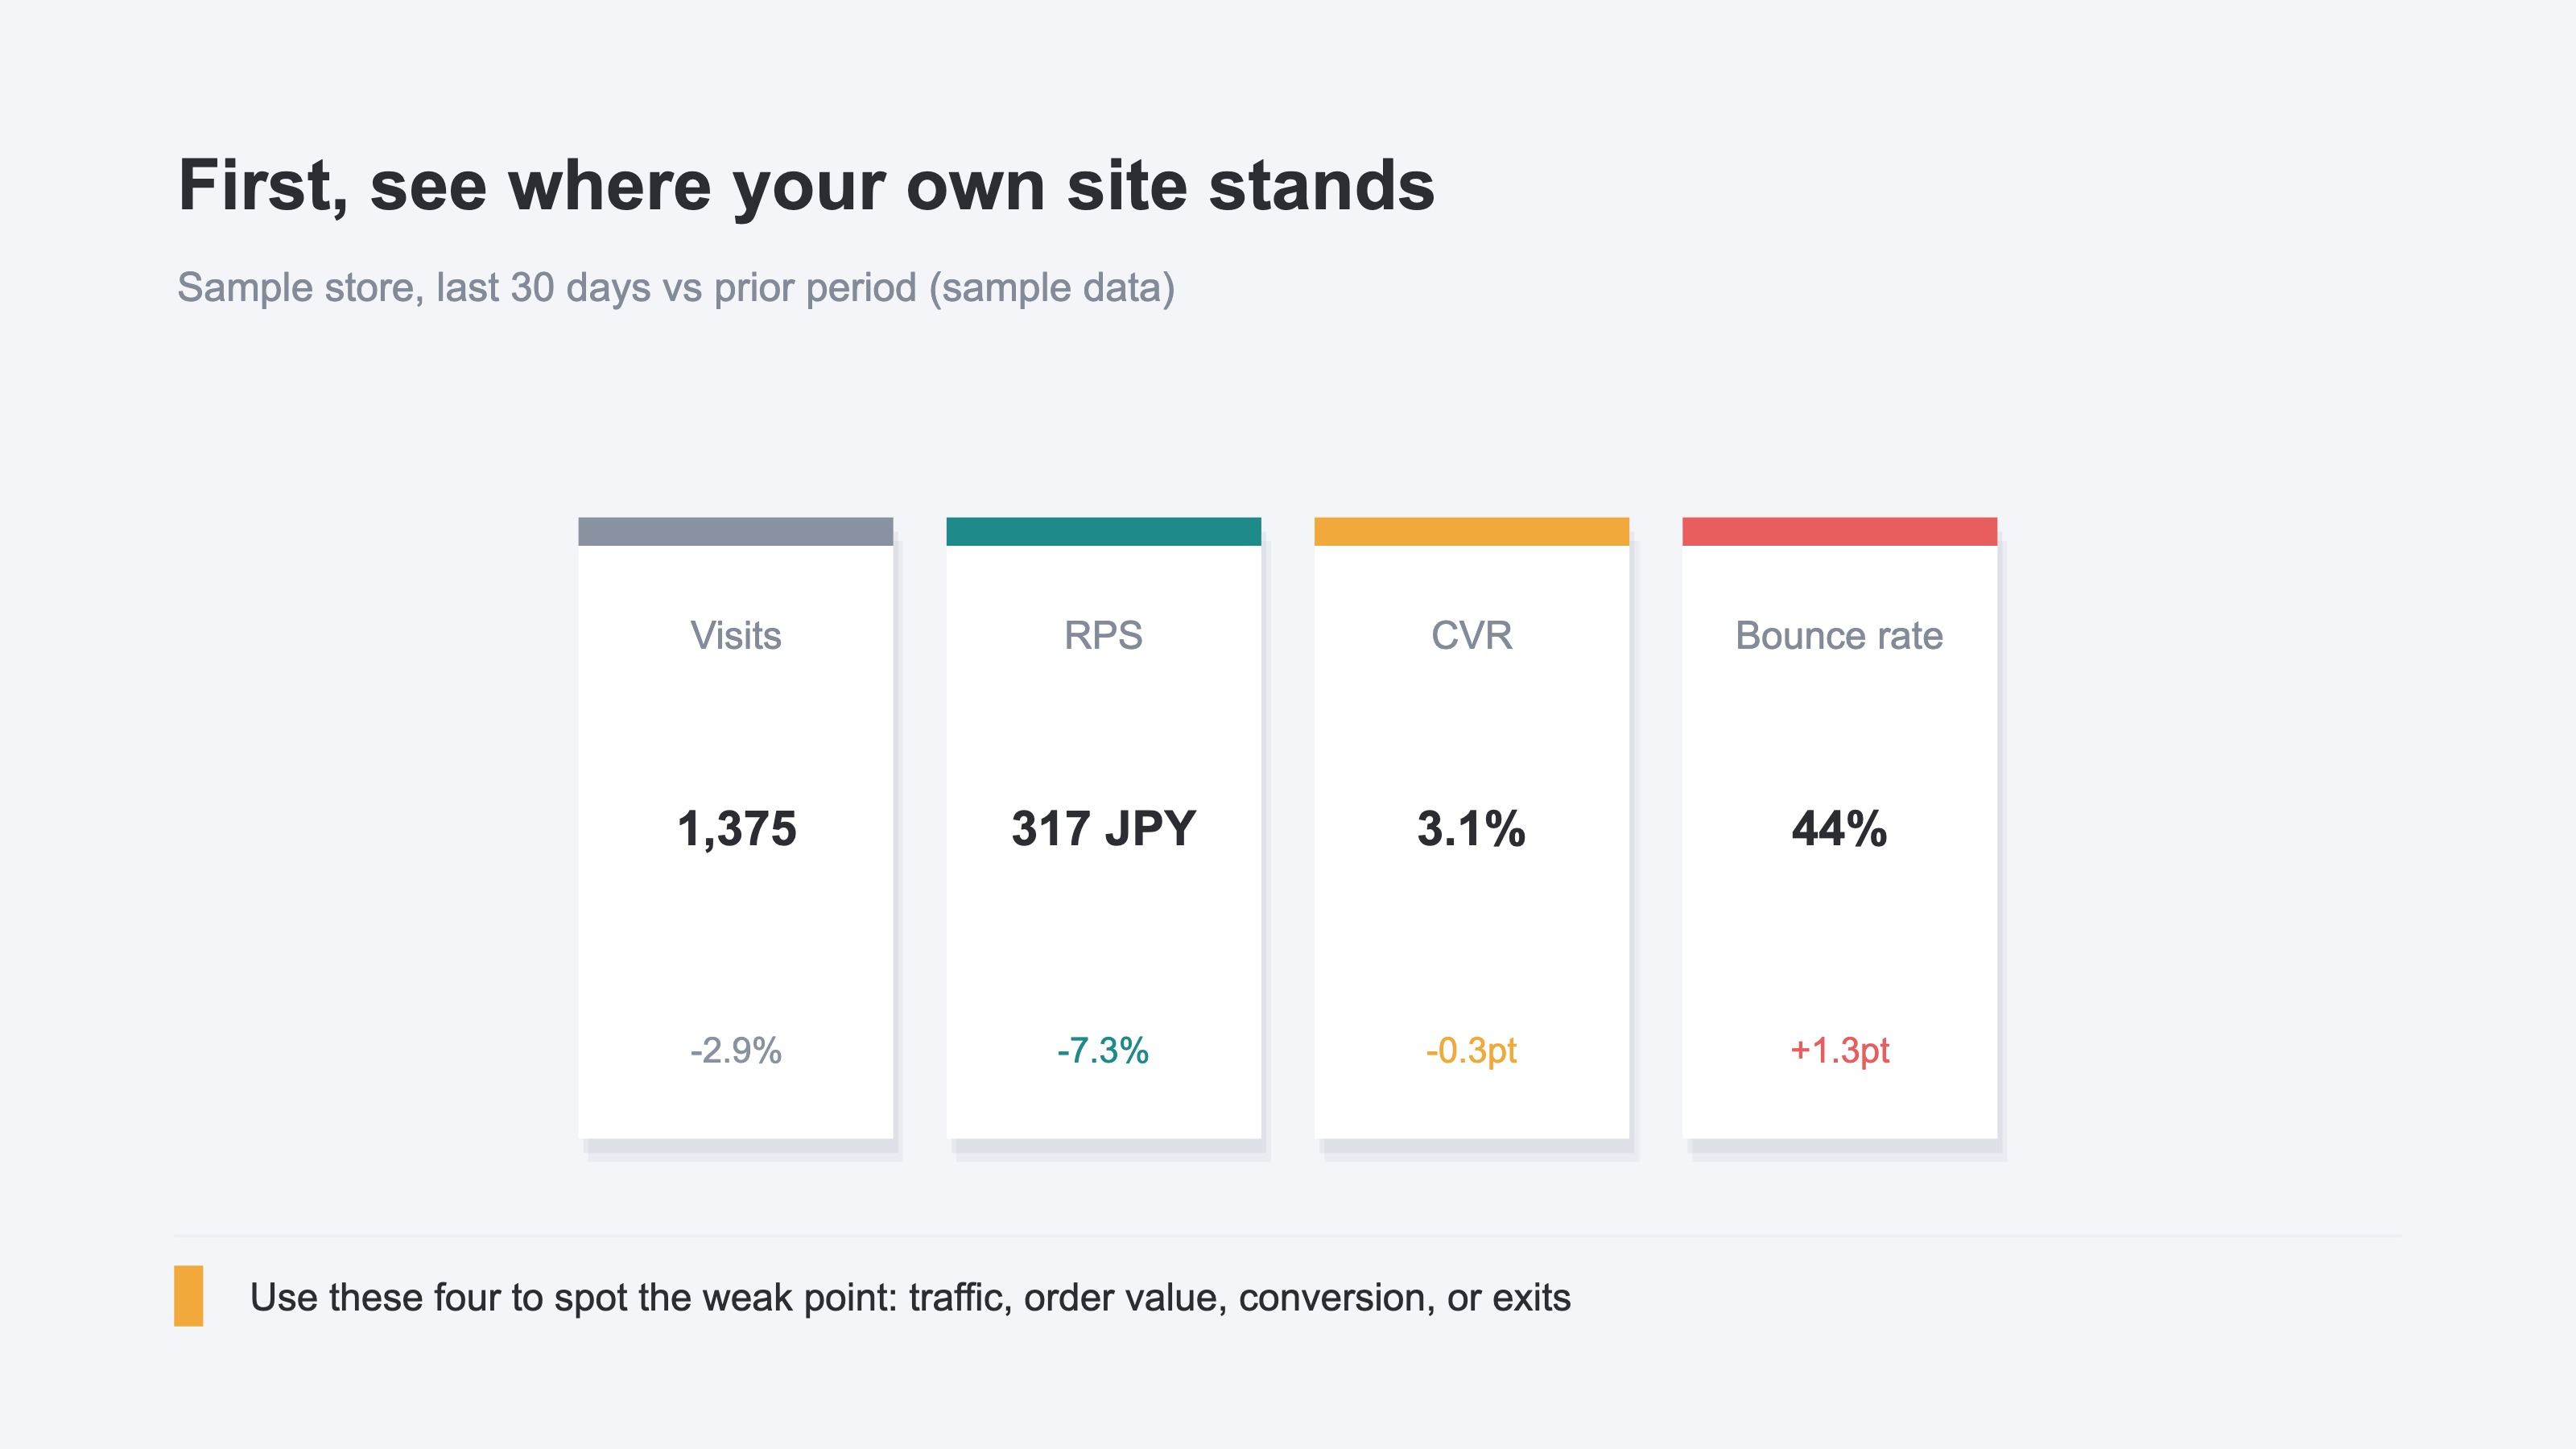
You can see these four in GA4 too. But gathering the numbers across several screens each time, comparing them to last month, and translating that into "where I'm weak" is heavier than it looks. Reading your current position in numbers isn't hard in itself—the burden is repeating it every week. Start by using these four to see where your site is weak (Why traffic grew but revenue didn't / The five KPIs to check first in ecommerce).
2. Set priority by revenue impact#
The short version: set priority not by "what caught your eye" or "what's easiest," but by "what moves revenue most."
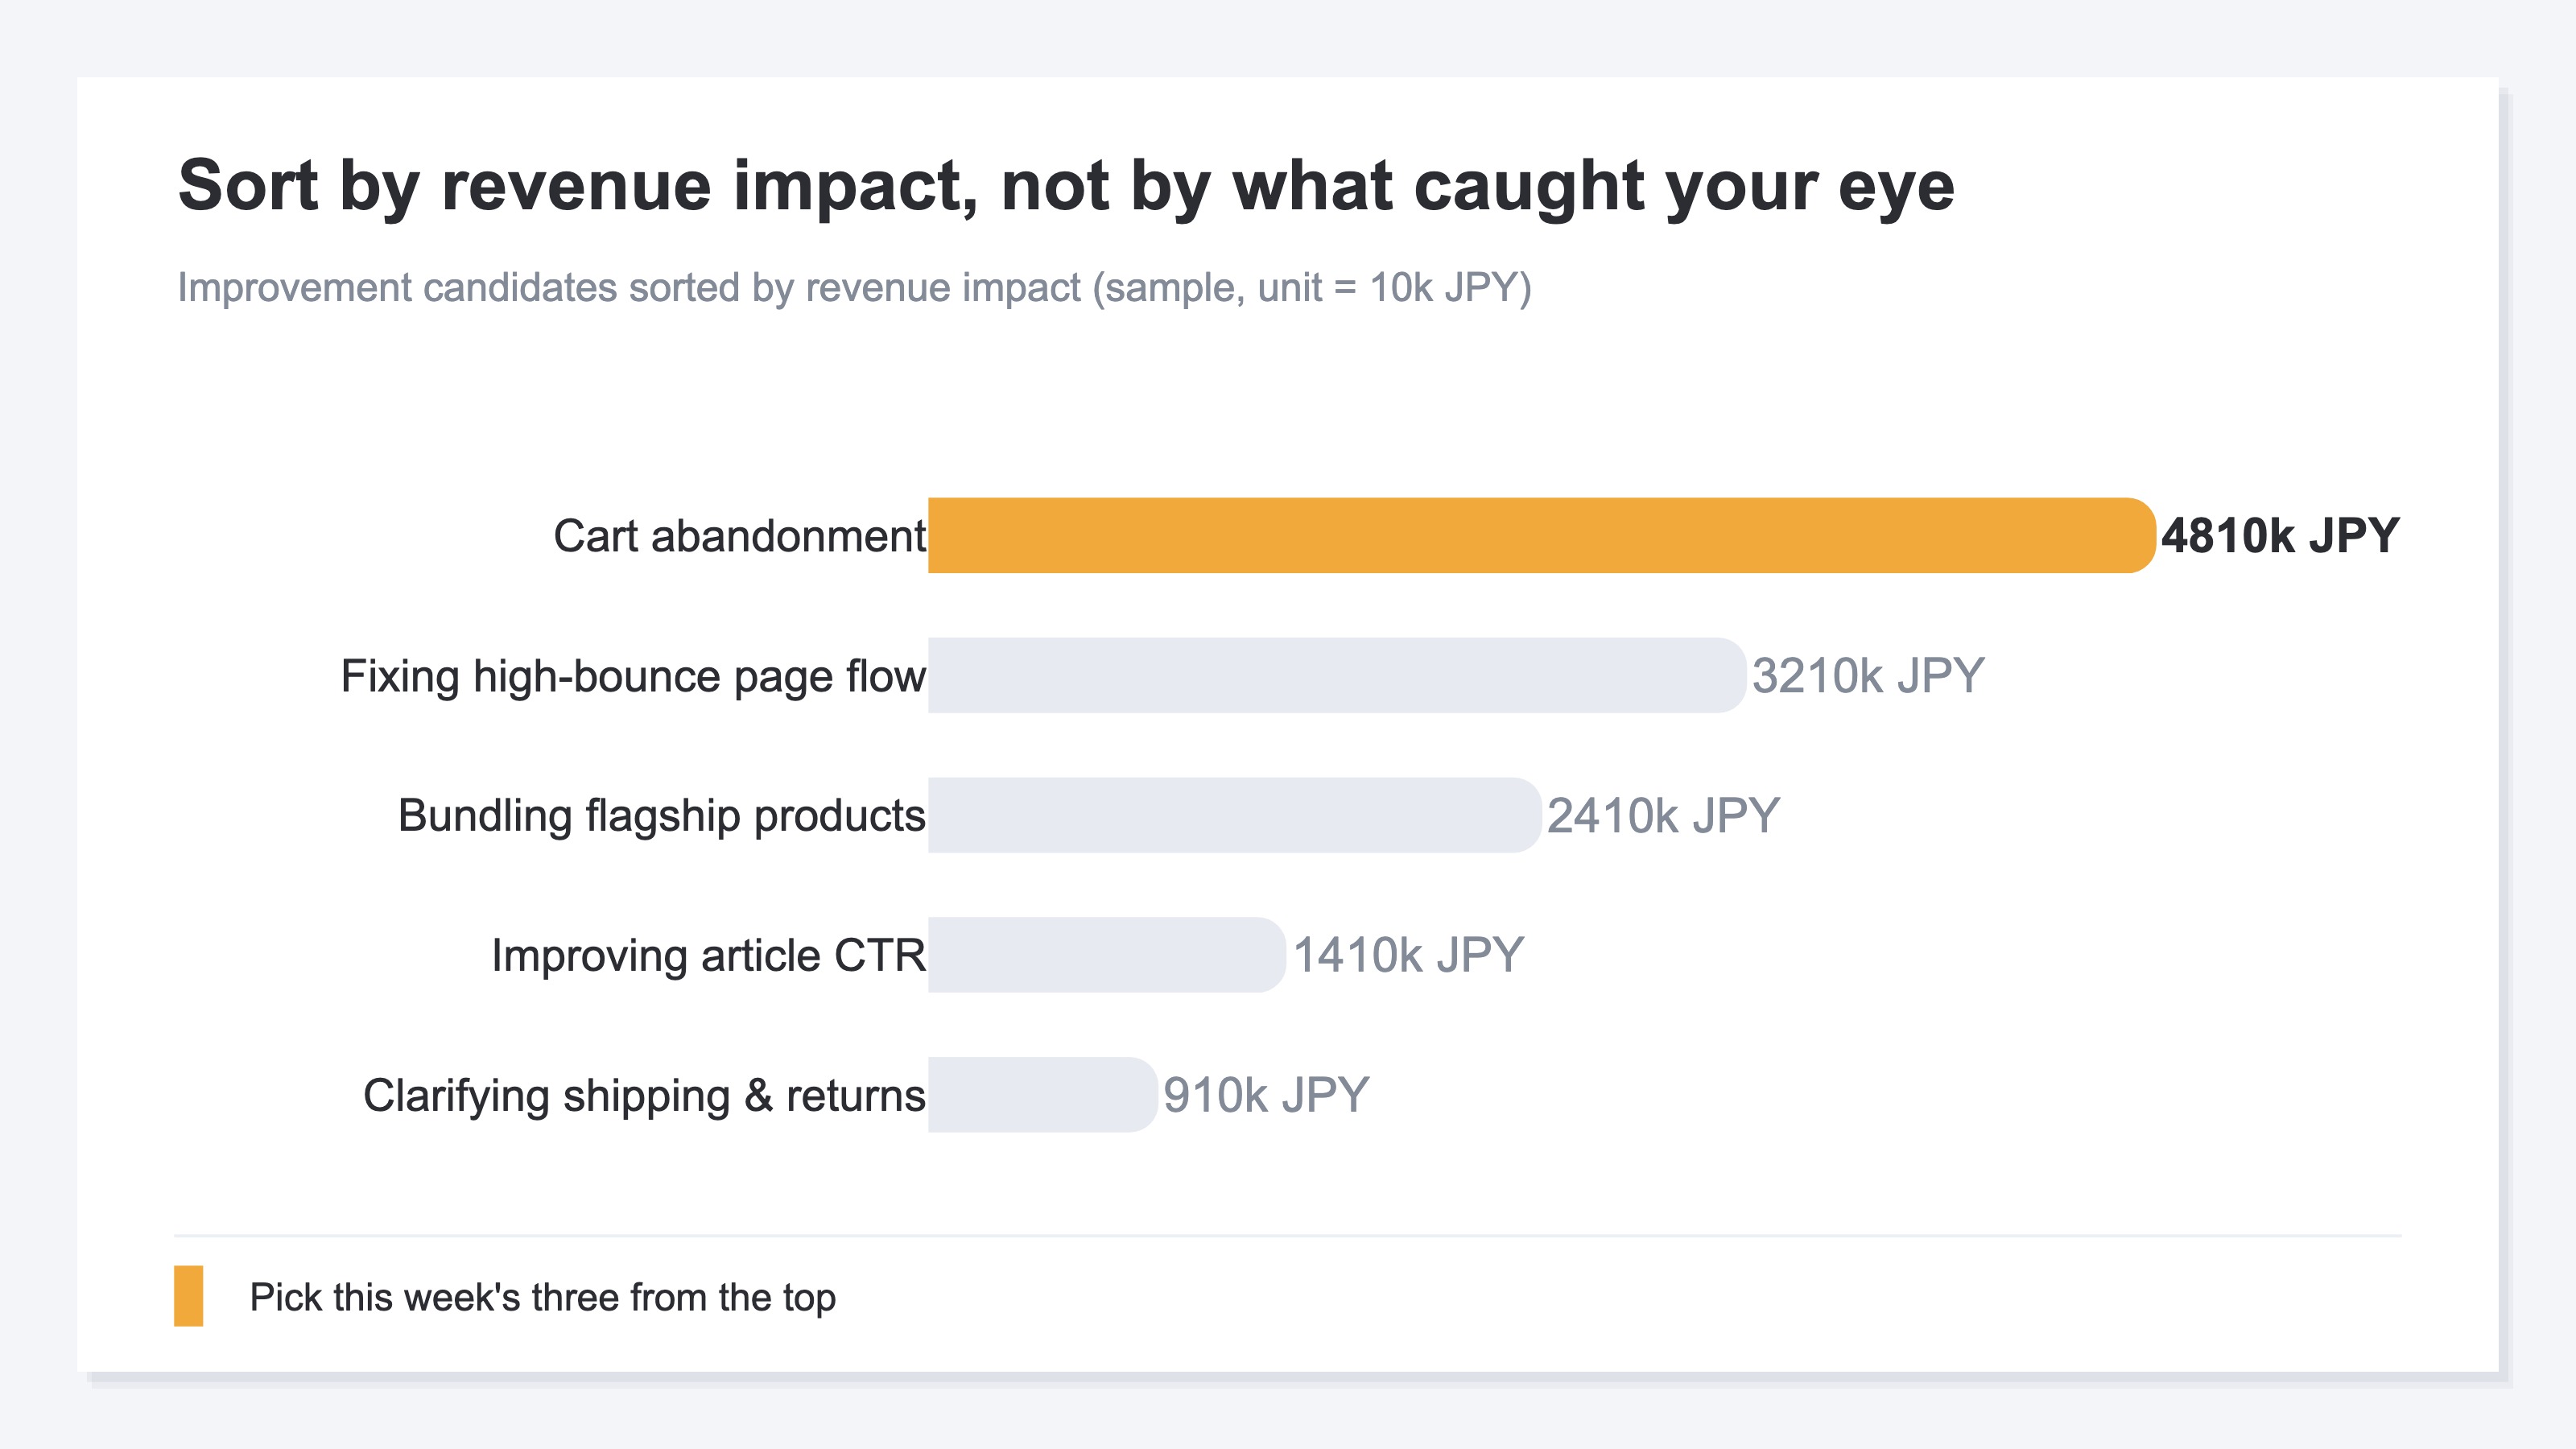
Once candidates are lined up, compare each by "how much revenue would move if I fixed it." Do this by feel and you get pulled toward the problem that looks bad or the one that happened to catch your eye. But the problem that stands out and the problem that moves revenue are different things. For example, cutting cart abandonment (people adding to cart but leaving without buying) by a tenth can move revenue far more than changing your homepage color.
The knack for reading revenue impact is to think about where the fix acts among "people, price, and conversion." Revenue is the product of how many people come, the price per person, and the share who buy (conversion). So fixing the spot that is weakest and reaches the most people moves revenue the most. You do weigh the effort involved, but reordering by revenue impact comes first (if revenue has dropped suddenly, see KPI diagnosis when revenue drops suddenly; if you want to fix from the traffic side, see The order to fix when you have impressions but no clicks).
3. How to pick and run this week's three#
The short version: narrow to the top three, and this week do only those. The more you line up, the more each one stalls halfway.
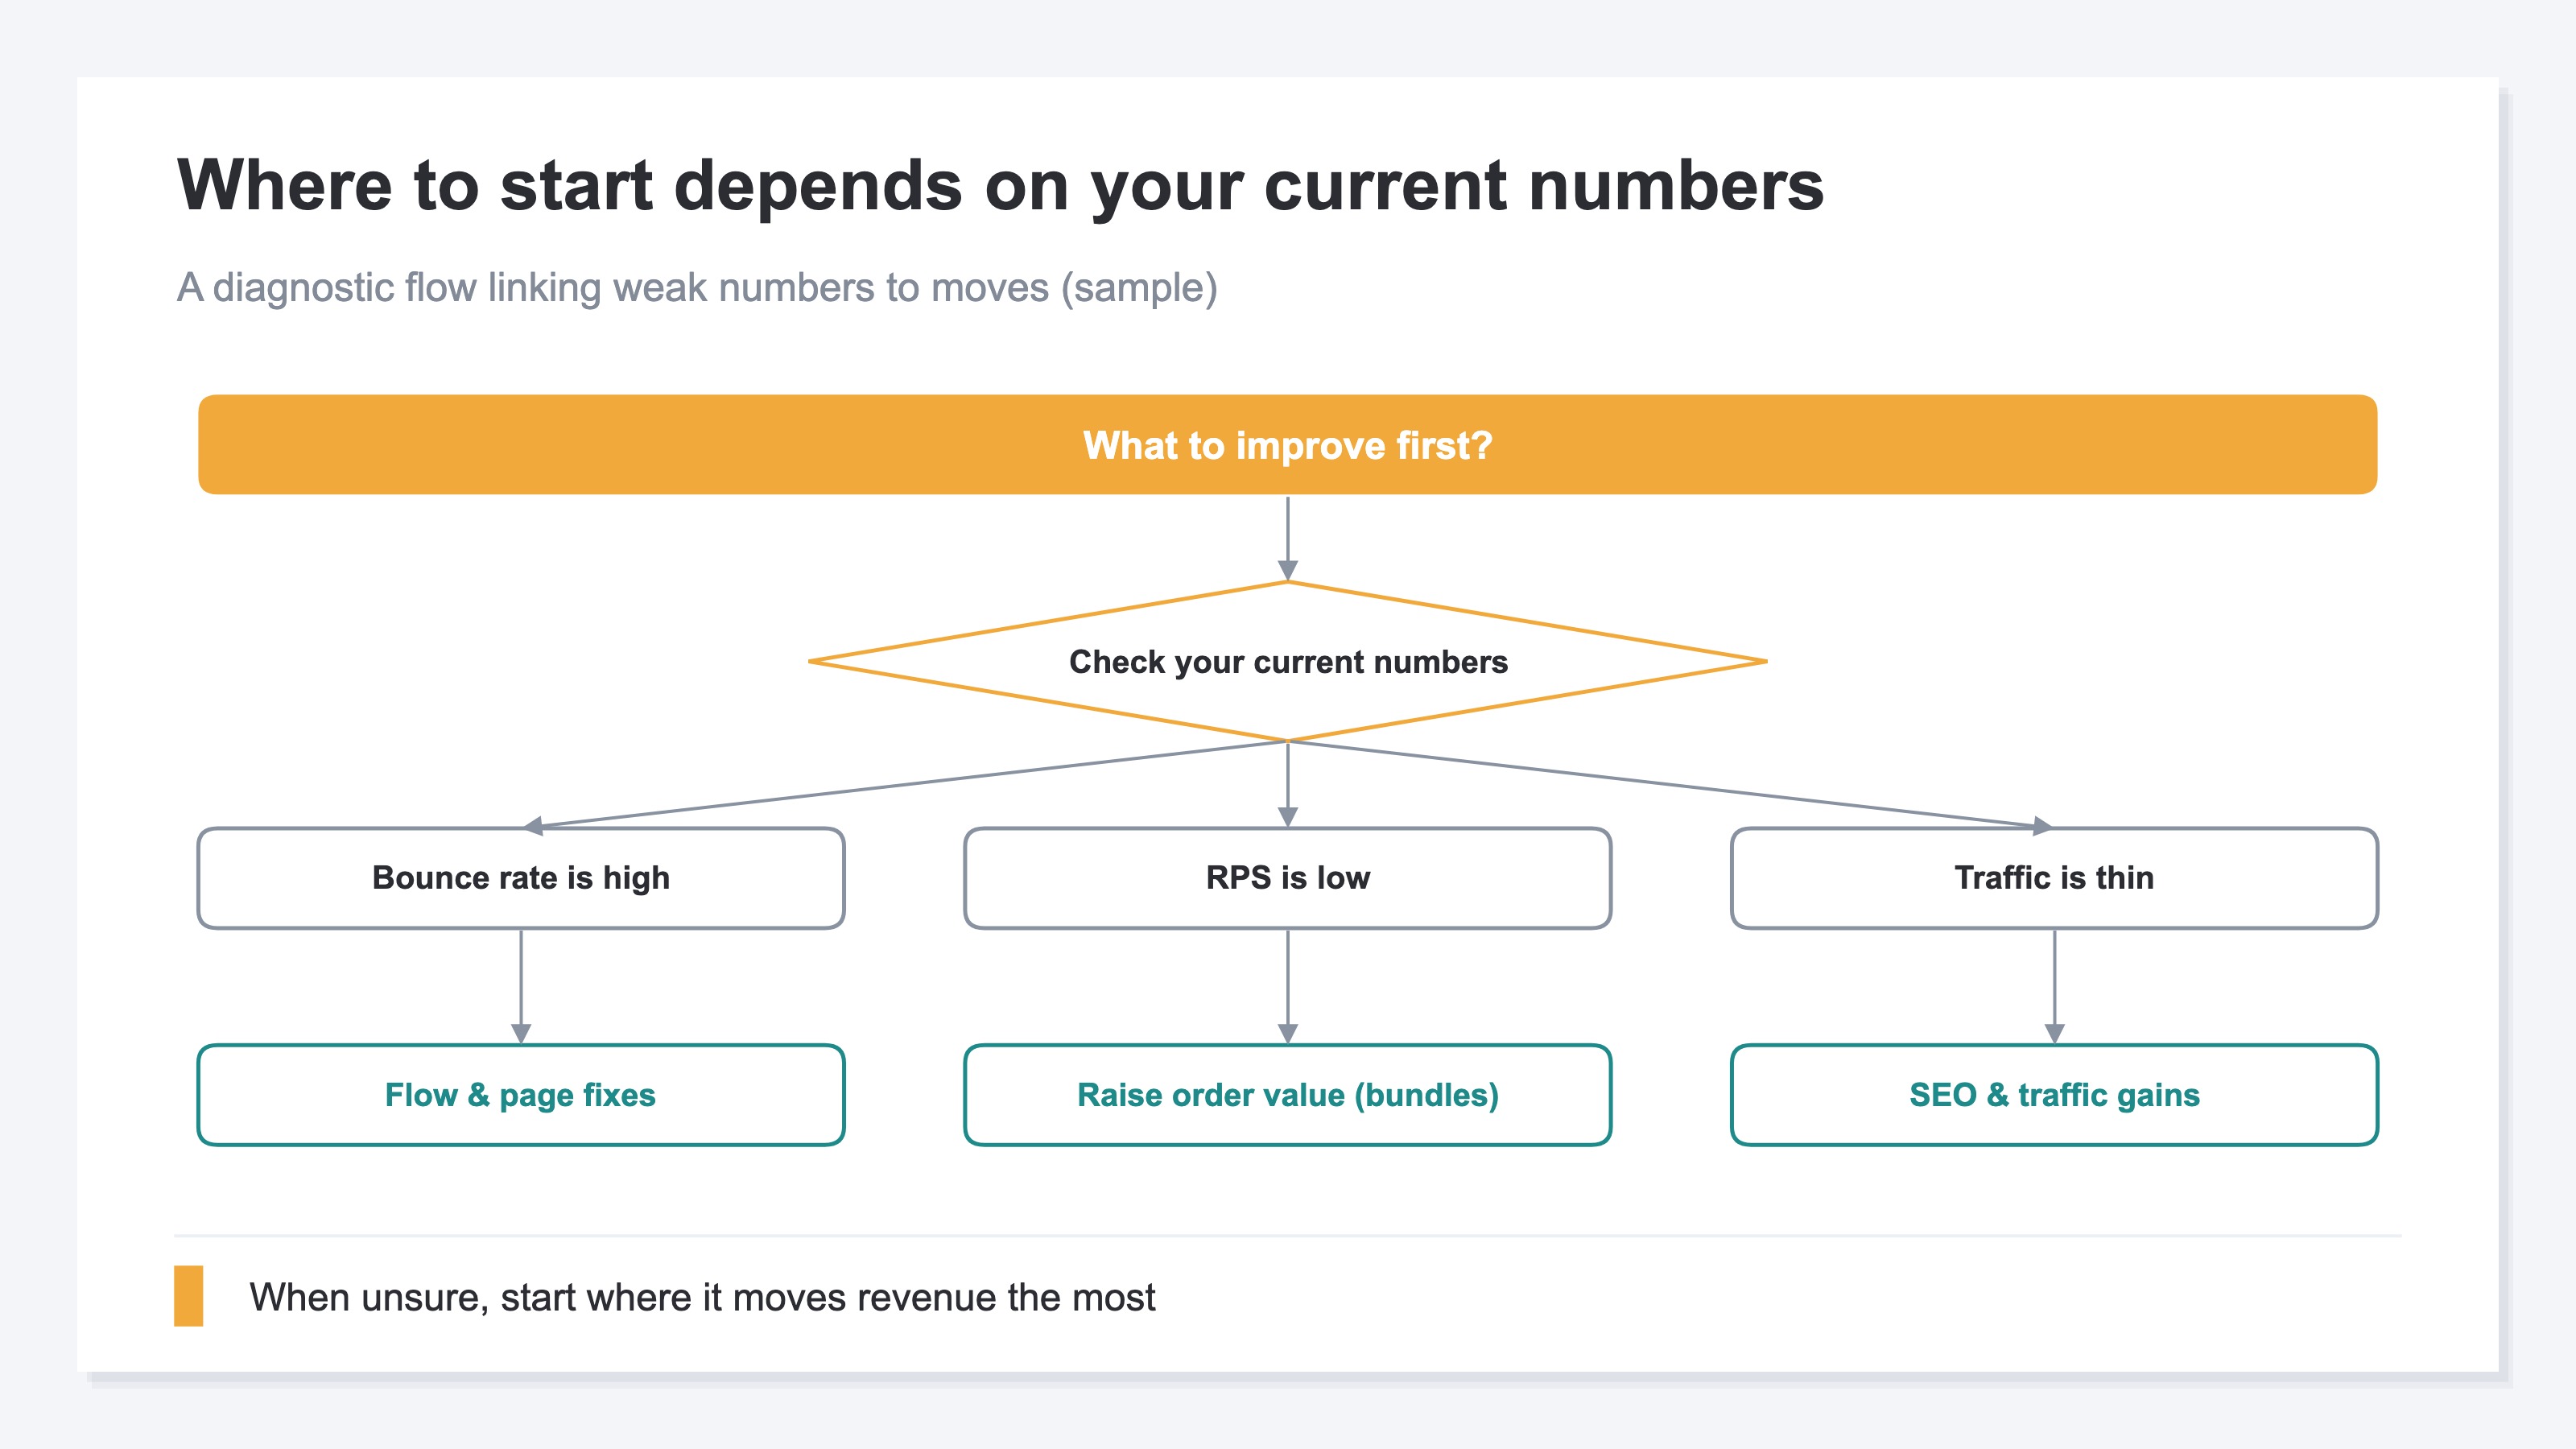
You can decide the picks with one pattern: look at your current position in numbers, and start where you're weak. High bounce rate means people leave right after arriving, so fix the flow and the content of the page. Low RPS means people come but the amount per person isn't growing, so raise the average order value with bundles or a free-shipping threshold. Thin traffic means there simply aren't enough people, so grow entry points with SEO. This is how you tie a weak number to a move.
The reason to narrow to three is simple. Line up five or ten and each advances only a little, so a week passes with nothing finished. So split them to a size you can finish in a week, and complete just the top three. Then, next week, look at your current position again and re-pick the next three. This repetition is the surest way to move forward.
This pattern—"look at your current position, and pick three in order of revenue impact"—you can actually do yourself. But gathering the numbers from several screens each week, comparing to last week, and re-ranking by how much each move affects revenue is structurally heavy work. The thinking is simple; the effort is in repeating it every week.
RevenueScope solution
Try to run this whole flow every week and you always hit the same wall: gathering the current-position numbers from several screens, comparing to last week, and reordering the moves by revenue impact—doing that by hand, every week, is heavy. GA4 shows the numbers themselves, but producing "the three to do this week" in order of revenue impact, week after week, is structurally taxing.
RevenueScope is a tool that takes on this heavy repetition. First, it lays out your current-position numbers (visits, RPS, CVR, bounce rate) with period-over-period change on one screen. On top of that, it returns "what to do this week," in order of revenue impact, up to three. And this ranking is produced mechanically, by a fixed rule. It isn't an AI writing prose—it's derived by a fixed rule from period-over-period KPI shifts and per-channel efficiency.
Ask RS, and this is what comes back (figures shown are demo data).
| Rank | Read | This week's priority | Move |
|---|---|---|---|
| 1 | Upside | AI-assistant traffic is rising (220 sessions, +100% vs. prior period) | Identify the articles being cited and strengthen related topics |
| 2 | Upside | "Direct" is high-efficiency (RPS 569 yen, 1.8× the site average) but only 18% of traffic | Consider whether you can grow the high-efficiency "Direct" channel |
What came back here is two, not three. RevenueScope returns only "what actually matters," by a fixed rule, and does not pad to three to fill a quota. So "this week's three" isn't always three—if there are two worth doing, it says two. Here, two upsides surface in order of revenue impact: AI-driven traffic that has doubled, and a "Direct" channel that is efficient yet small in volume.
Let me draw the line honestly. What RevenueScope returns is not an answer that guarantees results. It is a "starting draft" ranked by revenue impact—it does not factor in how easy a move is to execute (how strong the competition is, or how hard the work is). This feature also doesn't support filtering by country or device. So the final call on "which to do" is yours. What RevenueScope does is take on, all at once, the weekly-heavy work of "looking at your current position and lining up candidates by revenue impact," so you can choose without hesitation. You can also see how the actual screen looks in the product demo.
FAQ#
Frequently asked questions#
Q. Where should I start with website improvement?
A. First, look at your site's current position in numbers. Visits, RPS, CVR, and bounce rate—these four show which is weak: "traffic is short," "people come but don't buy," or "people leave right after arriving." Then start where you're weakest and it moves revenue. Don't try to do it all at once; narrow to three for this week.
Q. How exactly do I set priority by "revenue impact"?
A. Compare each candidate move by "how much revenue would move if I fixed it." Revenue is the product of how many people come, the price per person, and the share who buy (conversion). So think about which bottleneck—people, price, or conversion—the move acts on, and the size of the effect comes into view. Reorder by this revenue impact, not by what stands out.
Q. Can I fully hand off picking this week's three to AI?
A. No, you can't fully hand it off. RS's priority-action feature returns a "starting draft" ranked by revenue impact—it doesn't guarantee results or run the moves for you. It doesn't factor in how strong the competition is or how hard the work is, and it doesn't support filtering by country or device. The final call on "which to do" is always yours.
Conclusion#
Website improvement stalls not because there's too much to do, but because your site's current position isn't visible in numbers. First, use four figures—visits, RPS, CVR, bounce rate—to check where you're weak.
On top of that, set priority not by "what caught your eye" or "what's easiest," but by "what moves revenue most." The problem that stands out and the problem that moves revenue are different things. Narrow to the top three and, this week, do only those. Next week, look at your current position again and re-pick the next three. This repetition is the surest way to move forward.
Running this flow by hand every week is heavier than it looks. Lining up your current position in numbers and producing this week's priorities in order of revenue impact—that part you can leave to a tool. With the time freed up, focus on "which to do" and "how to fix it," the judgment only a person can make. Start by looking at those four current-position numbers.
See which ads actually drive revenue, at a glance
Free up to 5,000 sessions/month, AI analyst included. No credit card required. Up and running in 5 minutes.