
We often say "let's grow returning customers." But for your own shop, how much revenue do new and returning customers each generate—could you answer that off the top of your head with a number? In most cases, people watch total revenue but never split it into new and returning.
Yet split it, and the picture changes. New and returning differ quite a bit in the share who buy (conversion rate, CVR), the amount per order (average order value, AOV), and revenue per session (RPS). Returning customers almost always sell more efficiently, and that gap is invisible if you only look at a blended average. What makes it trickier is a measurement trap: the "new" number is easily inflated. This article walks through, in order, how to measure revenue split by new vs returning, how AOV differs between them, and why new gets inflated.
Table of contents
This article in brief#
- New and returning differ in conversion rate (CVR), order value (AOV), and revenue per session (RPS). In most cases, returning customers sell more efficiently
- Look only at a blended average and you miss this gap. So measuring "how much returning customers earn" separately becomes the material for your next move
- But the "new" number is easily inflated—when a cookie disappears, the same returning customer gets recounted as new
1. New and returning differ in what makes up revenue#
In short, new and returning customers generate very different revenue from the same single visit.
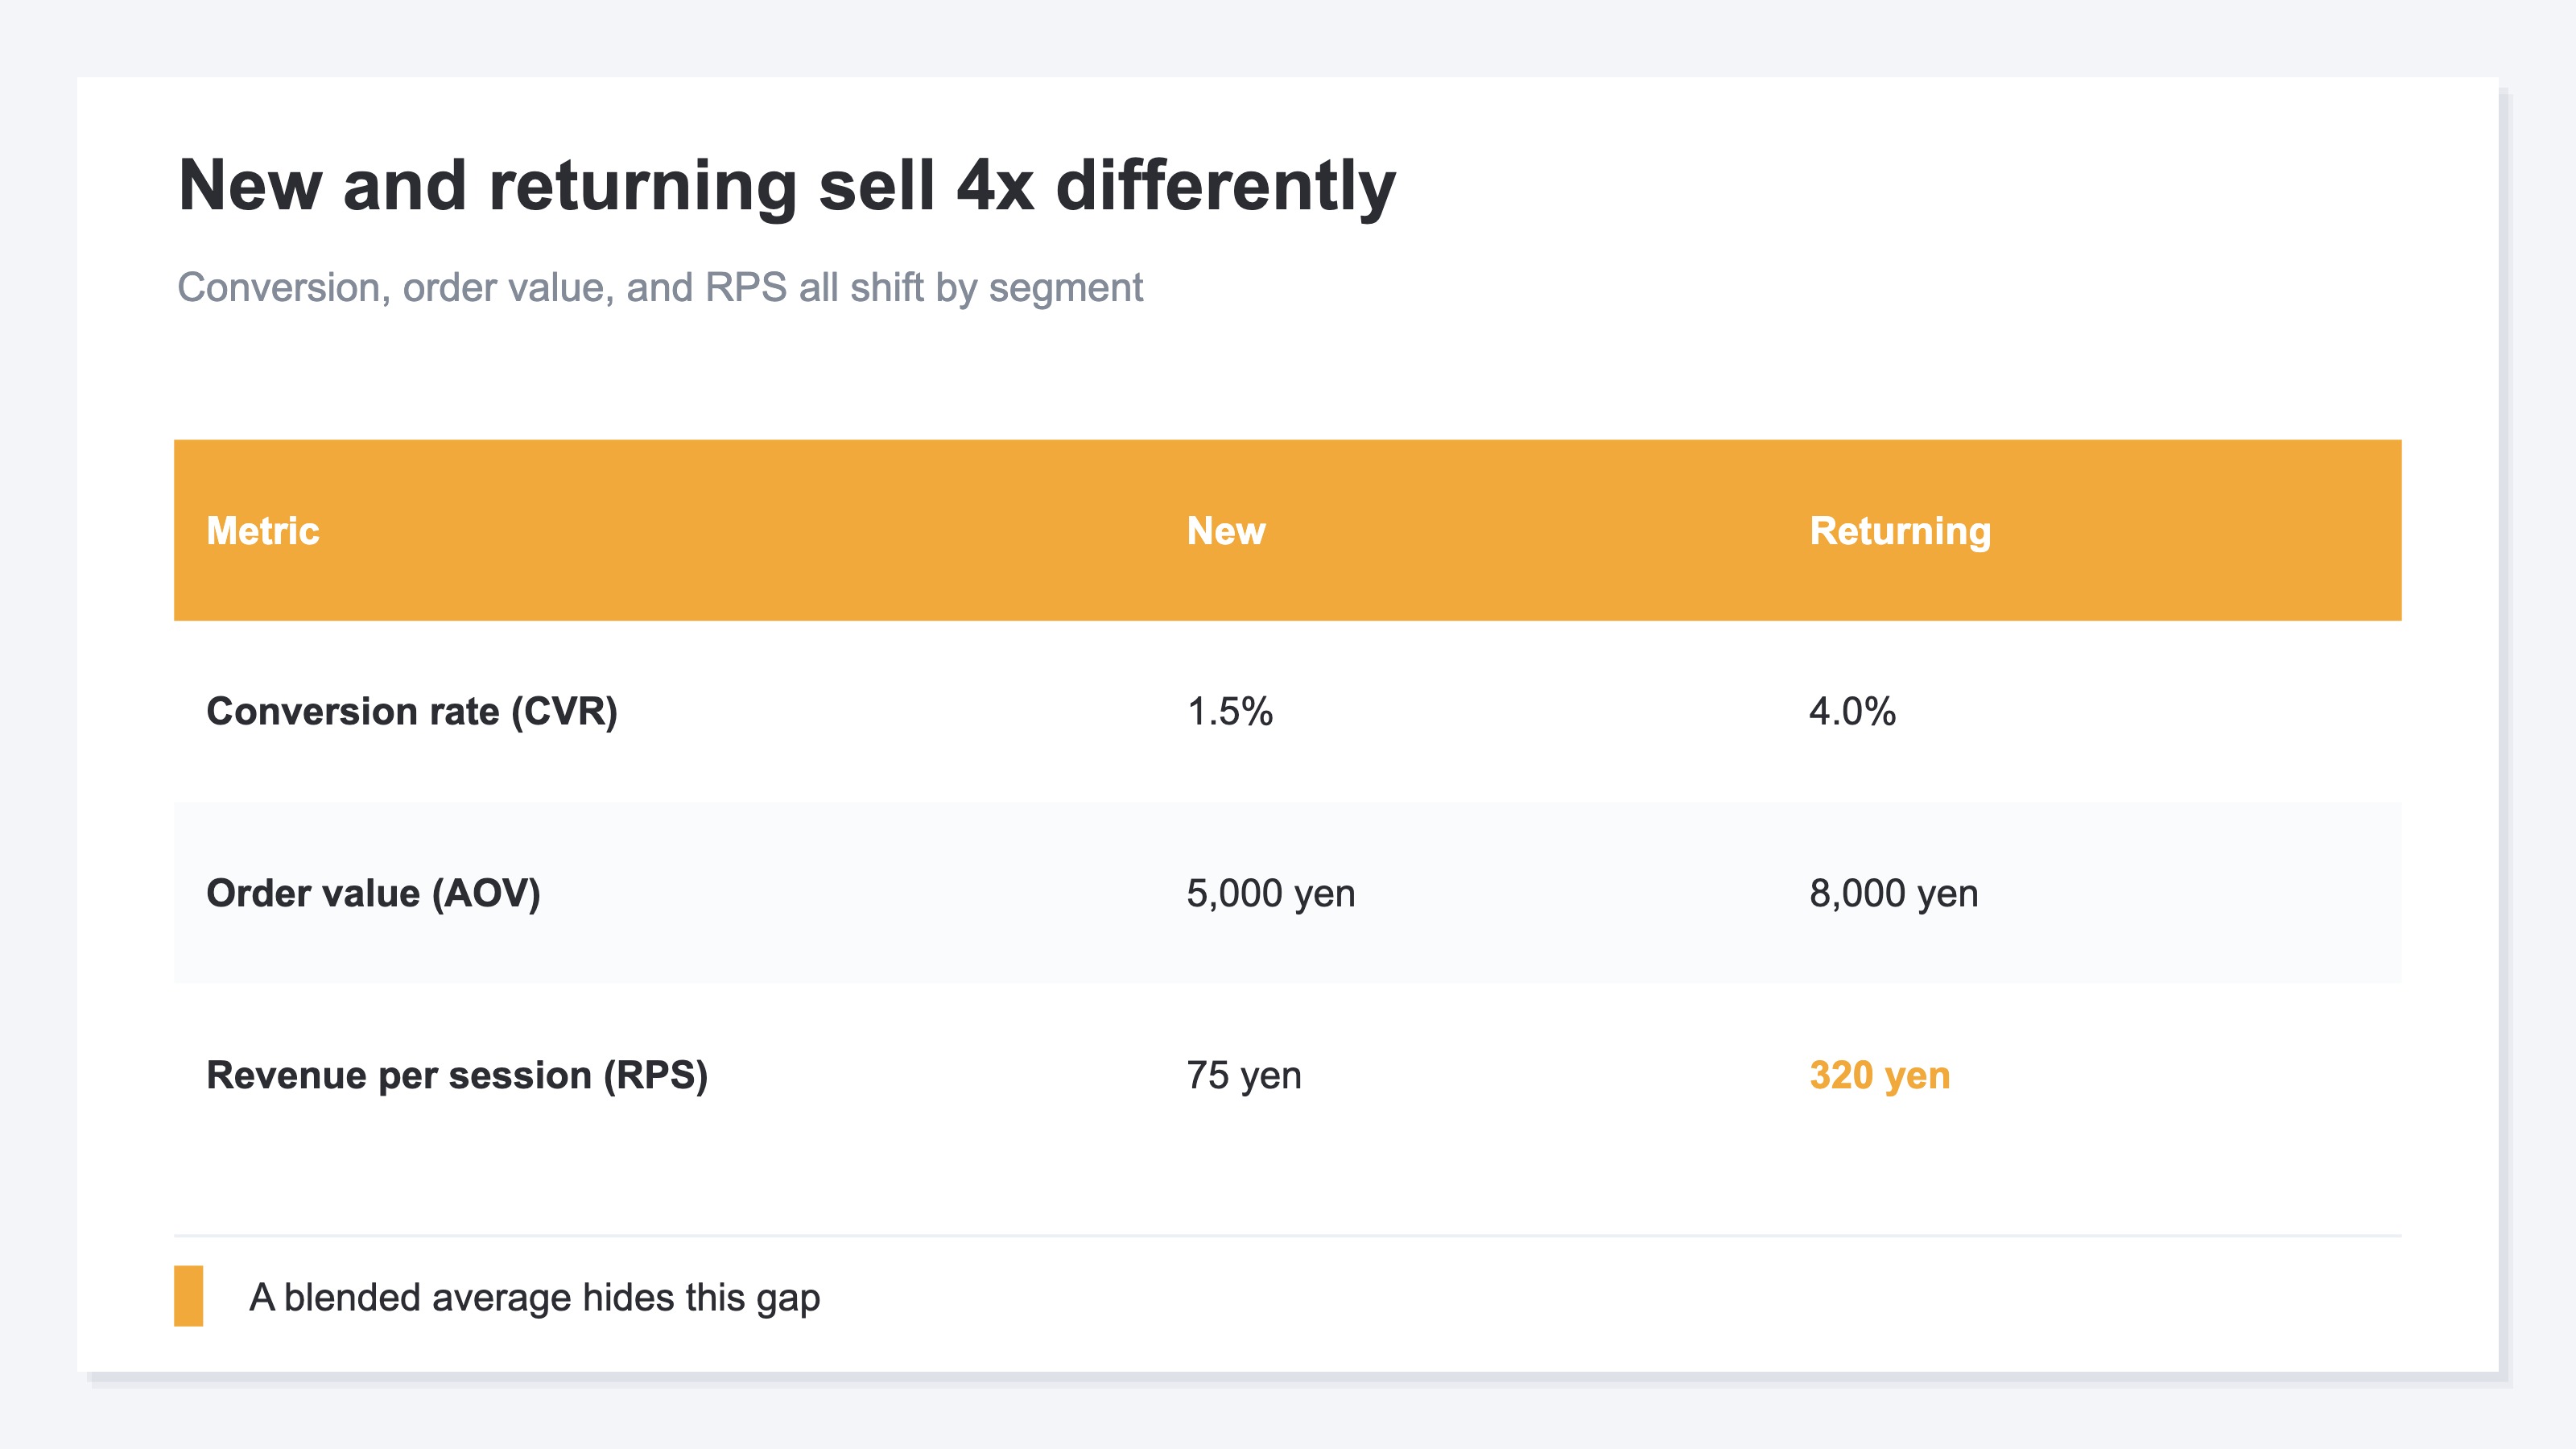
Returning customers are people who already know your shop and were happy enough to buy once. So the share who buy (conversion rate, CVR) is high, and they more readily choose bulk orders or higher-priced items, which lifts order value (AOV) too. AOV stands for Average Order Value—the average amount per purchase. New visitors, by contrast, have only just learned about your shop; many are still in a wait-and-see mode, so both conversion rate and order value tend to come out lower.
Put it in numbers and the gap is plain. For example, new customers have a 1.5% conversion rate and ¥5,000 order value, so revenue per session (RPS) is ¥75. Returning customers have a 4.0% conversion rate and ¥8,000 order value, so RPS is ¥320. Returning customers sell more than 4x as efficiently as new. Yet if you blend total revenue into something like "average RPS ¥136," that 4x gap is completely invisible. Only by splitting new from returning do you start to see, in numbers, "how much returning customers earn" and "how much room there is to grow new customers."
2. The "new" number is easily inflated#
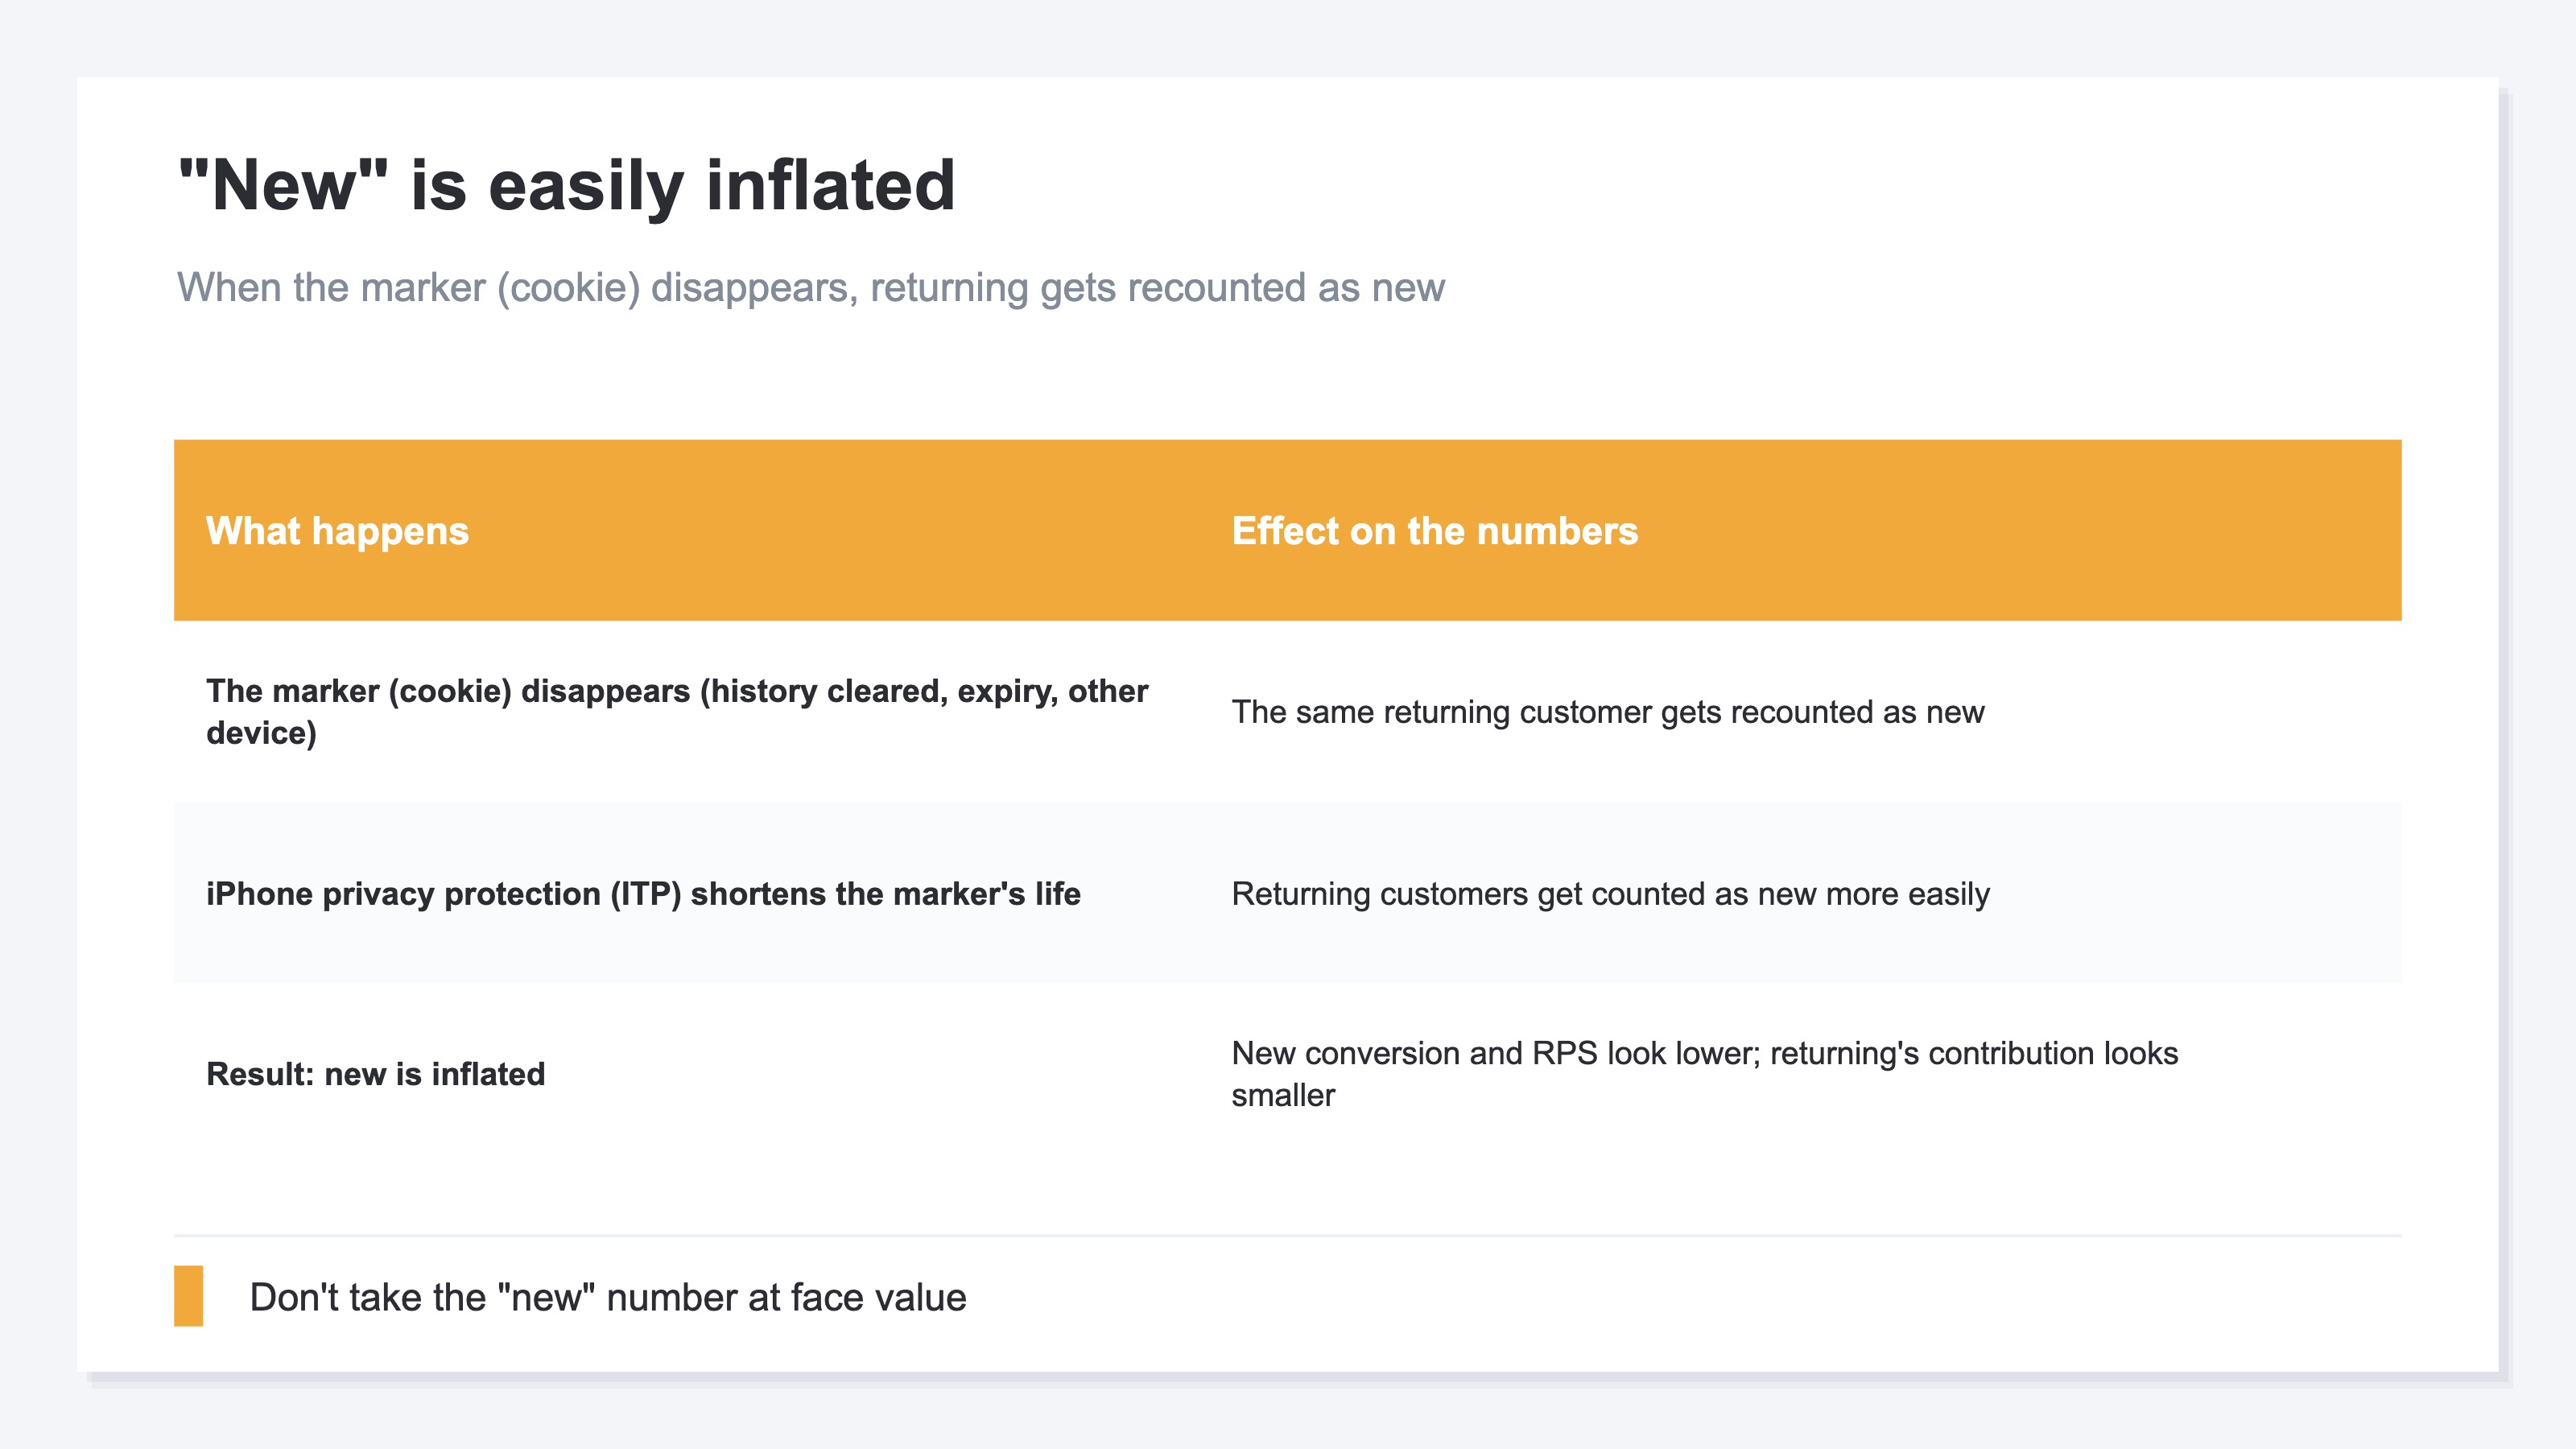
In short, the "new" count in analytics tends to be counted higher than it really is. So you can't take the new number at face value.
Why does it get inflated? Most analytics tools leave a small marker (a cookie) in the visitor's browser, and the next time they come back, if the same marker is there they're judged "returning," and if not, "new." But this marker is easily lost. If a user clears their history, the marker expires, or they come from a different device (phone vs PC), the marker isn't carried over. Then someone who is actually a returning customer—but whose marker can't be found—gets recounted as "new." In particular, with privacy protection like iPhone's ITP, the marker's lifespan can be cut to as little as a few days, making it easier for returning customers to be counted as new.
What's the problem when this inflation happens? The new visit count alone swells, so the conversion rate and RPS for new look lower than they really are. And some of the revenue that returning customers actually generated gets mixed into new, so returning's contribution gets underestimated. If you feel "new customers just aren't growing" or "there are fewer returning customers than I thought," it's worth suspecting this inflation first. When you split new and returning, it's important to keep this fragility of the marker in mind as a premise.
3. Leveling on the same terms every month is heavy by hand#
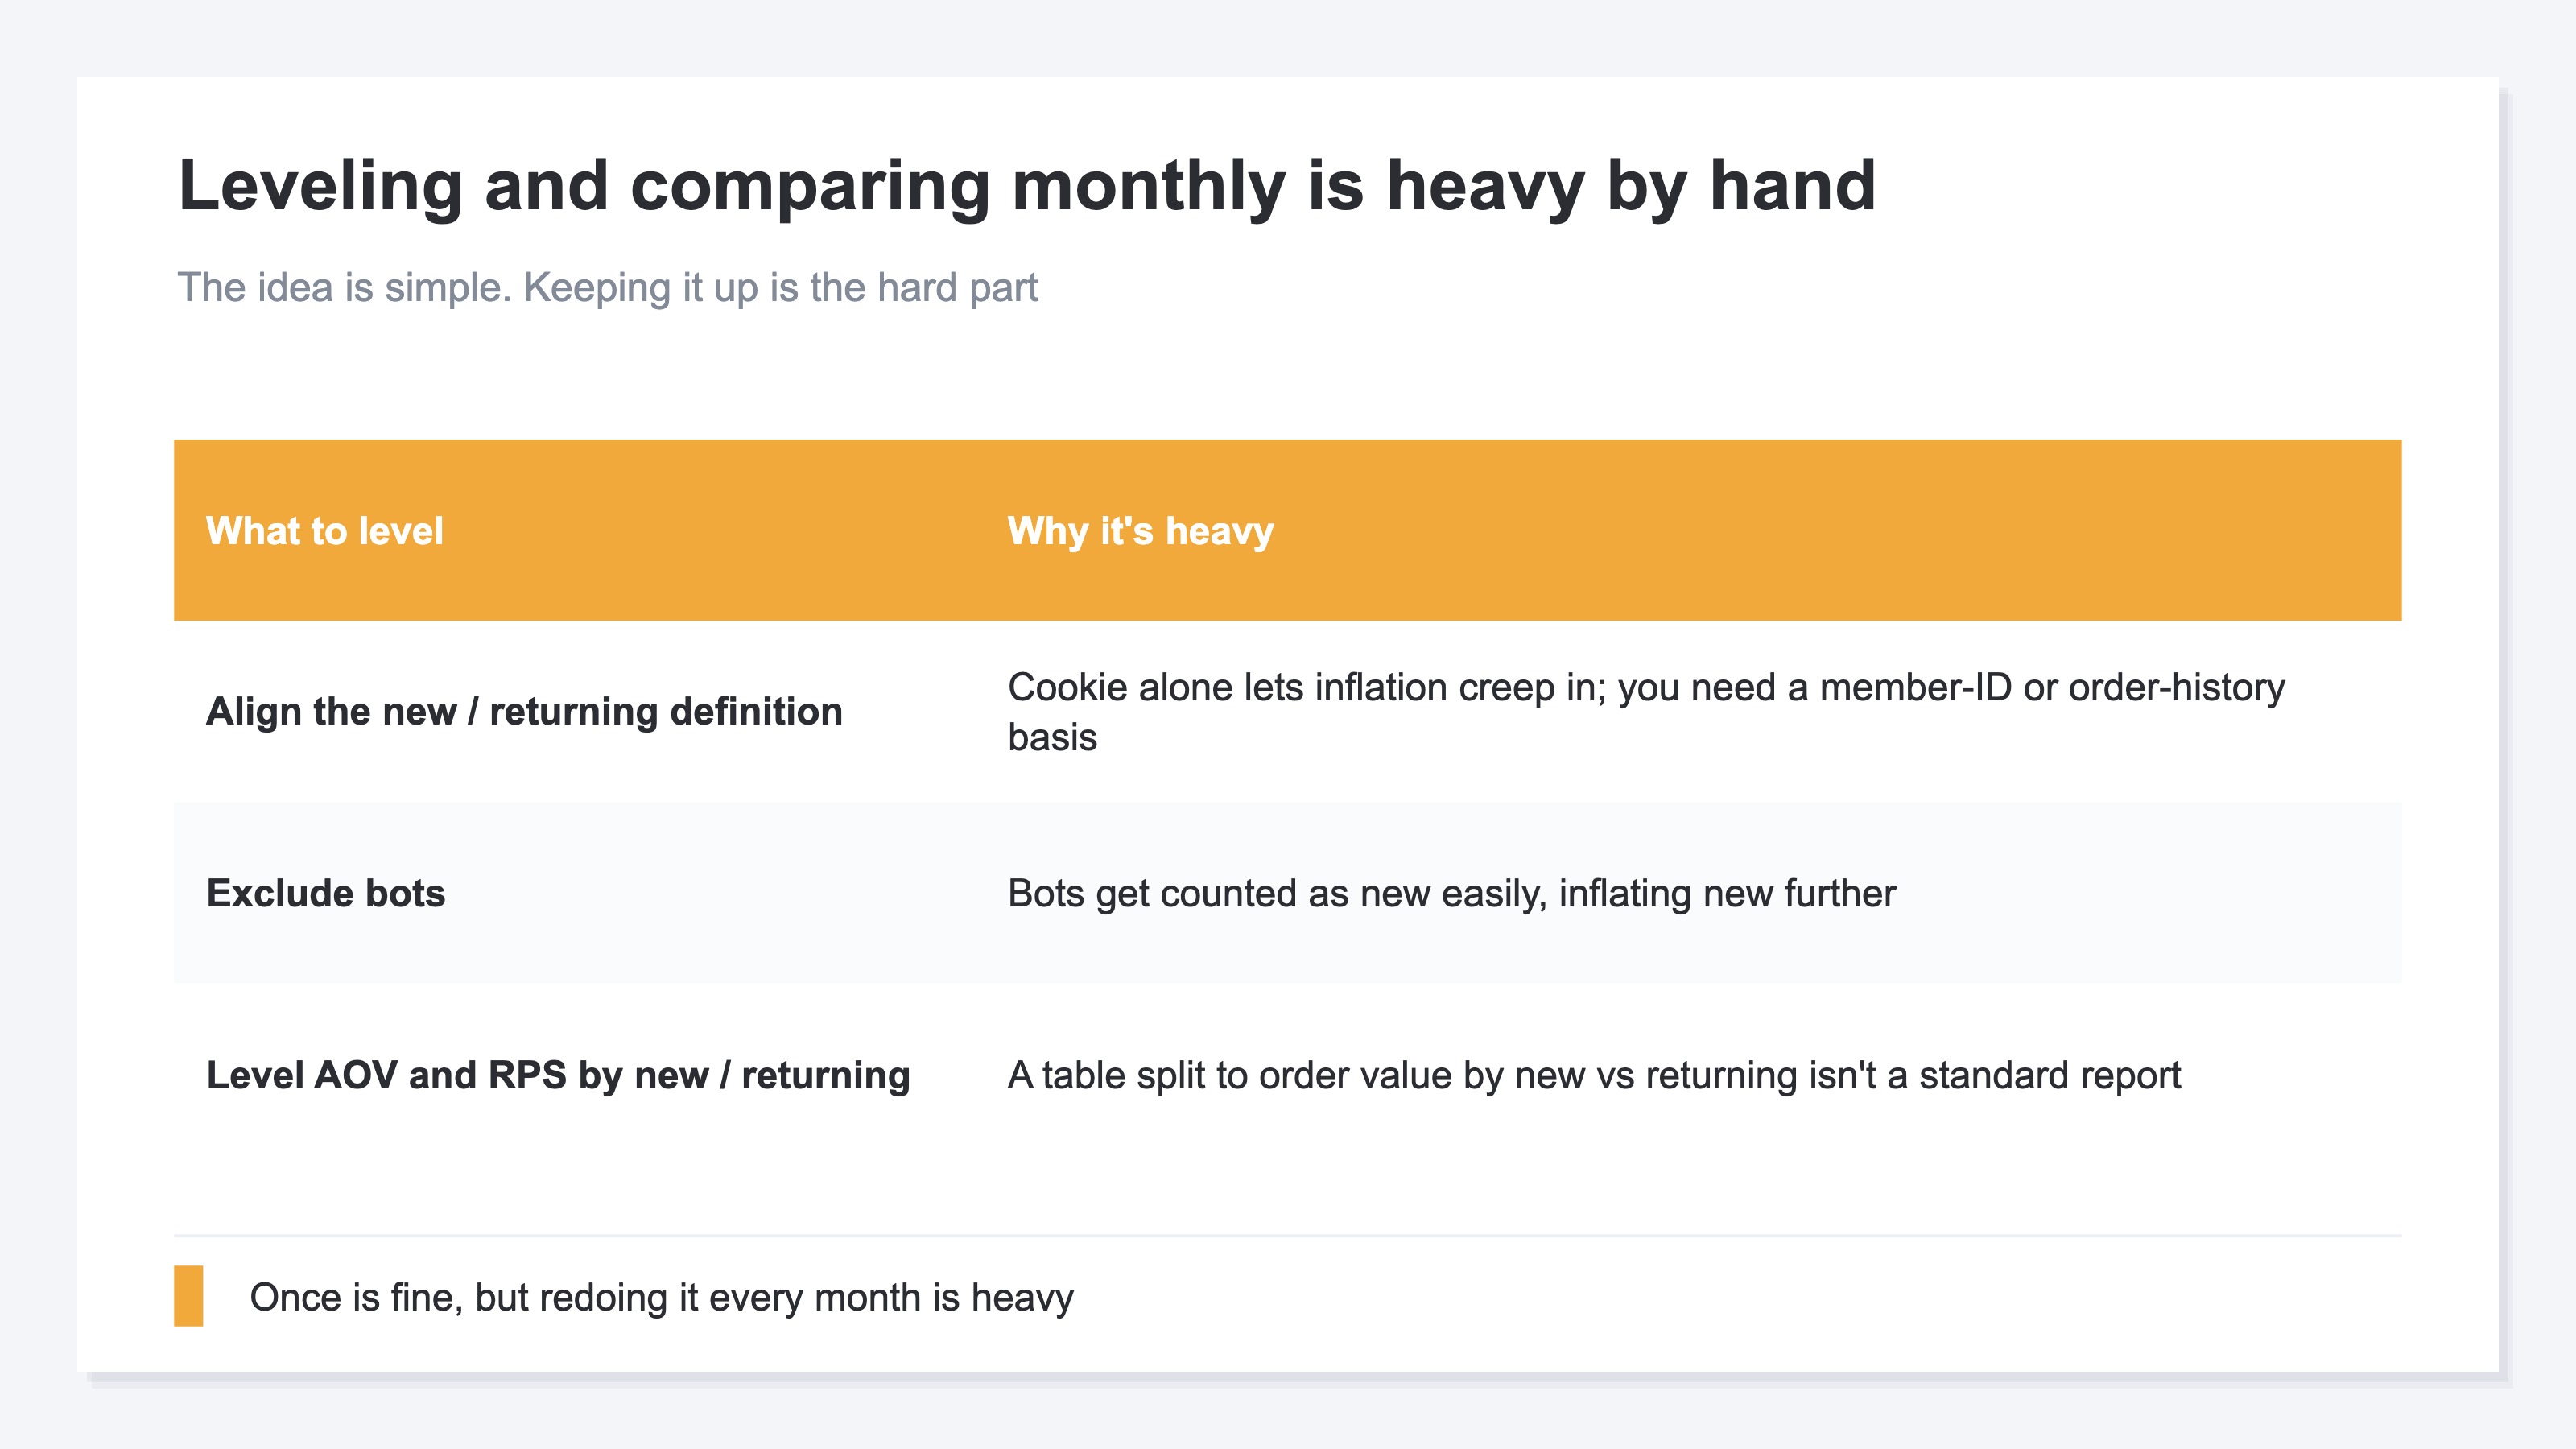
In short, the idea of splitting new from returning is simple. What's heavy is leveling that split to the right conditions and repeating it every month.
First, there's the work of aligning the definition of new and returning. As the previous section showed, basing it on the marker (cookie) alone lets inflation mix in. To split more accurately, you need a way to tell "is this someone who bought for the first time, or who bought again?" using your own basis—the member ID at purchase, order history, and so on. Next, the work of excluding automated programs (bots). Bots often have visits with no marker, so they're easily counted as new, which inflates new further. On top of that, there's the work of leveling down to order value (AOV). A table that lines up CVR, AOV, and RPS as a set for new and returning separately isn't provided in standard reports.
Once is doable. But redoing this prep (aligning definitions, excluding bots, breaking down to AOV) every month and keeping the comparison going, every time you run a campaign, is quietly heavy. The idea is simple, but keeping it up is hard—and that's why new-vs-returning analysis tends not to last.
RevenueScope — the solution
When you try to split revenue by new vs returning, you keep hitting the same wall. Account for the fragility of the marker, align new and returning, and exclude automated programs (bots). Then, can you compare each one's conversion rate (CVR), order value (AOV), and revenue per session (RPS) on one screen, month after month? That's where the wall is.
RevenueScope takes that comparison off your hands. It shows sessions, revenue, conversion rate (CVR), order value (AOV), and revenue per session (RPS) for new and returning on one screen. The figures are after excluding automated-program (bot) traffic (the figures shown are demo data).
| Segment | Sessions | Revenue | CVR | Order value (AOV) | Revenue per session (RPS) |
|---|---|---|---|---|---|
| Returning | 2,000 | ¥640,000 | 4.0% | ¥8,000 | ¥320 |
| New | 6,000 | ¥450,000 | 1.5% | ¥5,000 | ¥75 |
The thing to read in this table is the efficiency gap by segment. Returning customers have few sessions (2,000), yet their order value of ¥8,000 and RPS of ¥320 far exceed new customers'. New customers have many visits (6,000) but, with ¥5,000 order value and ¥75 RPS, they're still at the room-to-grow stage. Look at a blended average and this gap gets buried. Split and visible, the move you can make becomes clear: do you bring back more of the high-RPS returning customers, or lift the order value of the large base of new customers? Once order value is leveled by new and returning, it becomes the material for deciding "which one to work on, and how."
Let me be clear about one thing. What RevenueScope shows is revenue-based efficiency split by new and returning. It does not handle the total revenue a single customer generates over their lifetime (LTV) or churn-rate management. That belongs to a different tool. What RevenueScope takes off your hands is aligning new and returning on the same terms—accounting for the fragility of the marker and bots—and splitting down to order value to prepare the material for telling "which one to work on, and how." Where to start is your call.
FAQ#
Frequently asked questions#
Q. Where do you draw the line between new and returning?
A. Generally, "someone who bought for the first time within the period = new" and "someone on their second purchase or later = returning." But if you judge by the visit marker (cookie) alone, inflation occurs as this article showed. If you want to split more accurately, it's best to tell "have they bought before?" based on the member ID at purchase and order history. The numbers change depending on which basis you split by, so it's important to align the definition across your team.
Q. Is it a bad thing if new customers' AOV is low?
A. Not necessarily. Many new customers buy just one item "to try it out," so a somewhat lower AOV is natural in part. What matters is whether you're growing new customers into returning ones. If AOV rises as they buy a second and third time—even if it starts with a single item—then new-customer acquisition is working. Conversely, if new customers' AOV stays low and doesn't lead to a return visit, that's an entry point to rethink how you present products or how you follow up after the first purchase.
Q. Which should I grow first, "new" or "returning"?
A. It depends on your shop's situation. Generally, returning customers have higher conversion rate and order value, and bringing back existing customers often takes less effort and cost than acquiring new ones. So a safe order is to first check whether you're missing any returning-customer RPS. Then, thinking about how to grow the large base of new customers shows you where your revenue can grow.
Summary#
New and returning differ in conversion rate (CVR), order value (AOV), and revenue per session (RPS). In most cases, returning customers sell more efficiently, and that gap is invisible if you only look at a blended average. So measuring revenue split by new vs returning becomes the material for your next move.
But you can't take the "new" number at face value. When the visit marker (cookie) disappears, the same returning customer gets recounted as new, inflating new. The conversion rate and RPS for new look low, and returning's contribution can get underestimated.
Account for the fragility of the marker and bots to align new and returning, split down to order value, and compare on the same terms. Because repeating that every month is heavy by hand, taking that off your plate lets you decide which one to work on, and how—by numbers, not by gut.
Related articles#
- Numbers to Check Before You Chase Repeat Rate
- Read ROAS Separately for New and Returning Customers
- What Is AOV (Average Order Value): Basics and How to Raise It
References#
- [1] Google Analytics Help "[User acquisition] vs [Traffic acquisition] reports" (2026)
- [2] Google Analytics Help "About ecommerce metrics" (2026)
See which ads actually drive revenue, at a glance
Free up to 5,000 sessions/month, AI analyst included. No credit card required. Up and running in 5 minutes.
Start measuring for free