The morning after a sale ends, the dashboard revenue has jumped. Great, you think. But a few days later, looking at inventory and deposits, there's less in hand than you expected — that happens at a lot of online stores that run sales. This guide walks through what to look at, and how to compare it, so you can judge "you sold a lot, but did you profit?" right after a sale.
Table of Contents
TL;DR#
-
After a sale, read "revenue efficiency," not "revenue amount"
Revenue rises easily with discounts and volume; whether efficiency followed is a separate number
-
Lining up the sale period against a normal period reveals the change in efficiency
For the same channel, compare revenue per session (RPS) in the sale period vs a normal period
-
Discounts lower order value, first-timers lower conversion, so RPS drops
RPS is made of AOV (order value) and CVR (purchase rate); when both fall, the margin thins
-
Channels differ in quality, so split rather than average them
Knowing which channel's sale sold efficiently lets you narrow the next discount target
1. What to read after a sale isn't "revenue"#
Right after a sale, the first thing to read isn't the revenue amount — it's how efficiently you sold per visit.
When a sale ends, revenue almost always rises. Run ads, cut prices, and people come and orders increase. But "revenue rose" and "you profited" are not the same. Discount, and the per-order revenue (order value) falls. Bring in more bargain-hunting first-timers, and the share of visits that buy (purchase rate) tends to fall too.
The view to use here is revenue per session (RPS). RPS shows "how much, on average, one visit sold." Revenue amount swells easily with discounts and volume, but RPS reflects "how efficiently you turned the visits you gathered into sales." A post-sale review starts not with whether revenue rose, but with how this RPS moved versus a normal period.
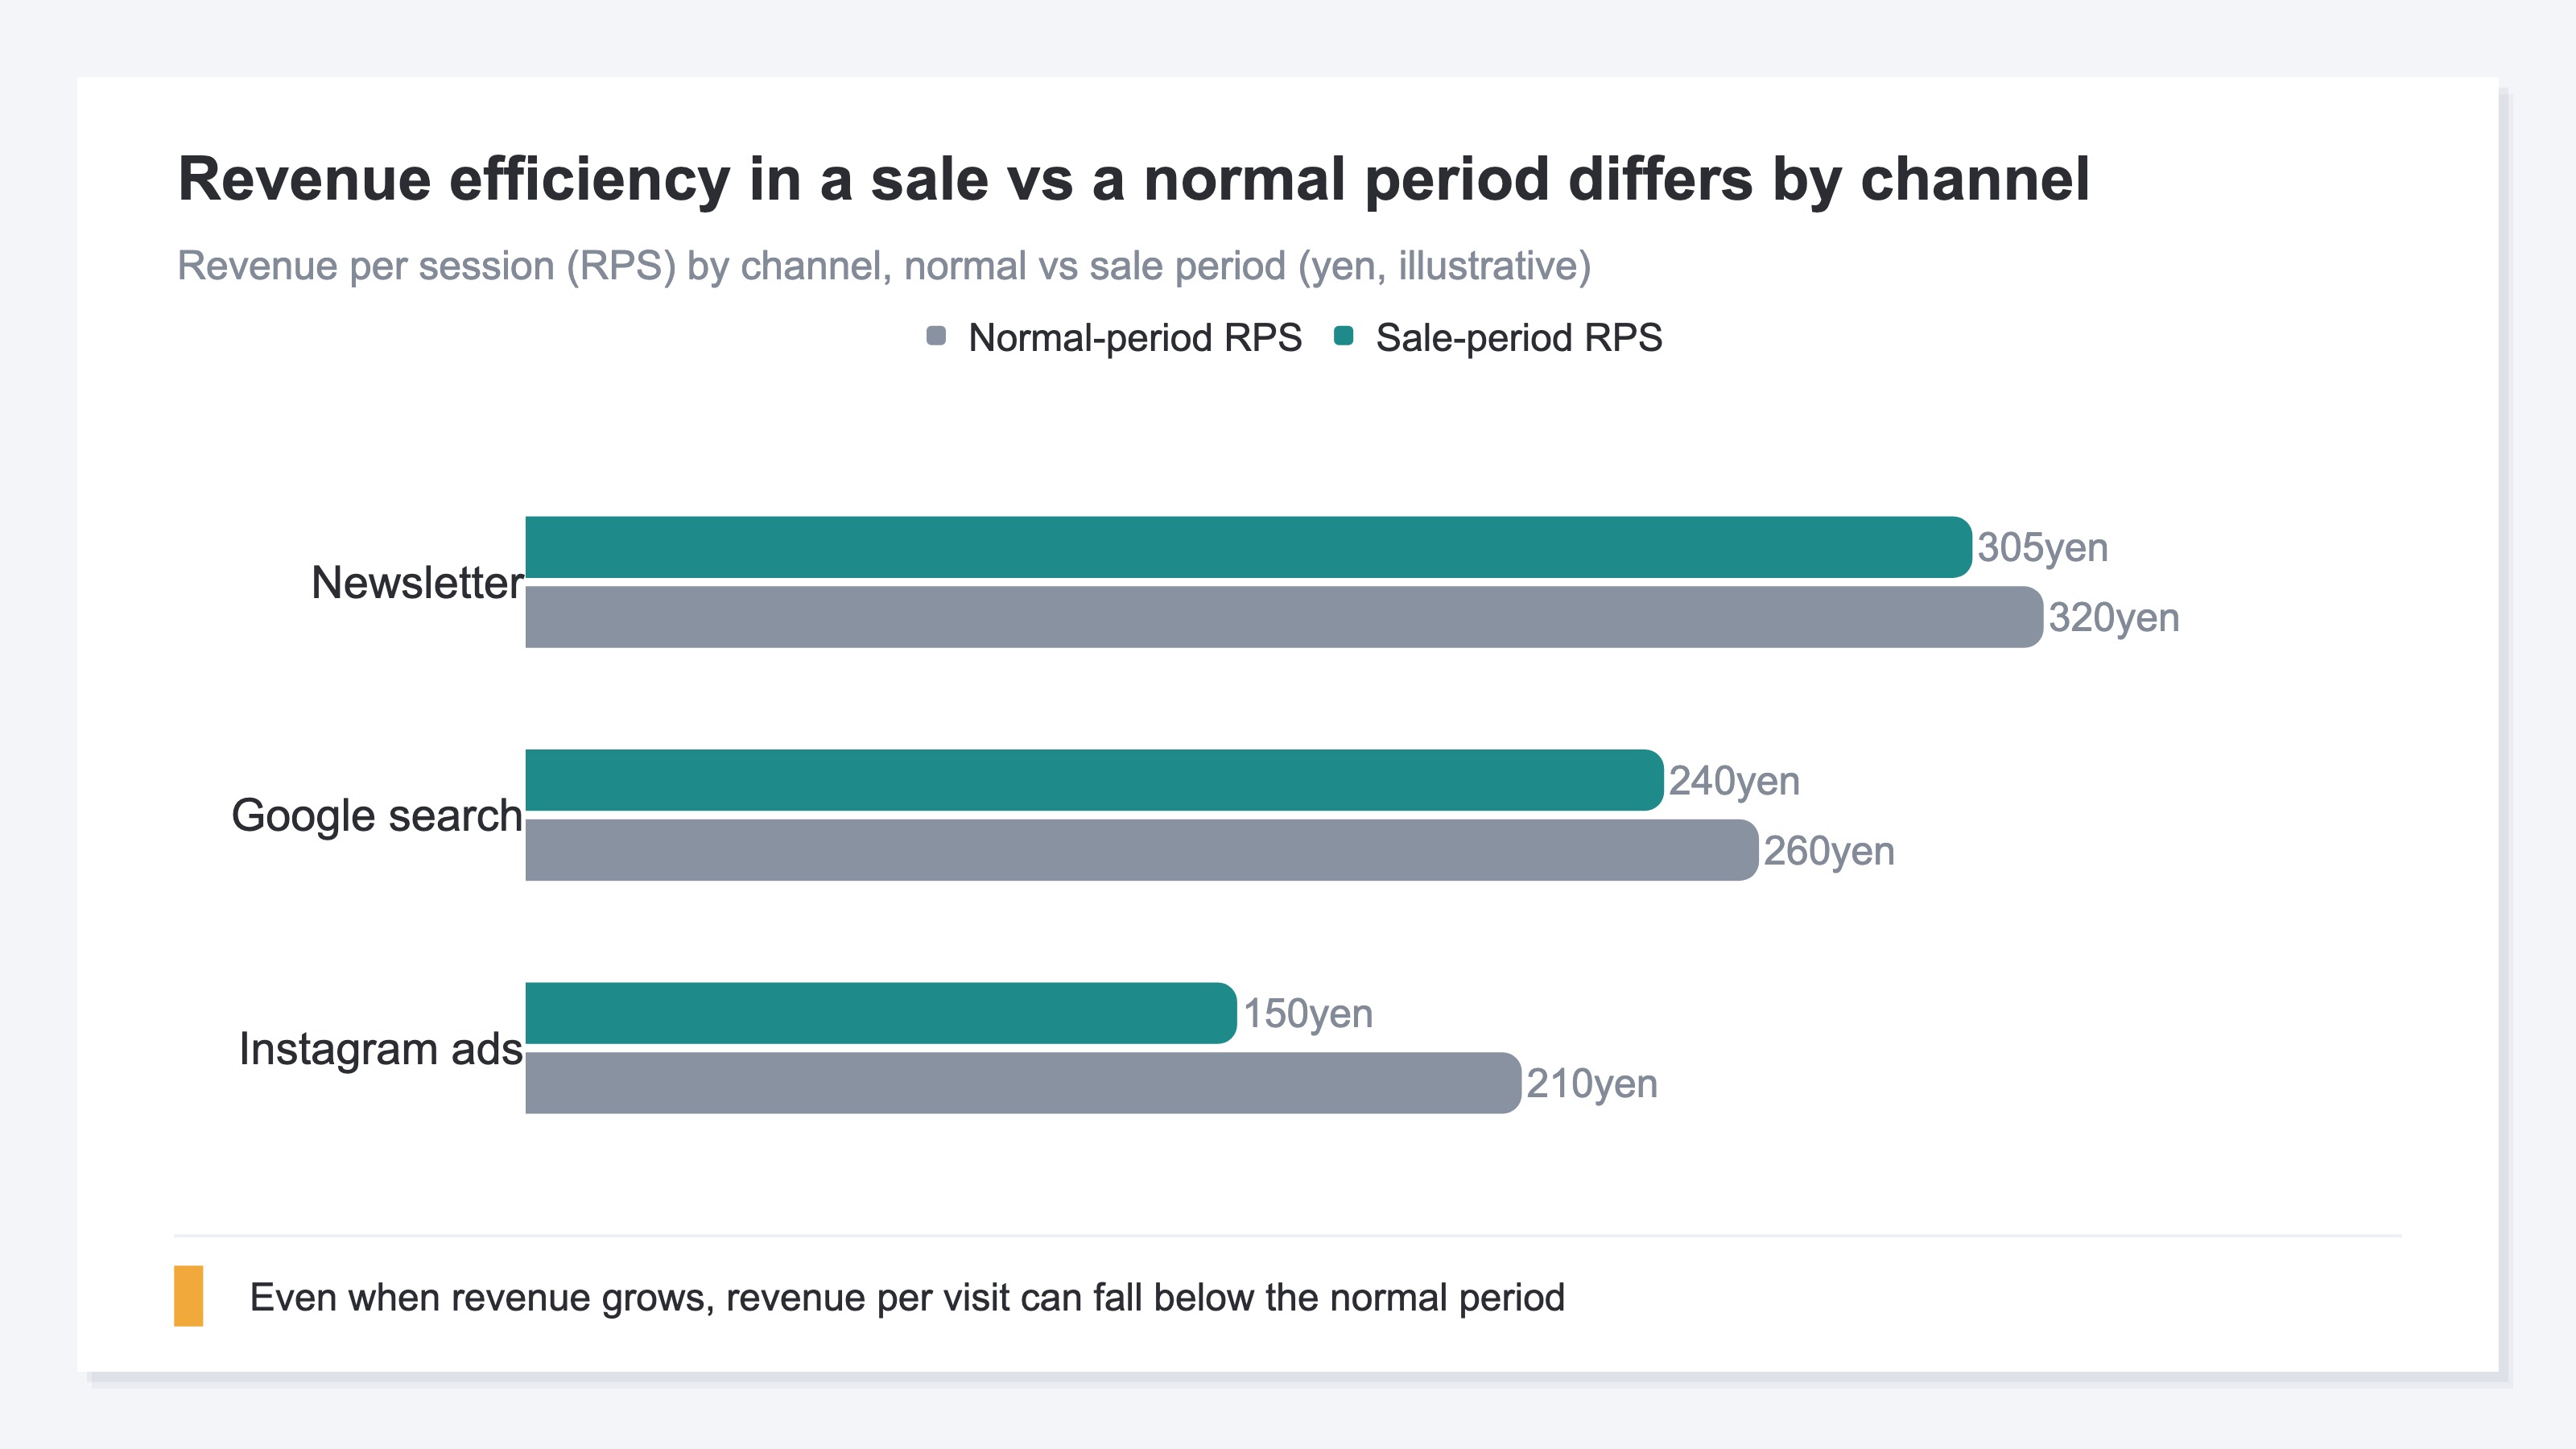
As the comparison above shows, even when revenue rises, RPS can drop below the normal period. That's the real face of "sold a lot, but there's less in hand." Profit itself also shifts with cost and shipping, but just by reading the moves in RPS, order value, and purchase rate before that, you can clearly tell "sold by volume with efficiency down" from "sold while keeping efficiency."
2. Line up the sale period against a normal period#
A sale-period number means little on its own. Only against a normal period can you see whether efficiency rose or fell.
Staring at the sale period's revenue or RPS by itself tells you nothing about good or bad — there's nothing to compare it to. So line up the sale period against the normal period just before it (say, the same number of days before the sale). Put the same channels and same metrics side by side, and what the sale moved comes into view.
There are three metrics to compare. First, average order value (AOV) — the discount depth lands here directly. Next, purchase rate (CVR) — it tends to fall as bargain-hunting first-timers increase. And RPS, which moves as the result of those two. If both order value and purchase rate fall, RPS falls even further.
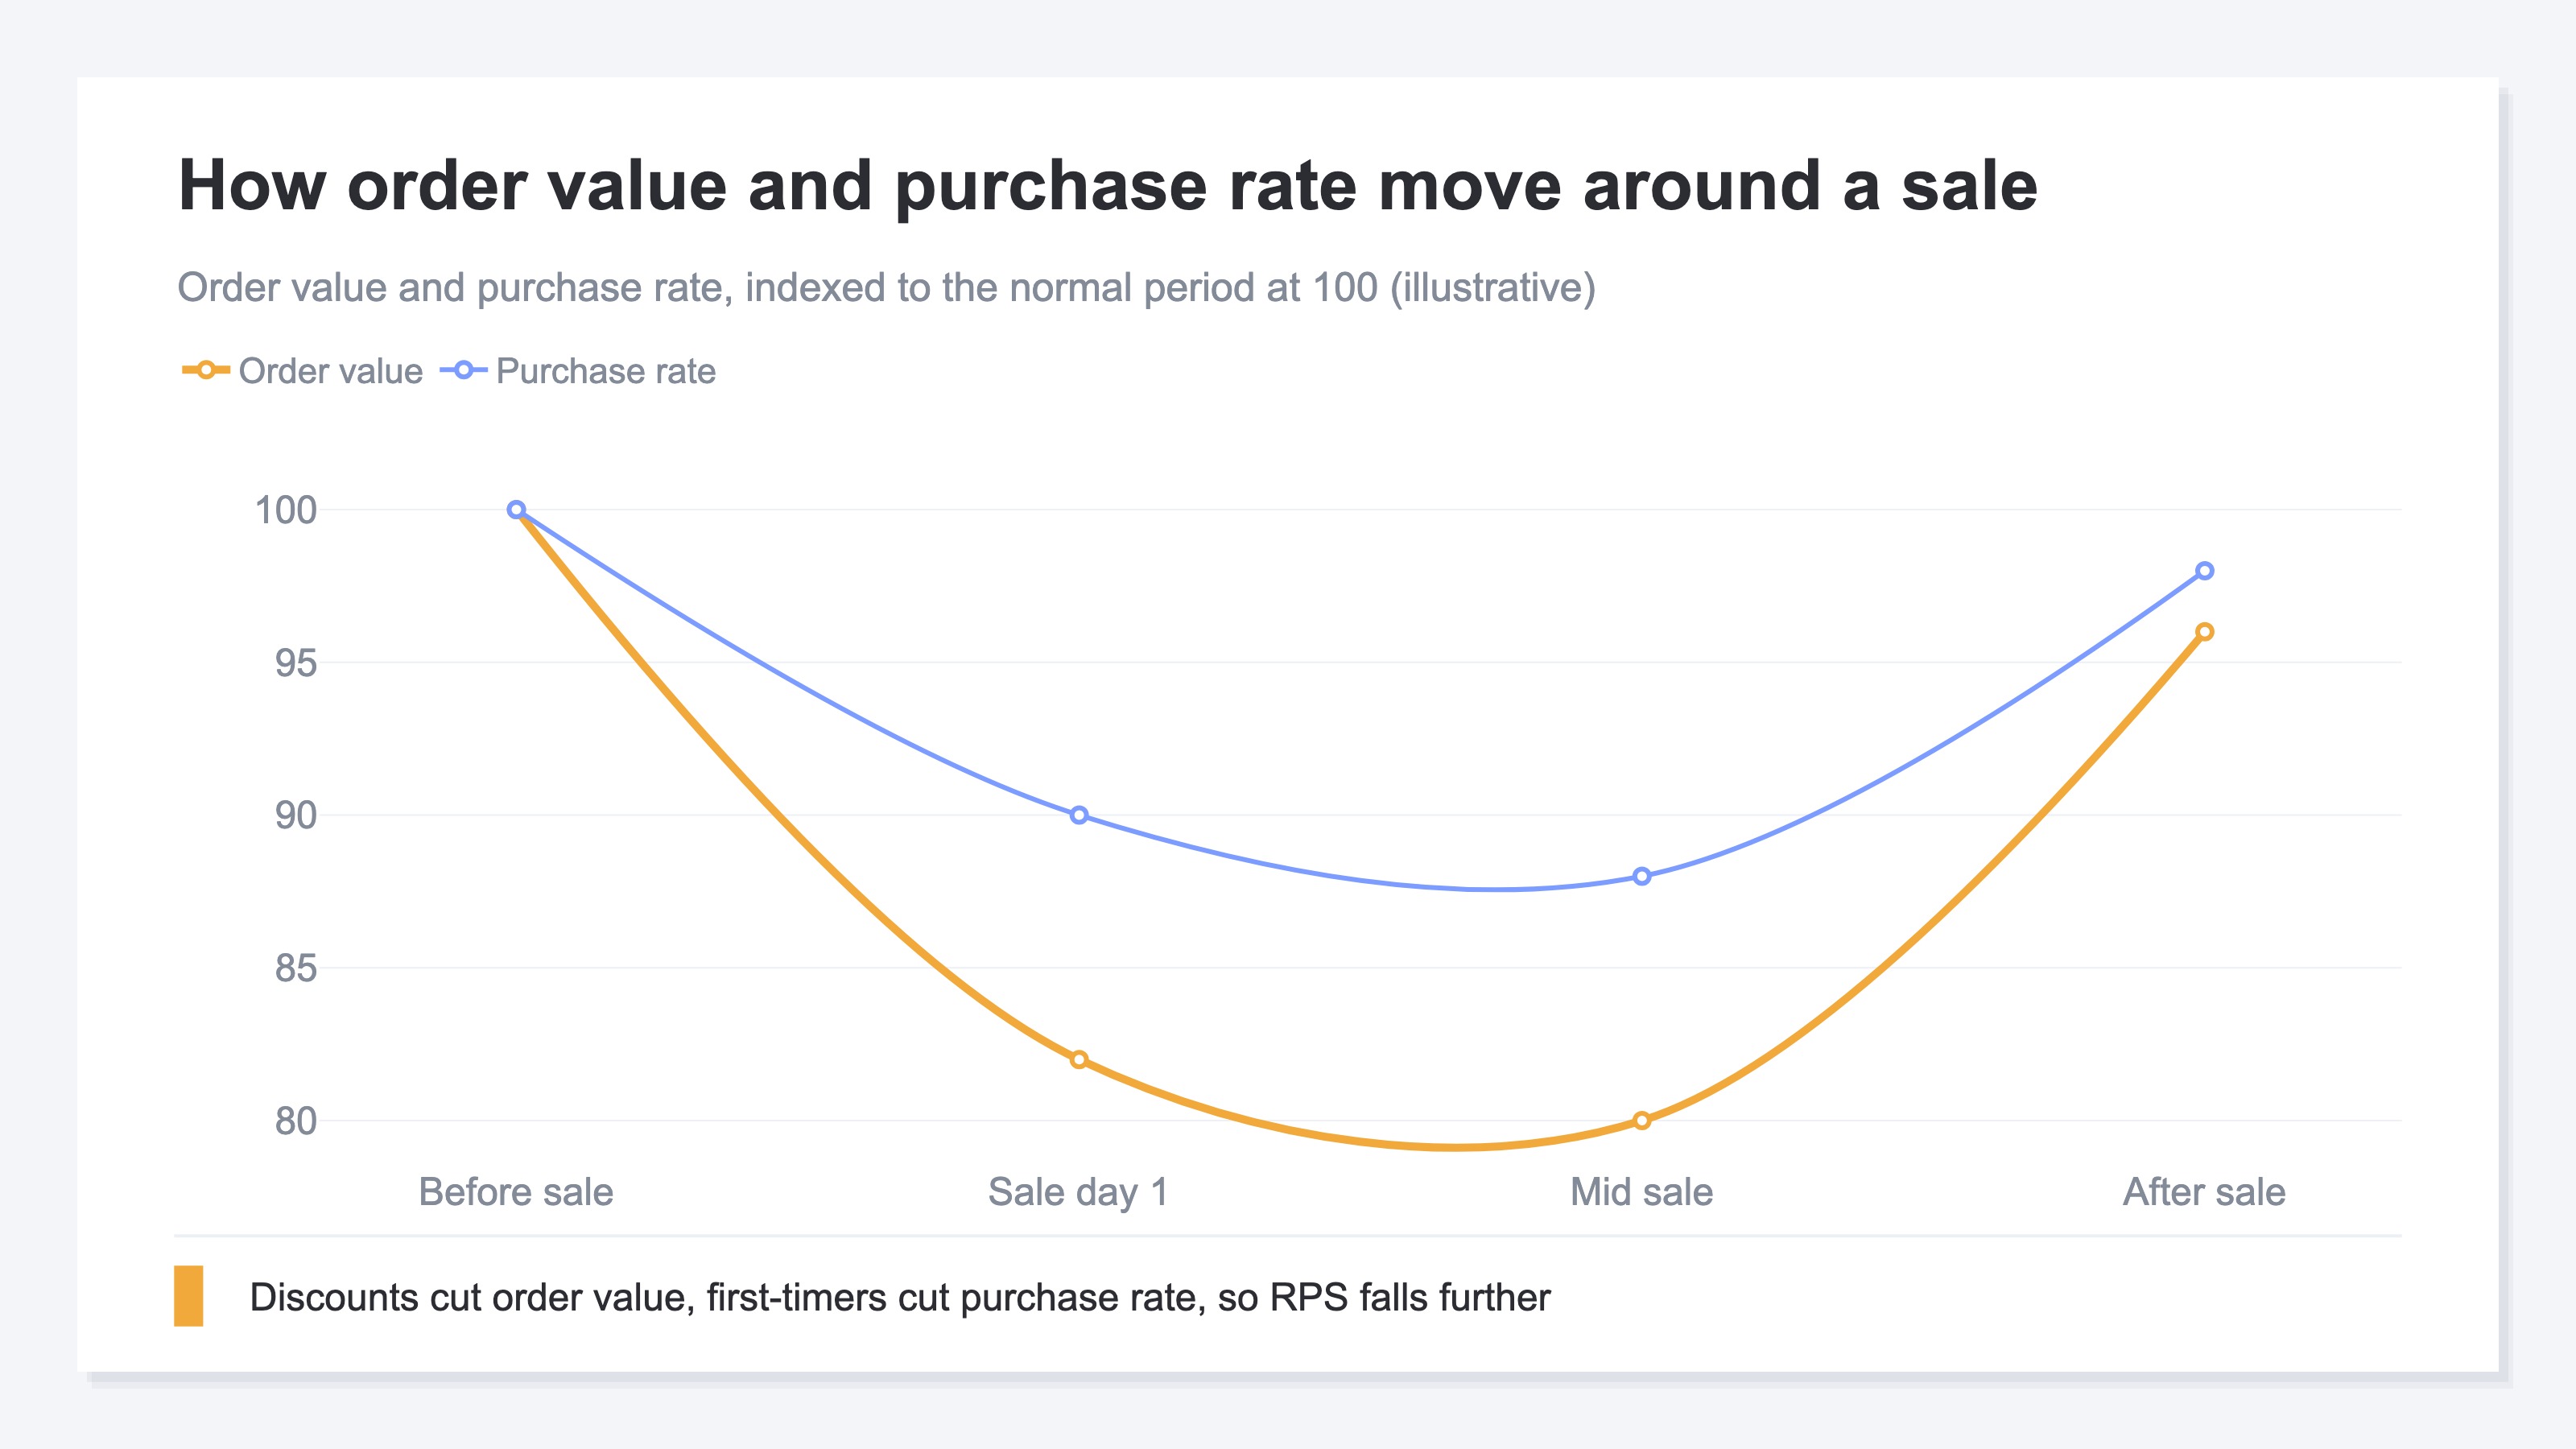
Indexing the normal period to 100 makes the sale-period moves in order value and purchase rate visible at a glance. If discounts lowered order value and first-timers lowered purchase rate, their product — RPS — sits below the normal period. Conversely, if order value fell but purchase rate rose solidly, RPS may have held. Lining them up is exactly what lets you judge "did this sale come with efficiency?"
3. Why revenue rises but RPS falls#
RPS is AOV times CVR. So when discounts pull down order value and first-timers pull down purchase rate, RPS falls even as revenue rises.
Why does RPS fall even as revenue rises? The reason is in how RPS is built. RPS breaks down like this:
RPS (revenue per session) = AOV (order value) × CVR (purchase rate)
In a sale, both of these tend to fall. Discount, and order value (AOV) falls. Gather many bargain-hunting first-timers with ads, and visits rise while the share that buys (CVR) tends to fall. When order value and purchase rate both fall, their product — RPS — drops by more than either fall alone.
Revenue still rises because the visit count itself rises a lot. Efficiency (RPS) drops, but if volume (visits) outweighs it, revenue grows. That's the inside of "sold a lot but didn't profit." Which is why, watching revenue amount alone, you miss that efficiency has dropped. Split RPS into order value and purchase rate, and you can even see the cause — "order value fell" or "first-timers dropped the purchase rate."
4. Tell channels apart by quality#
Average channels together and the difference in efficiency disappears. Split by channel, and you can spot which sales actually sold efficiently.
So far we've looked at totals, but to actually use this for decisions, you need to split by channel. Even in the same sale, the customer who came from a newsletter and the first-timer gathered by an ad buy in completely different ways. Average it all, and efficient and inefficient channels blend together, hiding the difference.
For example, the existing customer who came from a newsletter already knows the product, so a discount can be the trigger to buy while keeping order value. By contrast, the first-timer gathered by an ad that leads with cheapness tends to grab the single cheapest item and leave — order value and purchase rate both fall. Line up sale-period and normal-period RPS by channel, and you can see "which channel's sale sold efficiently."
The idea itself isn't hard. What's hard is aligning this every time, across channels, by hand. Each platform's dashboard uses its own basis, and duplicates creep in. Aligning the sale period and the normal period, by channel, on the same RPS yardstick, gets heavier the more times you repeat it.
RevenueScope solution
That "did we profit?" stays unclear, and that comparing efficiency by channel is heavy, trace back to the same thing: there's usually no place at hand to align the sale period and the normal period across channels on one yardstick. GA4 can split by date range and line up totals, but aligning the sale-period and normal-period efficiency (RPS) by channel, with duplicates removed, on one screen, becomes a structural hand-rebuild.
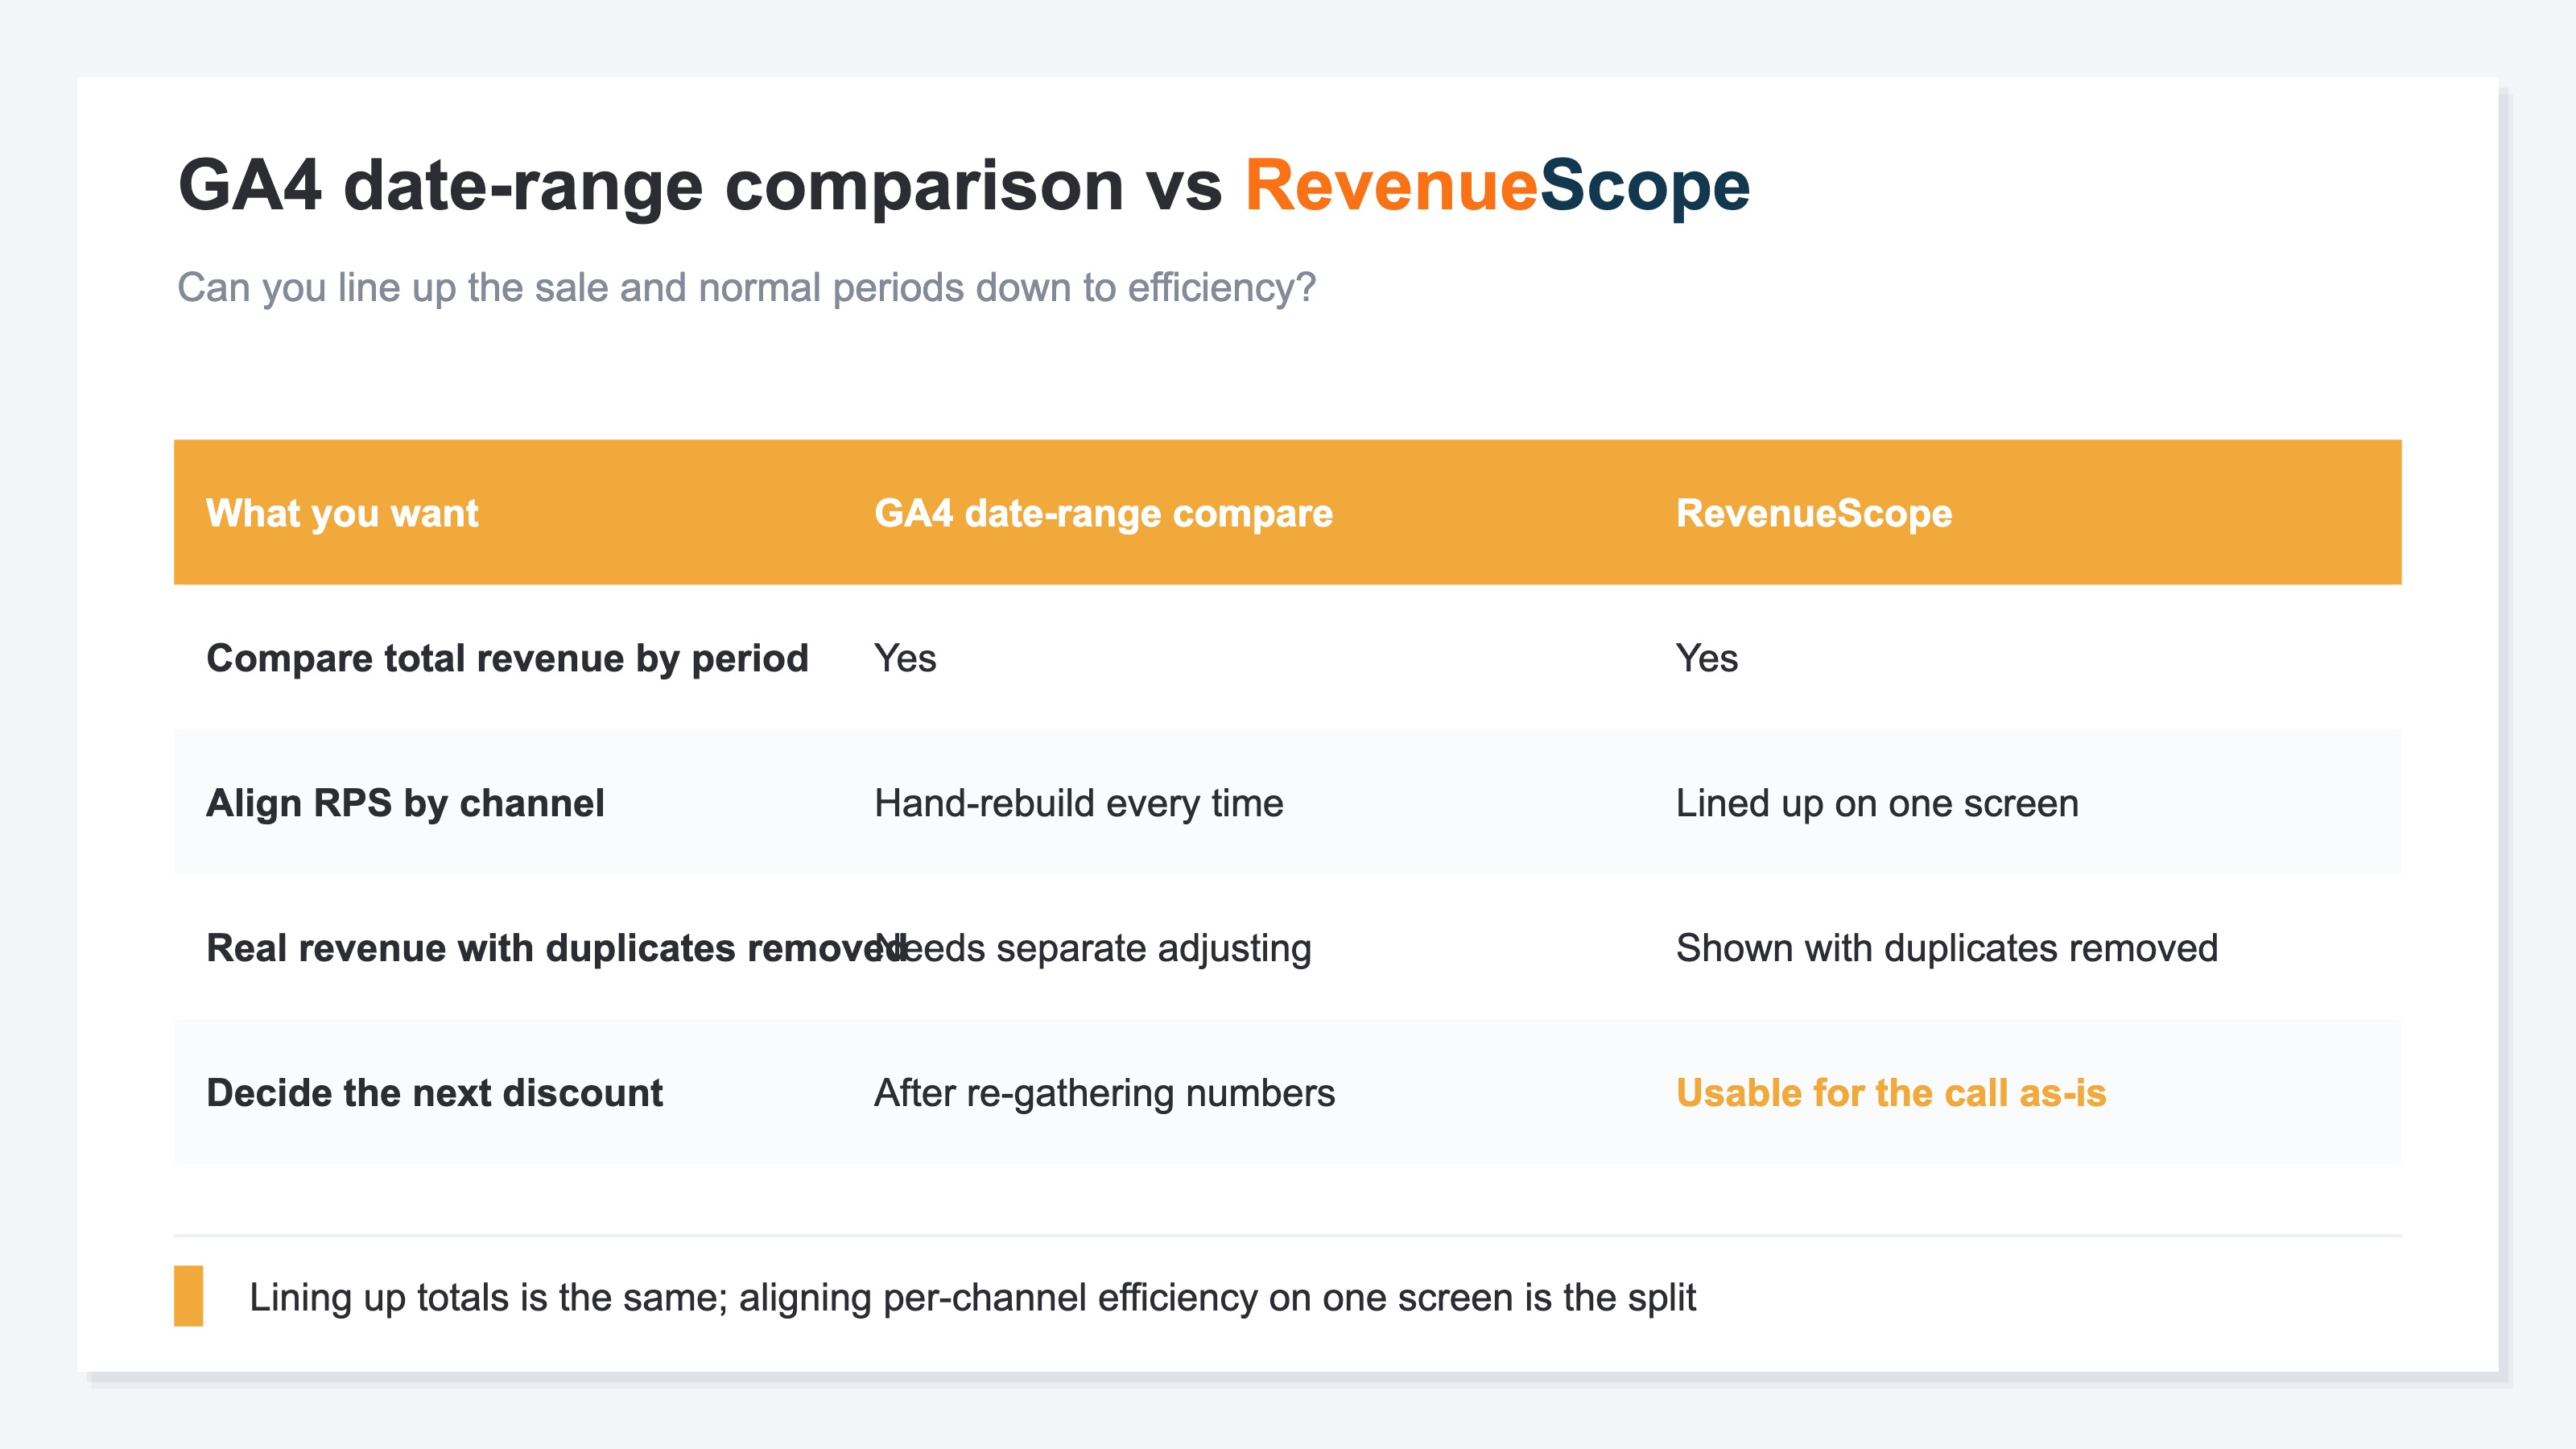
RevenueScope lines things up by date range, rooted in channel-level real revenue with duplicates removed by its own tracking. Pick the sale period and the normal period, and revenue, RPS, order value (AOV), and purchase rate (CVR) line up side by side per channel.
| Channel | Normal RPS | Sale RPS | Order value move | Purchase rate move |
|---|---|---|---|---|
| Newsletter | ¥320 | ¥305 | About flat | Slightly up |
| Google search | ¥260 | ¥240 | Slightly down | Flat |
| Instagram ads | ¥210 | ¥150 | Down | Down |
(An illustration of how it looks when you set a date range in RevenueScope. Figures are demo data.)
Reading this lineup changes the decision. Instagram ads grew visits and revenue in the sale, yet RPS dropped sharply from ¥210 to ¥150 — discounts and first-timers pulled down both order value and purchase rate. The newsletter, meanwhile, held RPS at roughly ¥320 to ¥305: an efficient sale where existing customers bought without dropping order value.
Once you can see this far, you can decide the next move: "next time, run a narrower-discount, newsletter-led sale," or "for Instagram ads, narrow the discounted items so it doesn't end in single-cheapest-item buys." What RevenueScope does is not produce profit itself directly. It lines up sale-period and normal-period revenue efficiency by channel on a common yardstick, so you can choose the next discount depth and target by the numbers.
FAQ#
Frequently asked questions#
Q. When should I review a sale?
A. A few days after the sale ends, once orders settle and returns calm down. Too soon, and returns and cancellations aren't reflected, so revenue looks larger than reality. When you look, read not just revenue but RPS, order value, and purchase rate against the normal period — that's how you judge whether efficiency followed.
Q. Can I tell whether I made a profit with this view?
A. Profit itself, including cost and shipping, needs a separate calculation. But reading the moves in RPS, order value, and purchase rate before that tells you whether you "sold by volume with efficiency down" or "sold while keeping efficiency." You catch the sign of thinning margin early, before the profit math.
Q. Isn't splitting by channel a lot of work?
A. The idea is simple, but each platform's dashboard uses its own basis and duplicates creep in, so matching them by hand every time is heavy. That's exactly why setting up a way to align channels on the same RPS yardstick, once, speeds up every post-sale review.
Conclusion#
Right after a sale, what to read first is revenue efficiency, not the revenue amount. Revenue rises easily with discounts and volume, but whether that turned into profit is another story. Line up revenue per session (RPS) for the sale period and the normal period, and you can see whether efficiency rose or fell.
RPS is AOV (order value) times CVR (purchase rate). When discounts lower order value and bargain-hunting first-timers lower purchase rate, RPS falls even as revenue rises. And since channels differ in quality, it matters to split rather than average them. Decide the next sale's discount depth and target not by gut feel, but by the number that is revenue efficiency by channel.
See which ads actually drive revenue, at a glance
Free up to 5,000 sessions/month, AI analyst included. No credit card required. Up and running in 5 minutes.