A few times a year a sale sends revenue surging through the roof. Then the sale ends, and revenue drops off a cliff. This happens at most online stores, every single time — it's an ordinary movement. The trouble is the unease that lingers when you can't tell whether to wave the drop away as "just a rebound, nothing to do" or read it as a sign your store has actually lost strength.
Here's the first thing this article wants to say. The post-sale valley comes in two kinds, different in nature. One is a temporary rebound from "pull-forward demand" — buyers who were going to purchase anyway brought it forward into the sale. The other is a "real decline": you gathered a crowd of bargain-hunters, and they no longer buy at full price. What makes this awkward is that, looking only at how revenue falls, the two look alike. The clue that tells them apart isn't revenue itself, but whether the quality metrics — average order value, conversion rate — return to their pre-sale levels. This article walks through, in order, how to separate a post-sale valley into rebound or real decline by comparing periods.
Table of contents
Key takeaways#
- Revenue falling after a sale is, in most cases, not an anomaly. It's a natural rebound from "pull-forward demand" — buyers purchasing early during the sale — and from "holding off," shoppers waiting for the next sale.
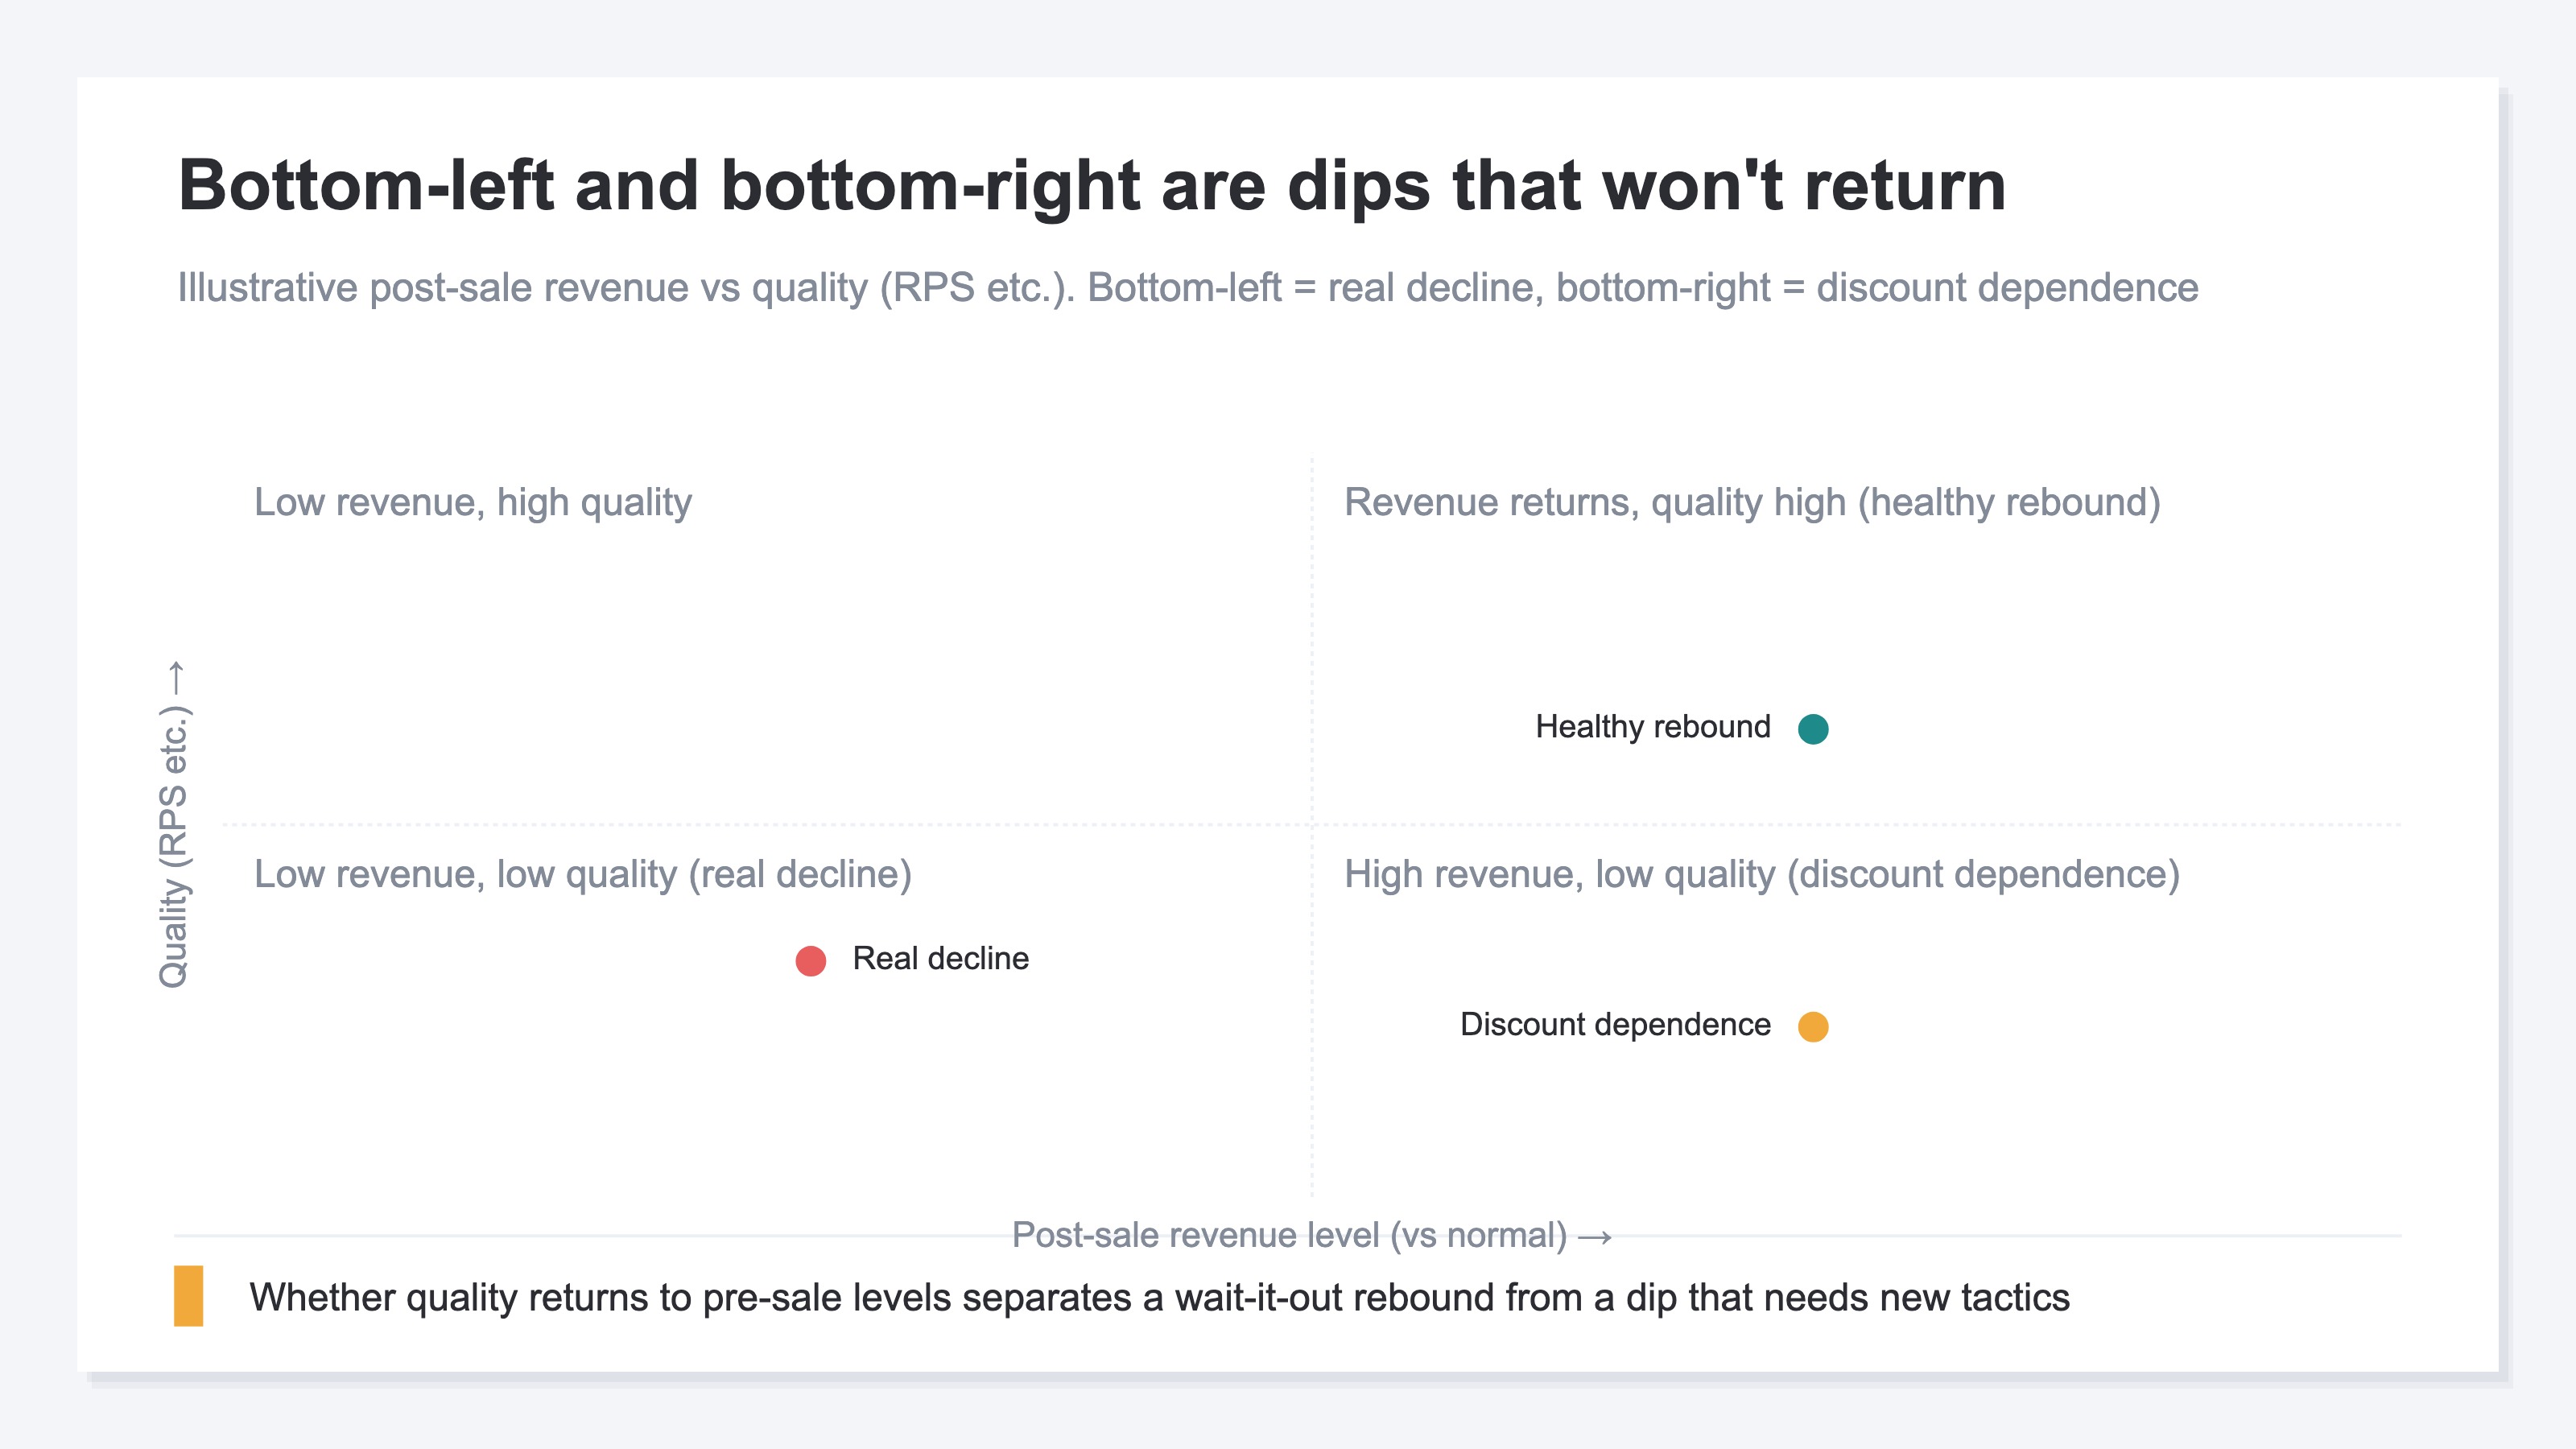
- But not every valley is a rebound. A "real decline" — bargain-hunters who linger and stop buying at full price — leaves a valley of the same shape. A rebound recovers if you wait; a real decline won't recover unless you change tactics.
- The clue that separates the two isn't the revenue figure but the quality. Compare revenue per session (RPS), average order value, and conversion rate across the before, during, and after periods of a sale. If they return to normal after the sale, it's a healthy rebound; if they don't, suspect a real decline.
1. Why revenue falls after a sale#
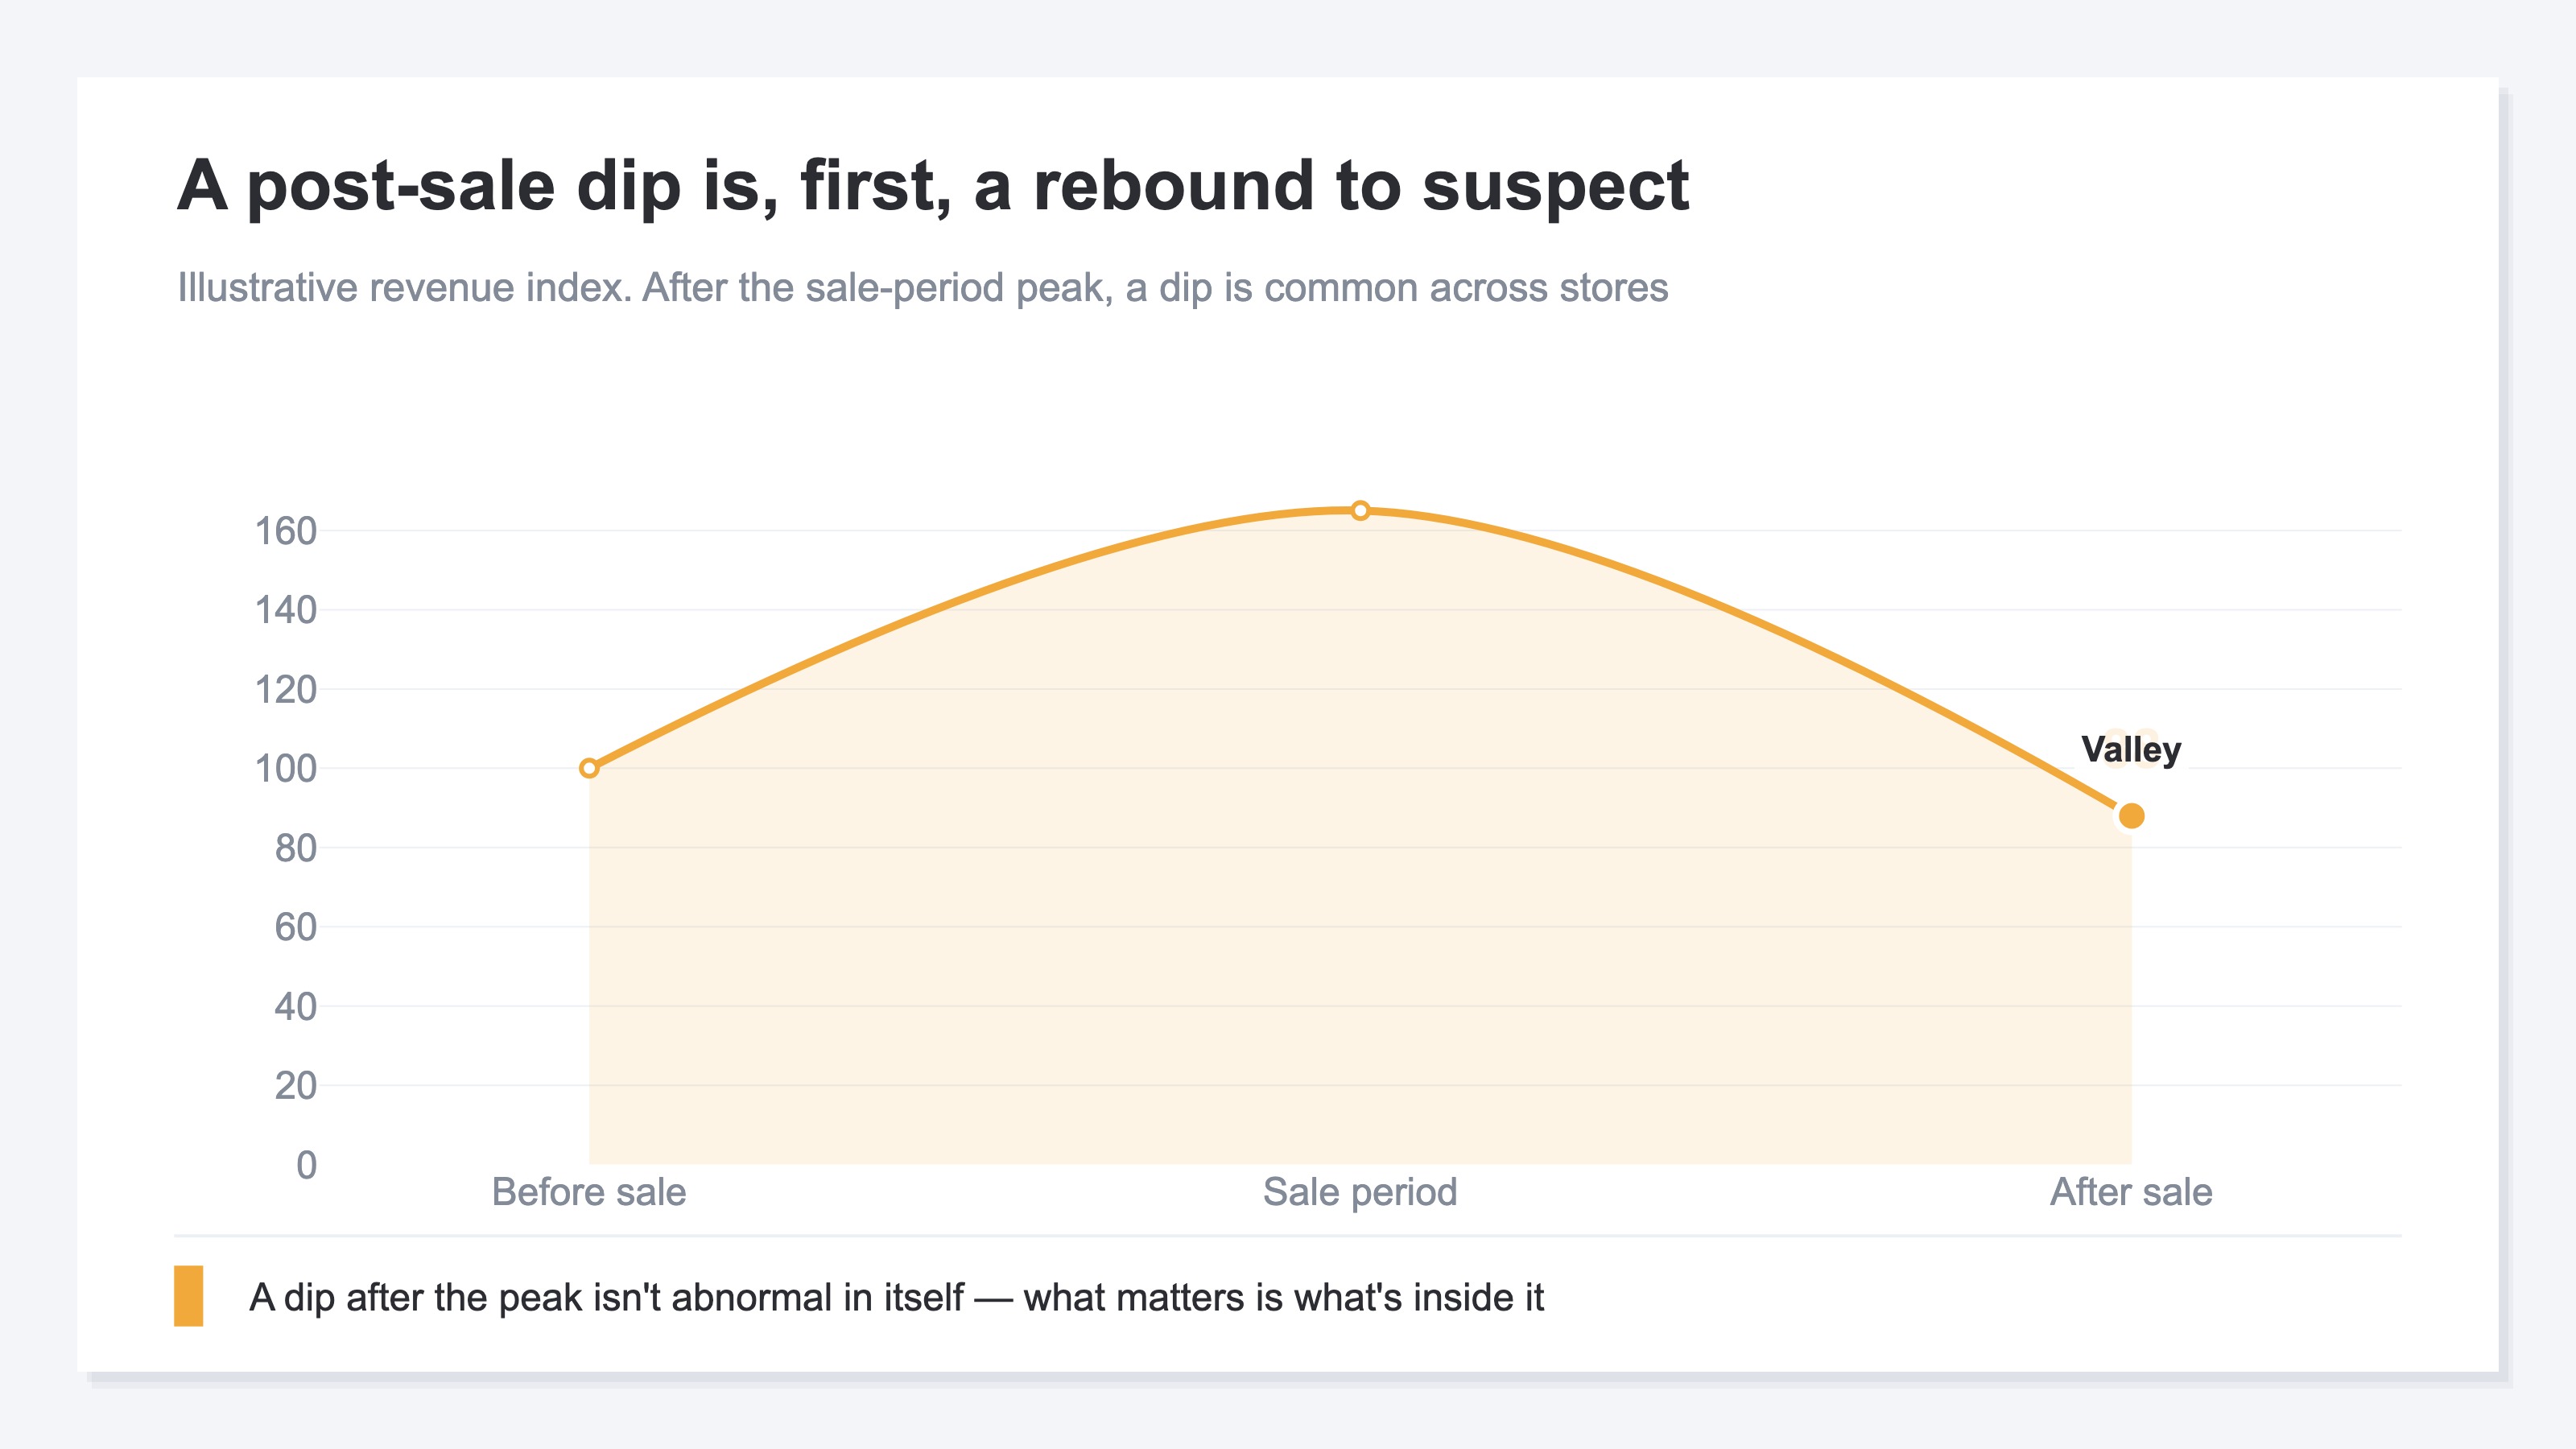
To put the conclusion first: revenue falling after a sale isn't, in itself, an anomaly. Most of it is the swing-back that comes with any sale.
The first reason is "pull-forward demand." People who were going to buy anyway bring the purchase forward into the cheaper sale period. That leaves a hole, after the sale, where their demand would have been. Items that would have sold off little by little over several weeks get bought up all at once during the sale. So that much demand goes missing afterward, and a valley arrives as the flip side of the revenue peak.
The second reason is "holding off." Once customers know a sale exists, they think, "If it's just going to be cheap again, I'll wait for the next one." As a result, fewer people buy at full price after the sale, and revenue thins further. Pull-forward demand and holding off, taken together, are what we call the "rebound."
Up to here, it's a healthy adjustment. You ate the demand early, so you wait for it to come back. But not every valley can be explained by this rebound. If a sale gathers nothing but bargain-hunters and those people never return at full price — that is, your underlying strength itself has fallen — the valley looks exactly the same. That's why deciding "it's a rebound" from the shape of the valley alone is dangerous.
2. Tell rebound from real decline by comparing periods#
The key to telling them apart isn't the revenue figure. It's whether the quality metrics — average order value, conversion rate — return to normal when you compare periods.
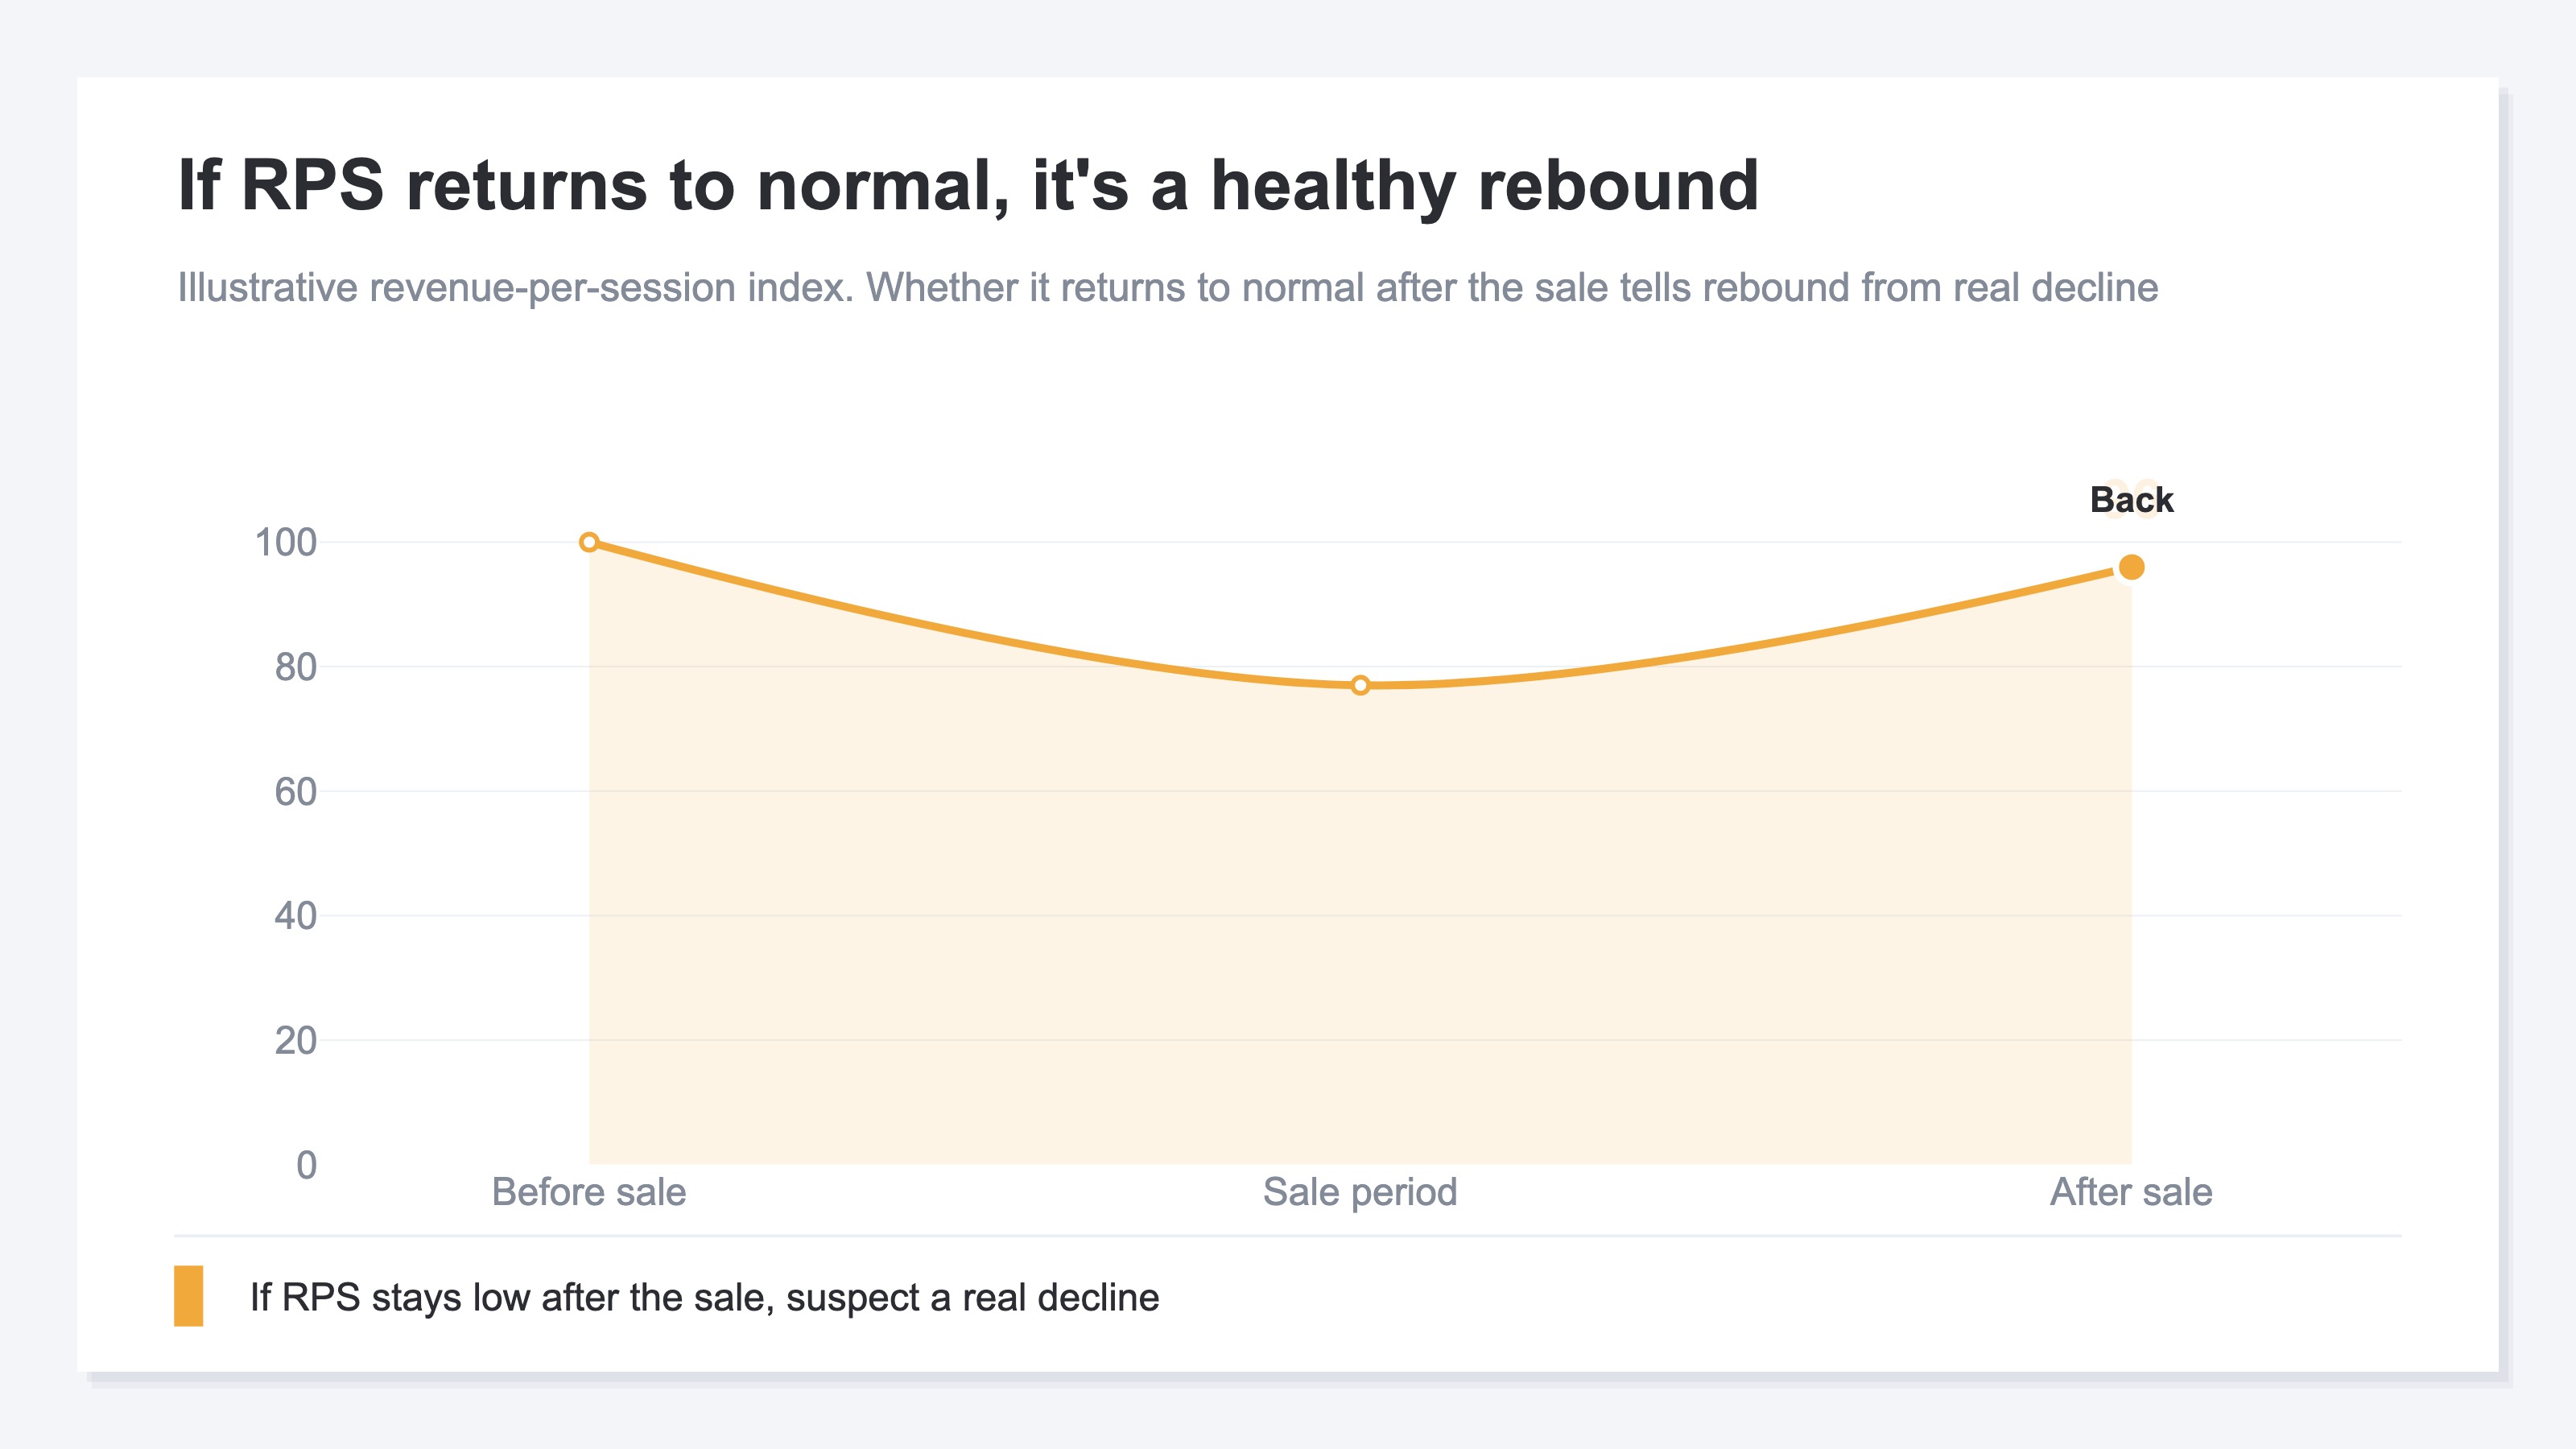
The first thing to grasp is revenue per session (RPS, the average revenue per visit). It doesn't depend on how many people came; it captures the "richness" of how much the people who came actually bought. After a sale, traffic falls, so it's only natural that total revenue drops. That's why you look at the per-person richness with RPS and AOV, not at the total.
Compare this RPS across the three periods — before, during, and after the sale. During the sale you're discounting, so RPS dips for a while. The question is what happens next. If RPS has returned to its pre-sale level after the sale, the valley is pull-forward demand: traffic merely shrank, while the people who came buy just as they normally do — a healthy rebound. Conversely, if RPS stays below the pre-sale level even after the sale, the story changes. Either customers who got into the habit of buying cheap are lingering, or the customers who used to buy at full price have left. Either way, it's a sign of a real decline in the quality of who's coming.
3. Spot the bargain-hunters with AOV and conversion rate#
Whether bargain-hunters are lingering shows up in whether average order value (AOV) and conversion rate (CVR) return to pre-sale levels. If they don't, suspect a real decline.
AOV is the average revenue per order; CVR is the share of visitors who buy. Bargain-hunters have clear tells. One is a low AOV — they buy only what they need, and only the cheap things. The other is a conversion rate that won't recover after the sale, because they look only at sale items and never buy at full price.
So if these two return to pre-sale levels after the sale, the bargain-hunters have left and your usual customer base is back. If they don't return, customers pulled in by low prices have stayed, and the state of "no one buys at full price" continues — that's a real decline. RPS, AOV, and conversion rate each reflect "the quality of who came" from a different angle. Whether all three return to pre-sale levels splits the reading of the valley cleanly in two.
Let me make the scope of this article clear. What it shows is how to tell apart whether a post-sale valley is a rebound or a real decline. Whether the sale itself actually made you money is covered in "How to review revenue during a sale." Telling whether a one-off promotion lifted revenue is laid out separately in "The revenue effect of coupons and sales." For when to use RPS versus AOV, see "RPS versus AOV"; for how revenue splits between new and returning customers, "Splitting revenue between new and returning customers" is the entry point. The full picture of diagnosing a revenue drop by KPI is covered in "Diagnosing an e-commerce revenue drop by KPI."
The idea itself isn't hard. What's hard is keeping it up every time. With each sale you have to carve out the before, during, and after periods by hand and recompute RPS, AOV, and conversion rate one at a time. And many analytics tools don't offer RPS, or AOV and conversion rate by campaign, as a headline metric — they won't appear unless you build the "revenue divided by orders or sessions" calculation yourself. A simple idea, yet the effort grows with every angle you want to see.
RevenueScope's solution
When you try to confirm what a post-sale valley really is, you run into the same wall every time. You know that a rebound versus a real decline shows up in whether the quality metrics return — yet carving out periods by hand for each sale and channel, and recomputing an RPS or AOV that was never made the headline, is heavy enough that you run out of energy before you reach the actual call.
RevenueScope holds that period comparison from the start, as the quality of revenue. Give it a period, and it returns that period's revenue, average order value (AOV), conversion rate (CVR), and RPS, with a comparison to the prior period and a day-by-day trend (display uses demo data). Specify before, during, and after the sale, and you can check on one screen whether the quality metrics have returned. Ask it, and it comes back like this.
| Period | Revenue | AOV | CVR | RPS |
|---|---|---|---|---|
| Before sale (normal) | ¥3,200,000 | ¥6,800 | 2.4% | ¥163 |
| Sale period | ¥6,400,000 | ¥3,300 | 3.8% | ¥125 |
| After sale | ¥2,900,000 | ¥6,500 | 2.4% | ¥156 |
The telling line in this table is the after-sale row. Revenue (¥2,900,000) sits a little below the pre-sale level (¥3,200,000) — a valley. Yet AOV (¥6,500), conversion rate (2.4%), and RPS (¥156) have nearly all returned to their pre-sale levels (¥6,800, 2.4%, ¥163). The people who came are buying just as they normally do — so this valley is a healthy rebound from pull-forward demand. The read is to wait for traffic to come back. If instead AOV or RPS had stayed depressed, near the sale-period figures (¥3,300, ¥125), the call would flip. That would signal a real decline with bargain-hunters lingering, and the next move would change to reviewing the depth and target of the next sale's discount.
Drill down further to the channel or campaign level, and you can separate out which traffic source, or which sale tactic, brought in the low-quality customers. In GA4, RPS and AOV by campaign aren't headline metrics, period comparison tends to be manual every time, and breaking the valley down to which channel it came from is hard work. RevenueScope returns this separation starting from revenue, so connect it to ChatGPT or Claude over MCP and you can hand even the judgment of "is this valley a rebound or a real decline?" to the AI.
Let me make one thing clear. What RevenueScope outputs is revenue, average order value (AOV), conversion rate (CVR), RPS, and session count by period and segment, along with their breakdowns. It does not output profit after cost (gross margin) or a customer's lifetime value (LTV). It assembles the material for telling a rebound from a real decline, but the final call on how to change your discounting is yours.
FAQ#
Q1. Revenue dropped after the sale. Does that mean the sale was a failure?
Don't conclude that right away. Buyers bring purchases forward during the sale, and those waiting for the next sale hold off on full price, so revenue falling after a sale is a natural rebound. If AOV, conversion rate, and RPS have returned to their pre-sale levels, you can treat it as a healthy rebound, and the call is to wait for traffic to come back.
Q2. Which numbers do I use to tell a rebound from a real decline?
Not total revenue, but the quality metrics. Compare revenue per session (RPS), average order value, and conversion rate across before, during, and after the sale. If they return to normal after the sale, it's a rebound; if they stay low, suspect a real decline. Total revenue falling because traffic shrank is no problem, as long as quality holds.
Q3. Once I've found a real decline, what do I do next?
First, take it as a sign to review the depth, target, and frequency of your next sale's discount. Discount too deep or too often and only bargain-hunters remain, while full-price customers leave. Check, at the campaign level, which tactic brought in the low-quality customers, and narrowing the target is your starting point.
Summary#
Revenue falling after a sale is, in most cases, not an anomaly. It's a natural rebound from pull-forward demand — buyers purchasing early during the sale — and from holding off, shoppers waiting for the next sale. So there's no need to panic and change tactics just because a valley appears.
But not every valley is a rebound. A real decline — bargain-hunters lingering and no longer buying at full price — leaves a valley of the same shape. The clue that separates the two isn't the revenue figure but the quality. Compare revenue per session (RPS), average order value, and conversion rate across before, during, and after the sale. If they return to normal after the sale, it's a healthy rebound that recovers if you wait. If they don't, it's a sign to review the depth and target of your discount. Change how you read the valley, and the move you make changes too.
See which ads actually drive revenue, at a glance
Free up to 5,000 sessions/month, AI analyst included. No credit card required. Up and running in 5 minutes.
References#
- [1] Ministry of Economy, Trade and Industry "Survey on Electronic Commerce" (2024)
- [2] Google Analytics Help "About conversion rate" (URL unconfirmed)
- [3] Shopify "What Is Average Order Value (AOV)?" (URL unconfirmed)
- [4] Baymard Institute (2024)