"We ran a campaign to lift average order value (AOV), but revenue barely moved." If you run an EC store, you have probably hit this mismatch. The usual cause is that you were watching AOV alone and the other half — conversion rate (CVR) — quietly slipped.
AOV (average order value) and RPS (revenue per session) both measure revenue, but they cover different ranges. AOV is the spend per buyer; RPS is the revenue per visitor. The bottom line: measure tactics that move the unit price with AOV, decide where to put your next budget with RPS — and remember the two are linked by RPS = AOV x CVR.
This article does not stop at "which metric to use." The question it really answers is "which channel should get the next ad budget." To get there, we cover how RPS and AOV differ, the formula that links them, when to use each, the classic "raised AOV but RPS fell" pattern — and why GA4's standard reports cannot line up the numbers you need to make that call.
Table of Contents
TL;DR#
-
AOV = spend per buyer, RPS = revenue per visitor
AOV is the average value of one order (revenue / orders). RPS is revenue per session (revenue / sessions). The denominator — orders vs visits — changes the meaning.
-
They are linked by RPS = AOV x CVR
RPS is average order value times conversion rate. Look at AOV alone and you miss the CVR gap, misreading revenue efficiency.
-
AOV for pricing moves, RPS for budget allocation
Measure cross-sell and bundle tactics with AOV. Decide which channel gets the next budget with RPS, which also reflects how well visitors convert.
-
"Where to invest next" cannot be settled in standard GA4
You can only decide it once channel-level RPS is lined up bot-free and split by new vs returning. The AOV x CVR calculator does not get you that far.
1. How RPS and AOV differ#
Bottom line: AOV is "spend per buyer," RPS is "revenue per visitor." Whether you divide by orders or by visits changes the meaning.
RPS and AOV sound alike, but the denominator of the division is different.
- AOV (Average Order Value) = revenue / orders. How much a buyer spent in one order — the "spend per buyer."
- RPS (Revenue Per Session) = revenue / sessions. How much revenue each visit produced — the "revenue per visitor."
The difference is the denominator. AOV counts only people who bought, while RPS divides by all visits, including non-buyers. So AOV is "unit price," and RPS bundles in "how well it sells."
Picture two stores both with an AOV of 5,000 yen. If one converts 1 in 100 visitors and the other 1 in 20, the revenue per visit is wildly different. AOV is 5,000 yen for both, but RPS diverges sharply. AOV alone cannot show that "how well it sells" gap.
2. The formula linking RPS and AOV#
Bottom line: RPS = AOV x CVR. With the same unit price, a different conversion rate changes RPS sharply.
RPS and AOV connect cleanly through conversion rate (CVR).
RPS = AOV x CVR
Here is why. AOV is "revenue / orders" and CVR is "orders / sessions." Multiply them and orders cancel out, leaving "revenue / sessions" = RPS. In other words, RPS is average order value multiplied by conversion rate.
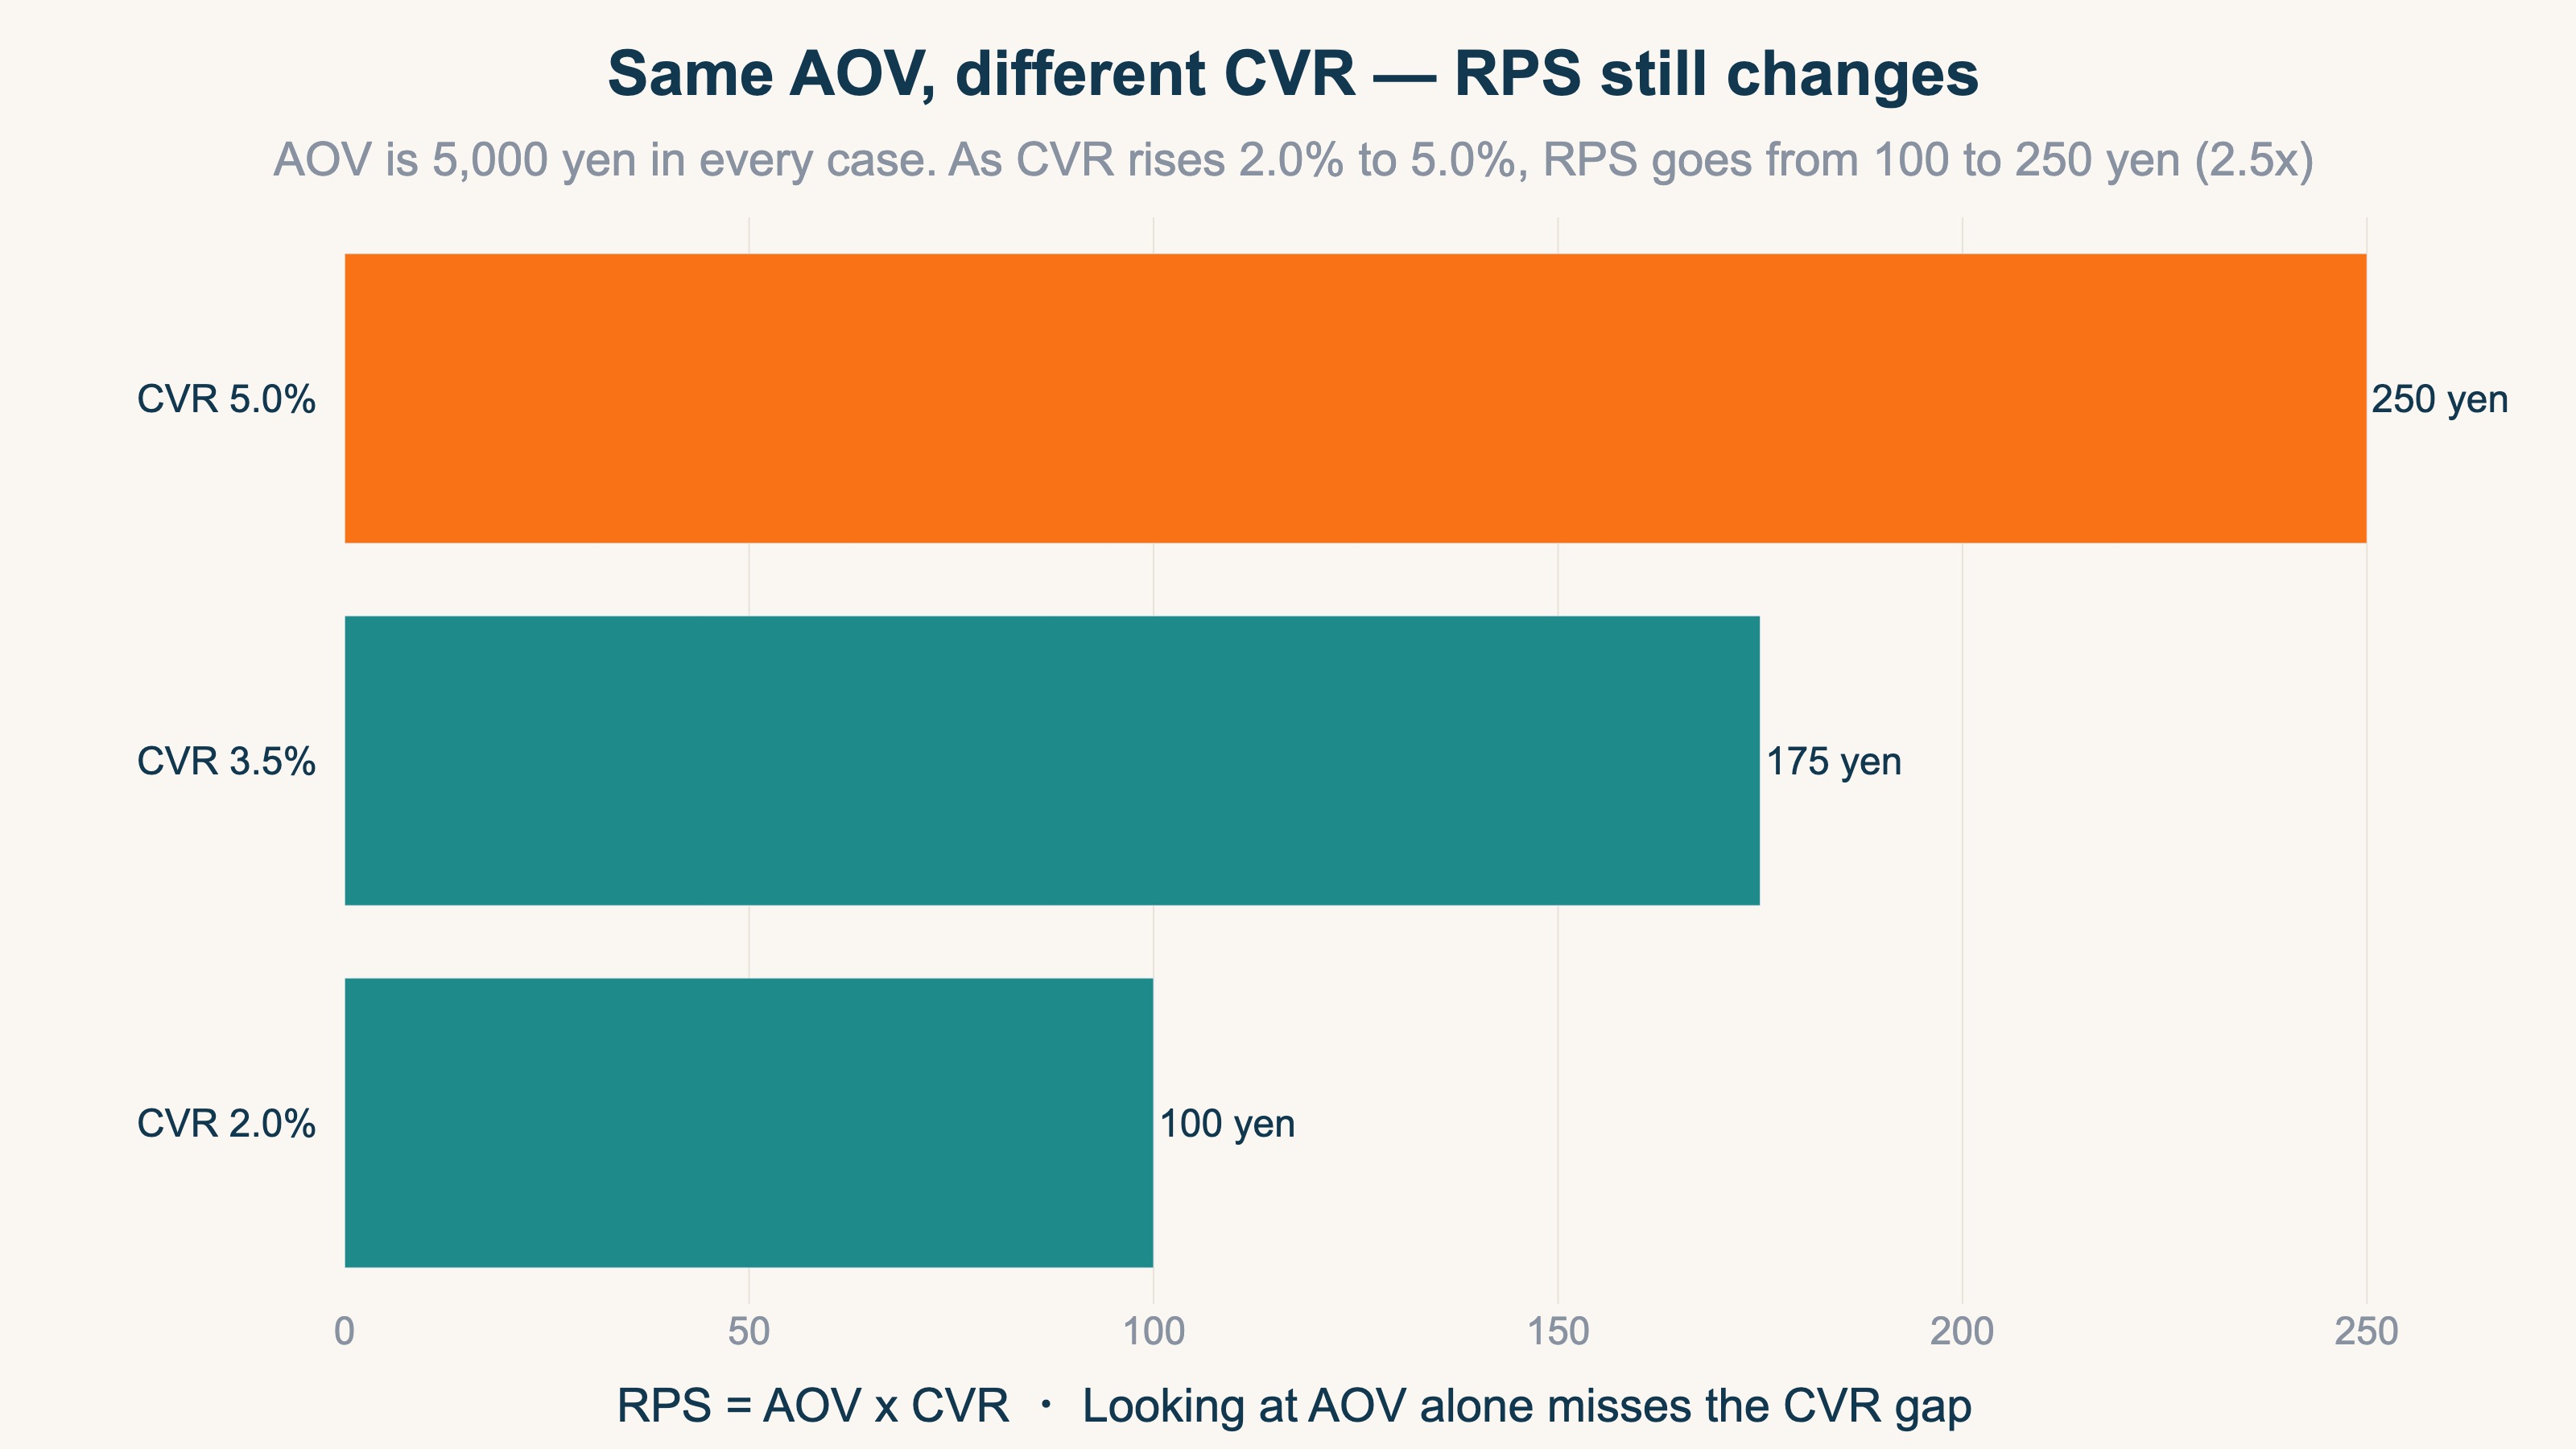
The chart above fixes AOV at 5,000 yen and varies only CVR. At a CVR of 2.0%, RPS is 100 yen; at 5.0%, it is 250 yen. With the same unit price, 2.5x the conversion rate means 2.5x the RPS. Look at AOV and conclude "our unit price is high enough," and if CVR is low, revenue per visit stays small. Only RPS reveals that gap.
But a caution is needed here. This calculation holds when you look at one channel under the same conditions. In a real channel comparison, as we will see, the share of bot traffic and the mix of new vs returning customers differ by channel. So "running AOV x CVR on a calculator" alone does not let you compare channels correctly. Section 5 looks at this in detail.
3. Which metric to use, and when#
Bottom line: use AOV for tactics that move the unit price itself, and RPS to decide channel budget allocation. Pick by what you want to measure.
AOV and RPS are not "one is better" — you pick by what you want to measure.
| What you want to see | Metric | Why |
|---|---|---|
| Effect of cross-sell / bundle tactics | AOV | These move "the value of one order" directly, so order-level AOV reflects the change cleanly |
| Budget allocation across channels / ads | RPS | Visitor quality (intent to buy) differs by channel; RPS, based on visits, compares channels on the same basis |
| Whether a pricing move lifted total revenue | RPS | AOV can rise while CVR falls, so the whole may not grow — confirm with RPS |
| Pricing and lineup design | AOV + CVR | Price hikes and premium SKUs affect both, so look at them split out |
Roughly: use AOV for tactics that move the unit price itself, and RPS to decide which channel gets the next budget. And the more a tactic moves AOV, the more you must sanity-check with RPS whether the total actually grew — which leads to the next trap.
4. The trap: raising AOV can lower RPS#
Bottom line: tactics that raise AOV can lower CVR, and then RPS actually falls. Judge a pricing move by RPS.
Tactics that raise AOV often lower conversion rate (CVR). Push the unit price up too hard and more people hesitate to buy. There are, however, tactics built to lift both at once instead of trading one for the other — see how to raise CVR and AOV together.
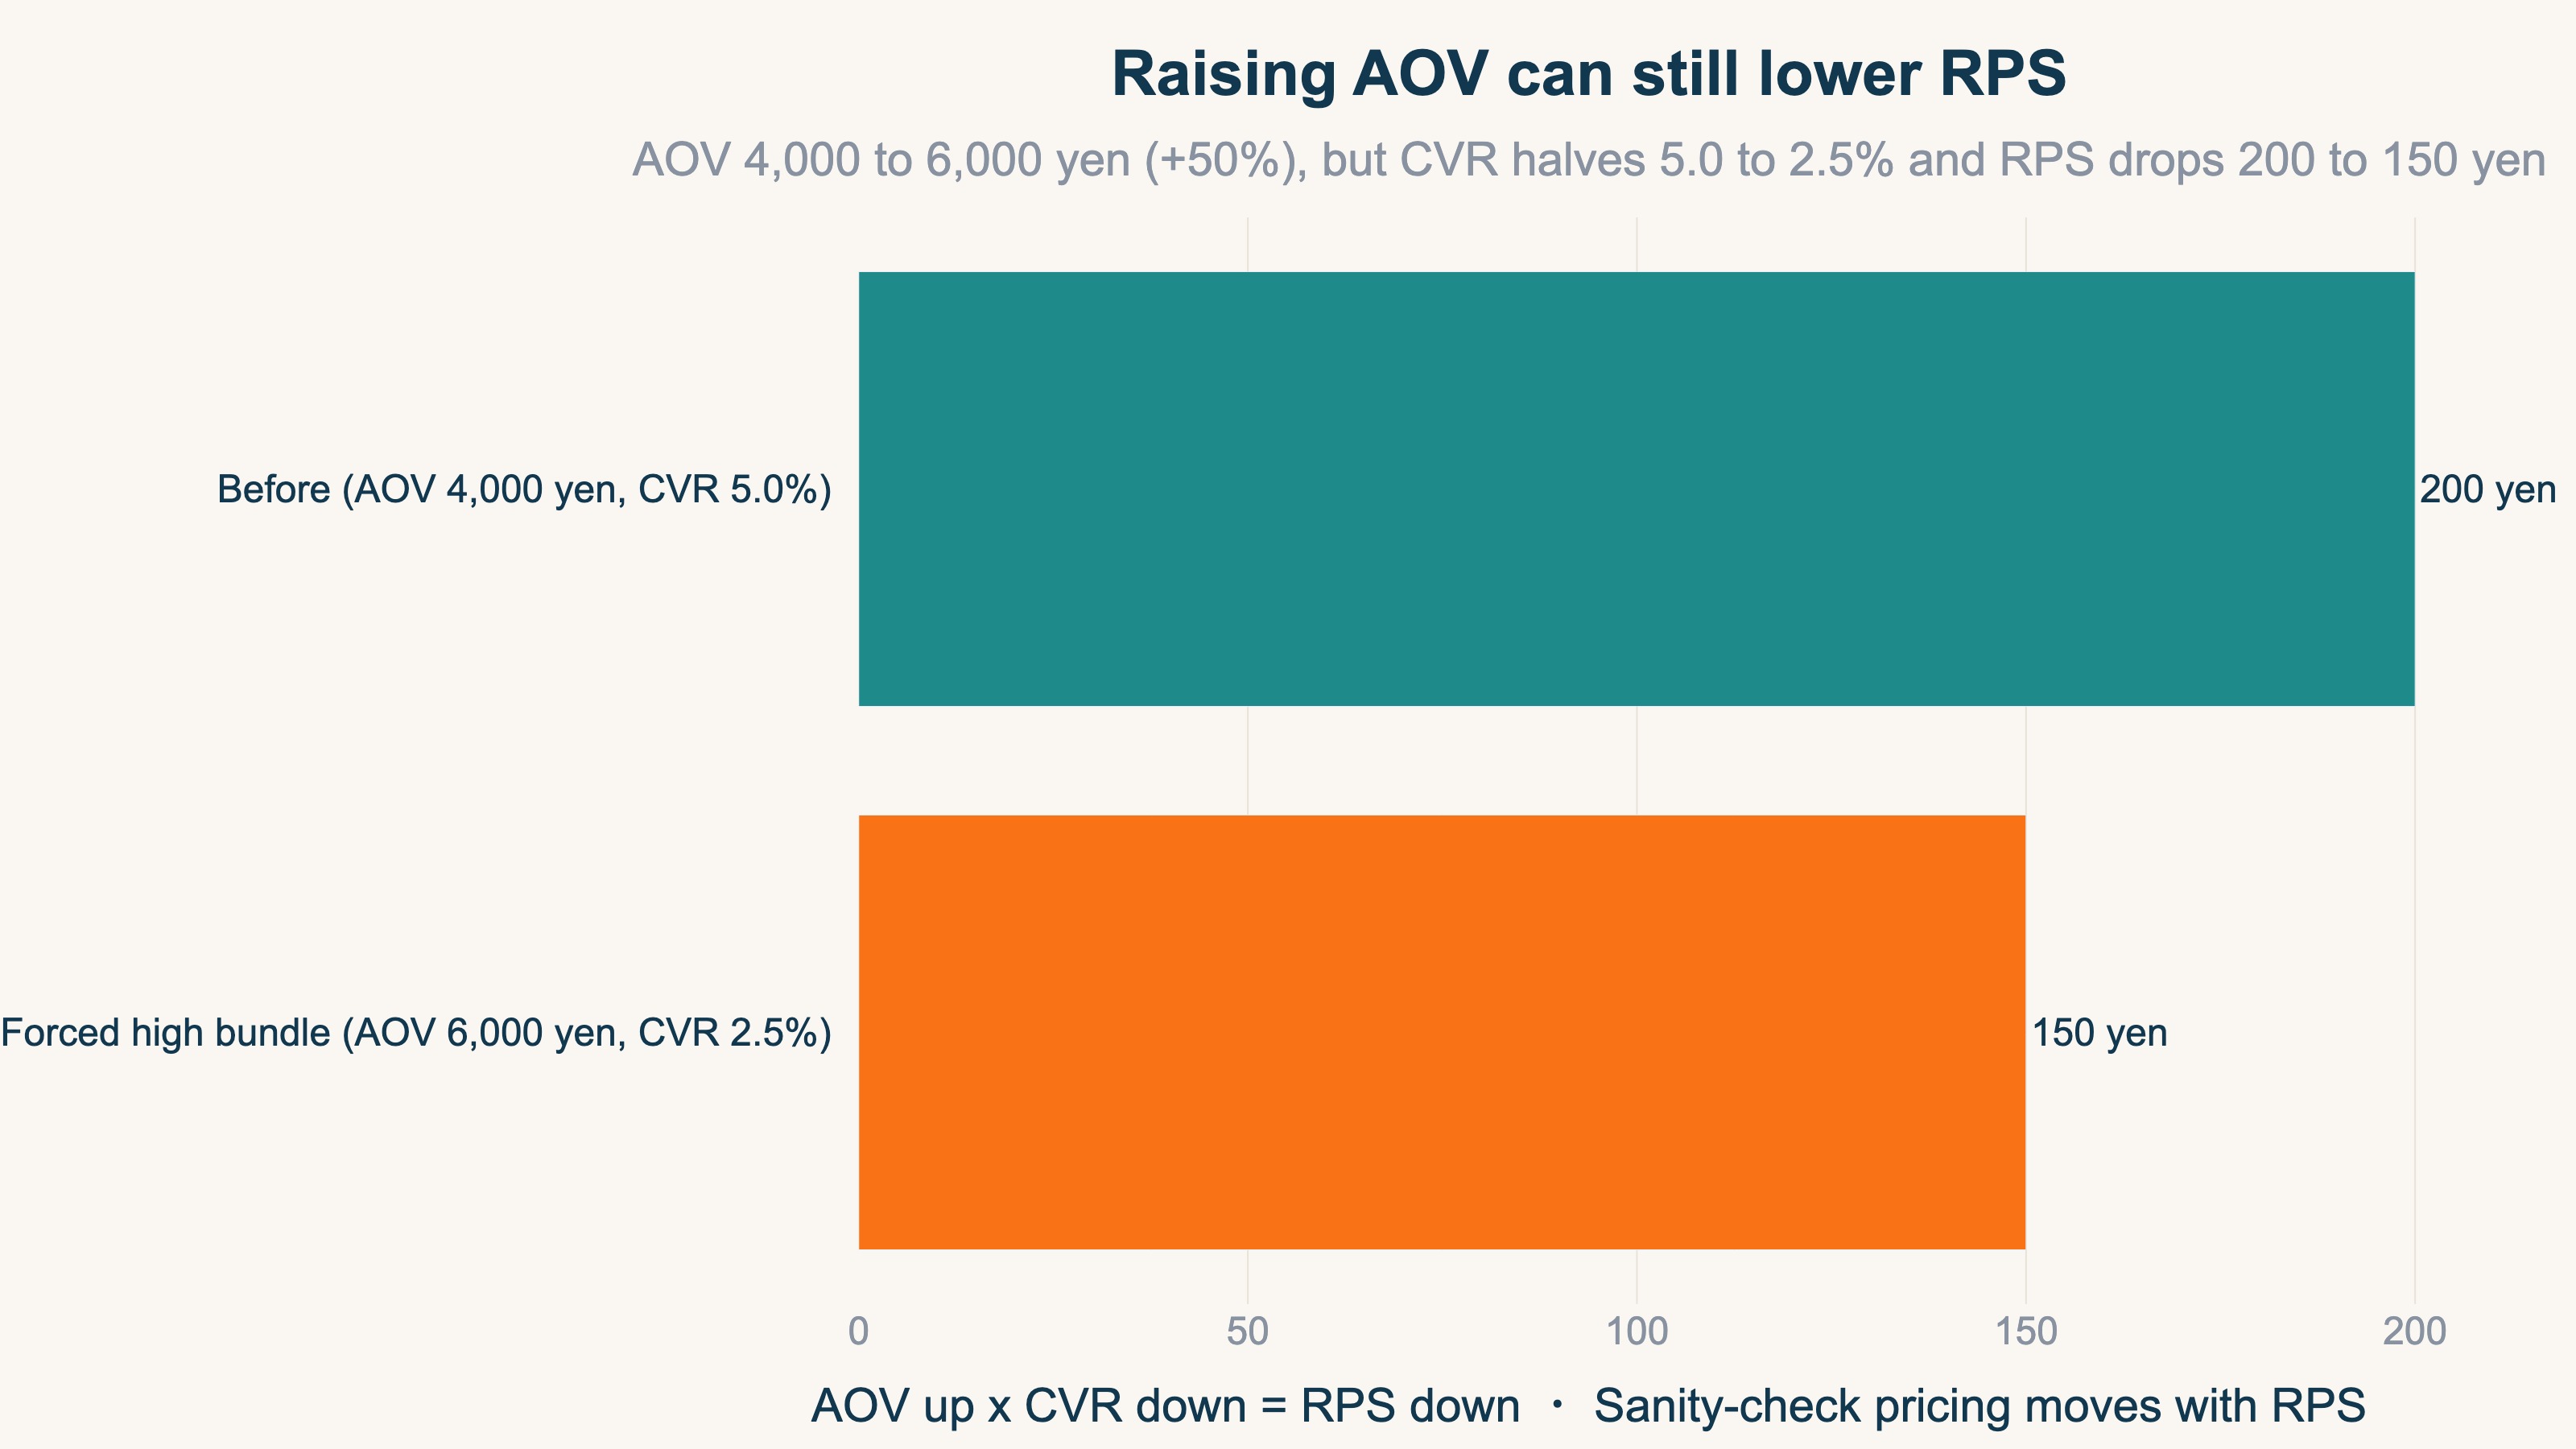
The chart above compares before and after one tactic. Before: AOV 4,000 yen x CVR 5.0% = RPS 200 yen. The store then forced a high-priced bundle, lifting AOV to 6,000 yen (+50%). But the higher hurdle cut CVR in half to 2.5%, and as a result RPS fell from 200 to 150 yen.
Watching AOV alone, this looks like a "+50% unit-price win." But by RPS, revenue per visit actually dropped. Unless you sanity-check a pricing move against RPS, paired with the CVR decline, you can mistake a revenue-losing tactic for a success. The real pass/fail of an AOV-lifting tactic is decided by RPS, not AOV.
5. Those numbers do not line up in standard GA4#
Bottom line: to allocate budget across channels you need channel-level RPS that is bot-free and split by new vs returning. Standard GA4 reports cannot line up those three things.
By now we know "judge budget allocation by RPS." So can you open GA4, line up RPS by channel, and decide the next budget move? This is where many people get stuck. GA4 shows revenue and sessions by channel, but three things you need to decide "where to invest next" do not line up out of the box.
1. The numbers are not bot-free
RPS is "revenue / sessions." If the sessions in the denominator include automated crawler (bot) traffic, sessions are inflated and RPS reads lower than reality. The tricky part is that the bot mix differs by channel. One channel may have almost no bots; another may be full of them. So the difference in bot share alone can reshuffle the RPS ranking of your channels. Standard GA4 reports do not strip out this per-channel bot share for you.
2. There is no side-by-side channel view
Budget allocation means comparing "is channel A's or channel B's RPS higher" and deciding. But standard GA4 has no column for RPS (= AOV x CVR) in the first place. AOV and CVR live in separate reports, and there is no standard view that lines them up on one screen with channels as rows and RPS as a column. You could open each channel's screens and tap a calculator to approximate it, but doing that by hand for every channel, every time, is not practical.
3. New and returning are still mixed together
Even within the same channel, new customers and returning customers have wildly different RPS and AOV. Returning customers already know the product, so they convert higher and post higher RPS. That means a "high-RPS channel" may simply be skewed toward returning customers coming back on their own. The channel that truly brings new customers gets buried in the blended average and reads low. Standard GA4 channel reports give a blended average of new and returning, so this resolution is structurally missing.
In short, the AOV x CVR formula is correct, but when you apply it to real channels to move budget, bot share and the new-customer mix differ by channel, so you cannot compare on GA4's raw numbers. The idea is simple; the heavy part is repeating, by hand, every time and across channels, the work of removing bots, splitting new vs returning, and lining up RPS. That is the wall that stands after you understand the metrics.
RevenueScope solution
Bottom line: RevenueScope lines up bot-free, channel-level RPS split by new vs returning on one screen. It gets you to "which channel should get the next budget" — where the AOV x CVR calculator cannot reach.
Misjudging by AOV alone, and failing to track how RPS moves before and after a tactic, share the root we saw in section 5: bot-free, new-vs-returning, side-by-side channel RPS is not visible together on one screen. GA4 shows AOV and CVR on separate screens and never surfaces RPS (= AOV x CVR) at all.
RevenueScope strips out bots with its own tracking, then lines up RPS, AOV, and CVR for every channel on the same screen. It computes the AOV x CVR product (= RPS) automatically, so you can compare — on the same basis — a channel with "high unit price but low revenue per visit" against one with "modest unit price but high conversion and top RPS."
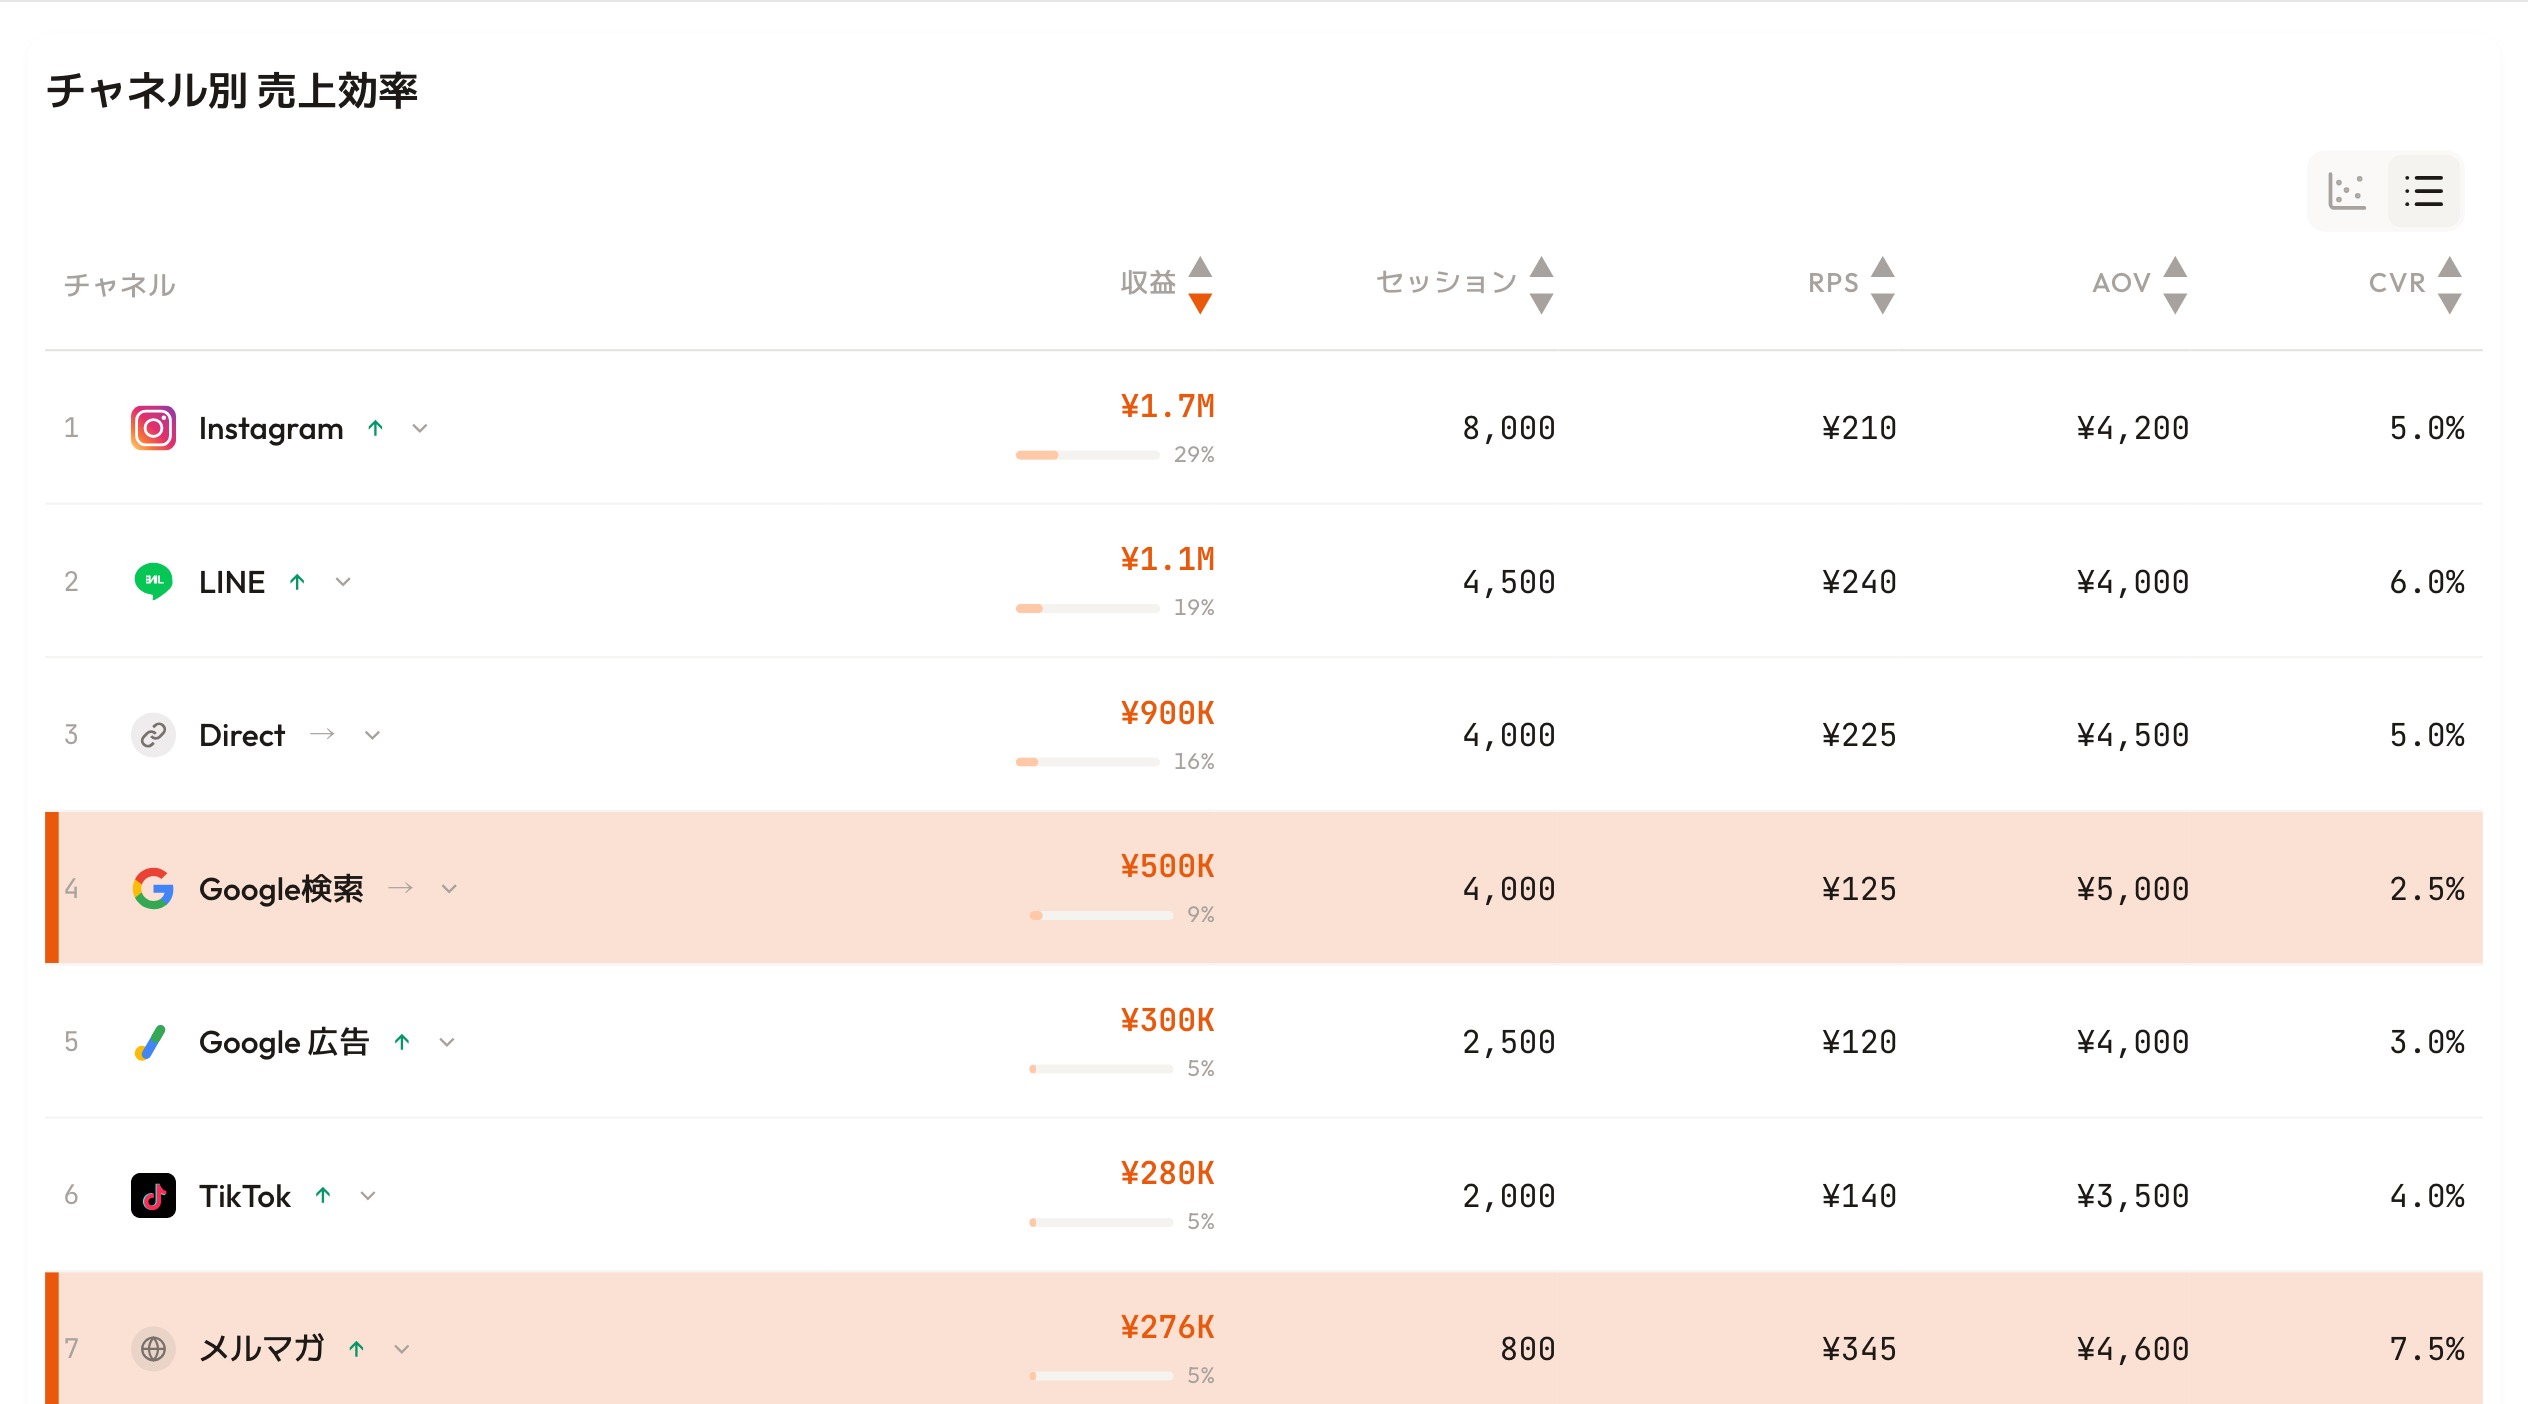
RevenueScope dashboard (demo data shown). AOV, CVR, and RPS line up on one basis, exposing the gap between unit price and revenue efficiency.
In the screen above, Google search has the highest AOV here at 5,000 yen, but its CVR of 2.5% holds RPS to just 125 yen. The email newsletter, with a slightly lower AOV of 4,600 yen, rides a 7.5% CVR to the top RPS on the screen at 345 yen. "High-AOV channel" does not mean "where to put budget," and lining AOV up next to RPS shows it instantly.
On top of that, RevenueScope also splits this channel-level RPS by new vs returning customers.
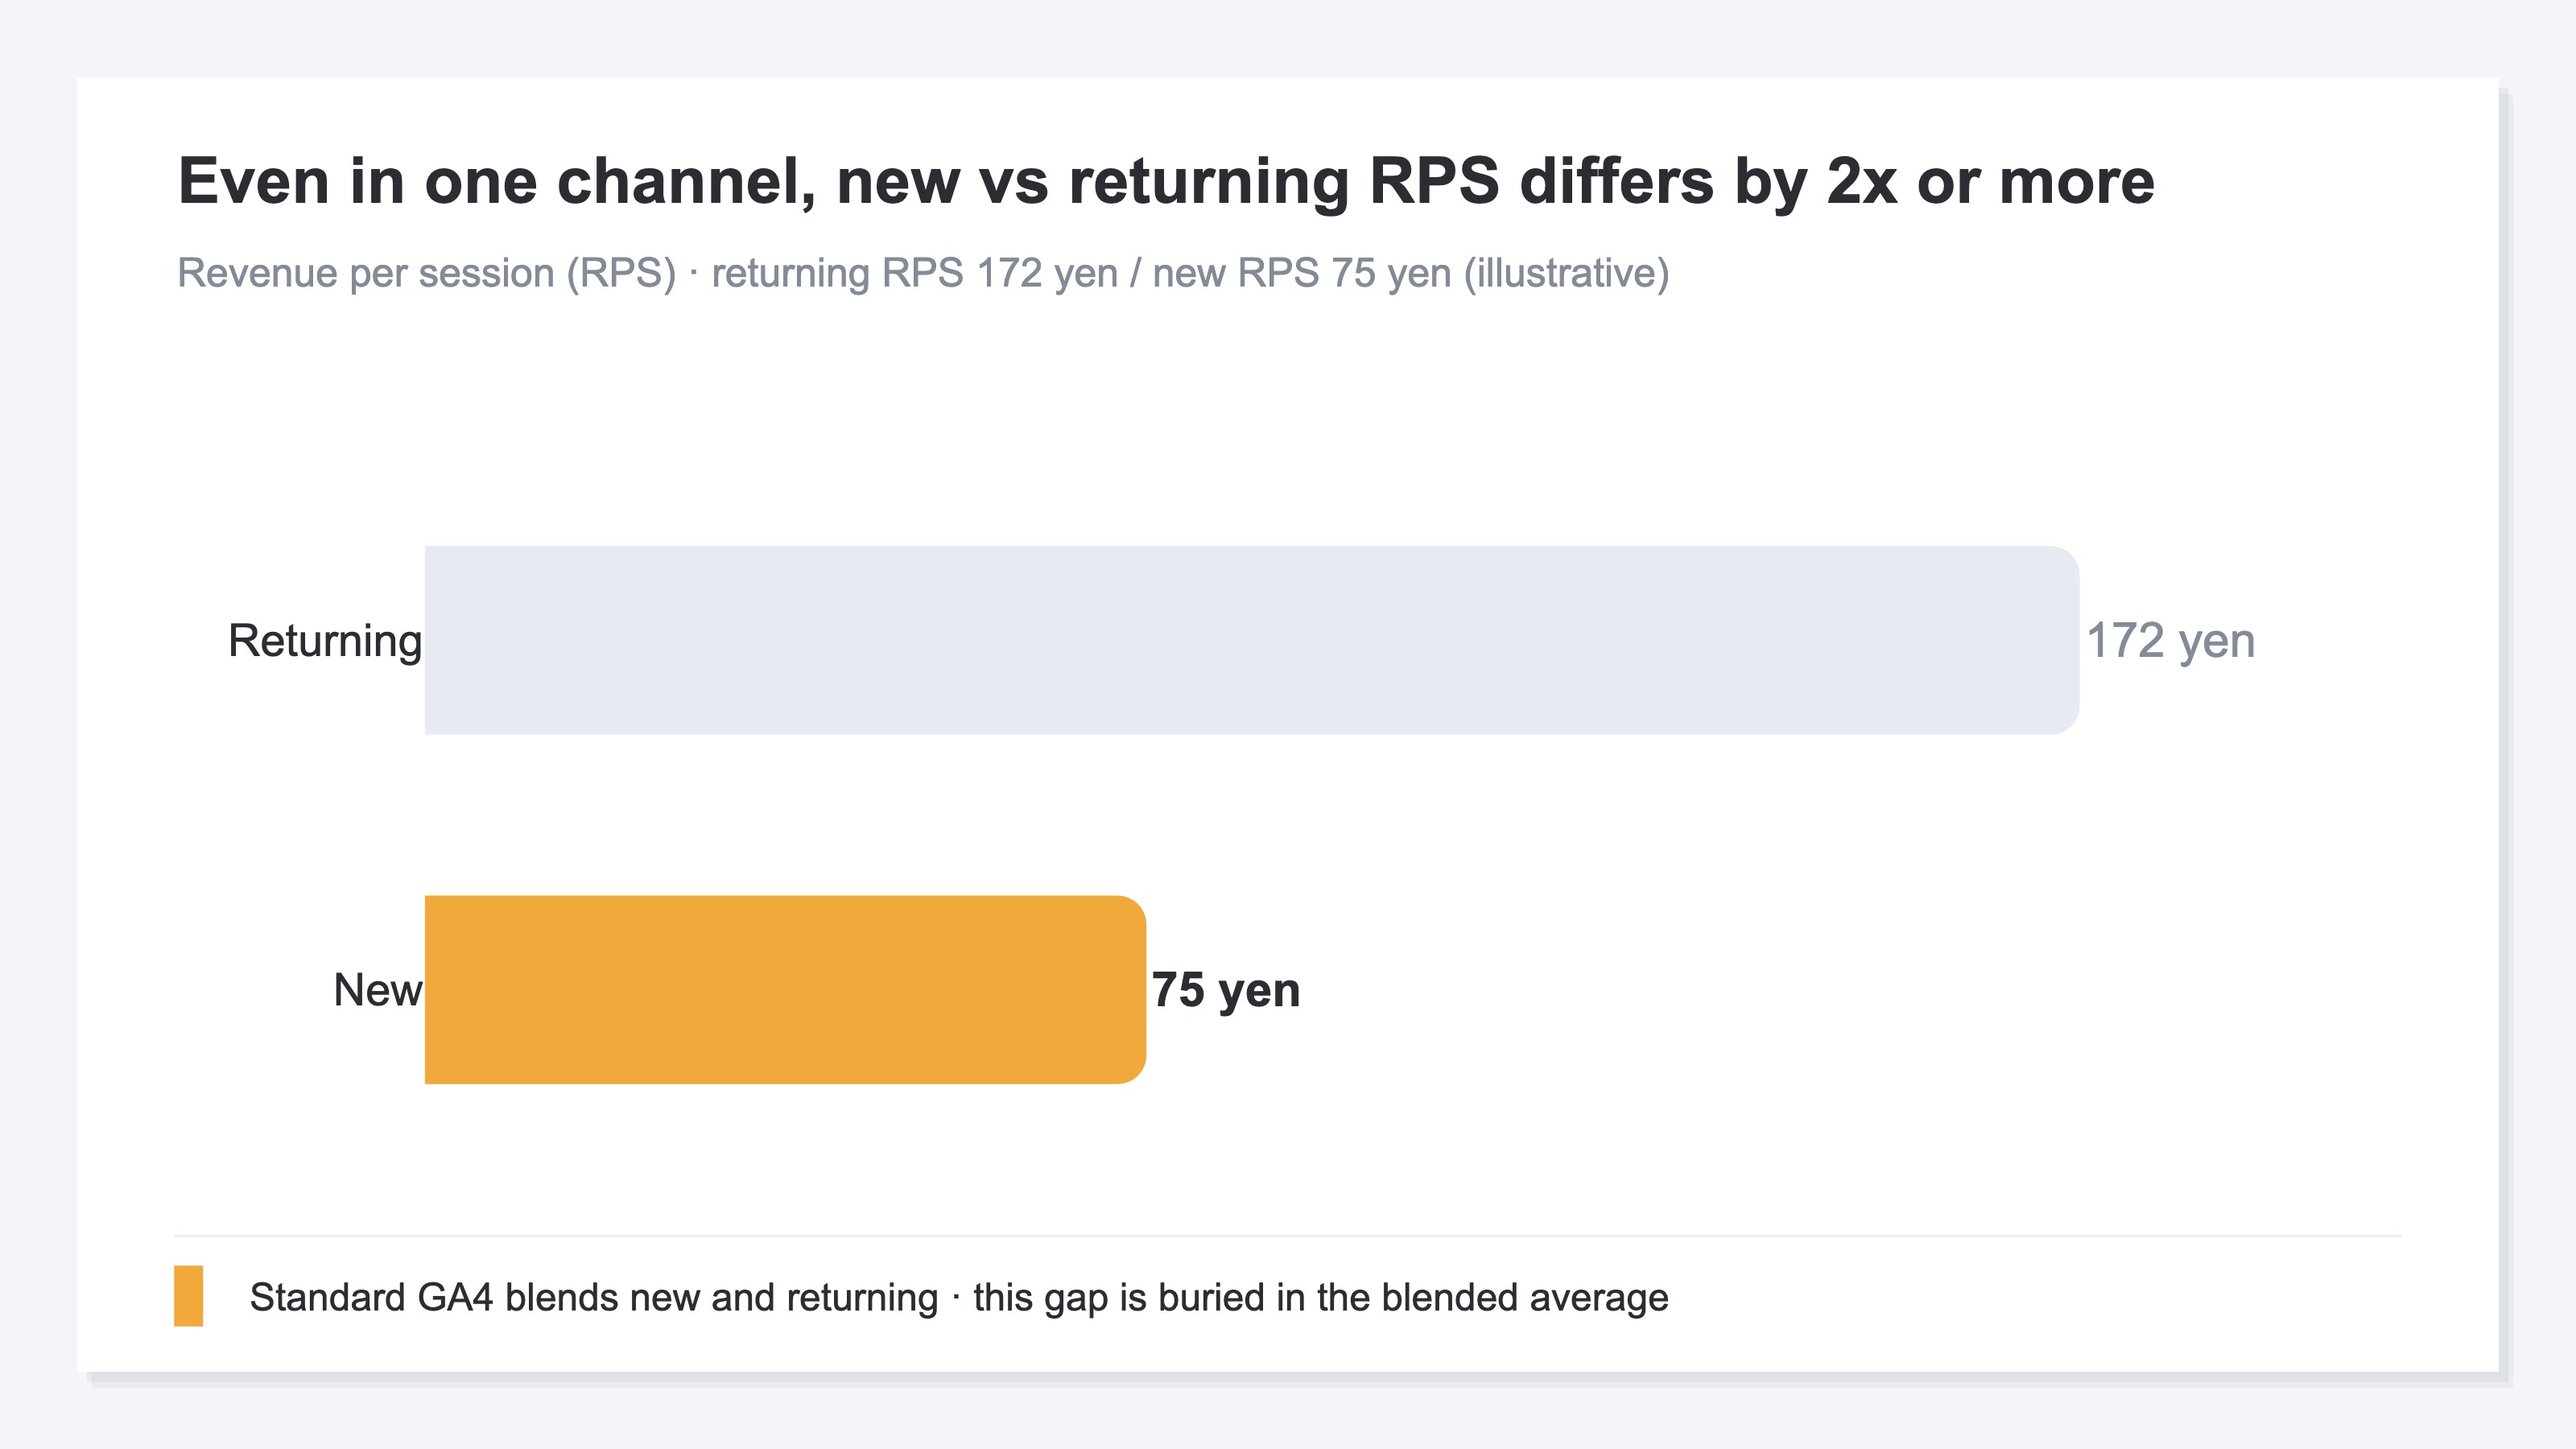
As above, even for the same visits, returning customers post RPS 172 yen and CVR 6.8%, while new customers post RPS 75 yen and CVR 2.8% — over twice the efficiency. So a channel that looks high-RPS may simply be skewed toward returning customers coming back. After removing bots, RevenueScope lines up channel-level RPS split by new vs returning, so you can separate an "efficient channel" from a "channel that brings future returning customers," and decide where the next budget goes. That is the budget-allocation move the AOV x CVR calculator cannot reach.
FAQ#
Q. RPS or AOV — which should be the KPI?
Both. They play different roles, so one is not enough. Track day-to-day pricing tactics (cross-sell, etc.) with AOV, and decide channel budget allocation with RPS. If you must pick one, RPS — which includes CVR and reflects "revenue per visit" — is closer to whole-business efficiency.
Q. Should I prioritize channels with high AOV?
AOV alone cannot decide. High AOV with low CVR still means low RPS. Rank channel priority by RPS (= AOV x CVR), and do it bot-free and split by new vs returning.
Q. Do RPS levels vary by industry?
Yes. Product price and purchase frequency move RPS a lot. In practice, tracking "is it rising?" across your own channels and periods is more useful than comparing to other companies. The basics of RPS are covered in RPS (revenue per session): the metric, formula, and how to pull it in GA4.
Conclusion#
RPS and AOV both measure revenue, but cover different ranges. Three takeaways:
- AOV is spend per buyer, RPS is revenue per visitor — the denominator (orders vs visits) changes the meaning
- RPS = AOV x CVR — look at AOV alone and you miss the CVR gap, misreading efficiency
- AOV for pricing moves; RPS for budget allocation and final checks — the more a tactic moves AOV, the more you sanity-check the total with RPS
And the most important point at the end: using the right metric is not the goal. What you really want to decide is "which channel gets the next budget." You can only make that call once channel-level RPS is lined up bot-free and split by new vs returning. The AOV x CVR calculator does not get you there. Seeing the gap between unit price and revenue efficiency on one screen, and deciding the next budget move, is where growing revenue begins.
See which ads actually drive revenue, at a glance
Free up to 5,000 sessions/month, AI analyst included. No credit card required. Up and running in 5 minutes.