The same product can sell very differently depending on how its price is shown. Cutting 1,000 yen to 980 yen can make it feel meaningfully cheaper. That is psychological pricing. This guide walks through three tactics — charm pricing, good-better-best, and anchoring — then shows how to measure their effect not by total revenue, but by the period-over-period change in revenue per session (RPS) and average order value (AOV), all with simple charts.
Table of Contents
Summary#
-
Psychological pricing moves perception, not just the number
On top of cost and competitor benchmarks, it factors in how customers feel about the price
-
Three tactics: charm pricing, good-better-best, anchoring
Charm pricing creates a sense of cheapness, good-better-best steers to the middle, and anchoring sets a reference — all moving AOV while protecting profit
-
The effect is invisible in total revenue
Total revenue moves with traffic too, so isolating a pricing change needs a different metric
-
What to watch is the period-over-period change in RPS and AOV
Compare revenue per session (RPS) and average order value (AOV) against the prior period of the same length
-
RevenueScope does not set prices. It handles the measurement
It does not set or optimize prices. It shows the post-change RPS and AOV by channel, period over period
1. What is psychological pricing: price is felt, not just calculated#
Psychological pricing means factoring in how customers feel when you set a price. The same amount can feel expensive or cheap depending on how it is shown.
You can set prices by adding margin to cost, or by matching competitors. Psychological pricing adds one more lens to these: how the customer perceives the number. The full picture of how to set prices is in our pricing strategy guide.
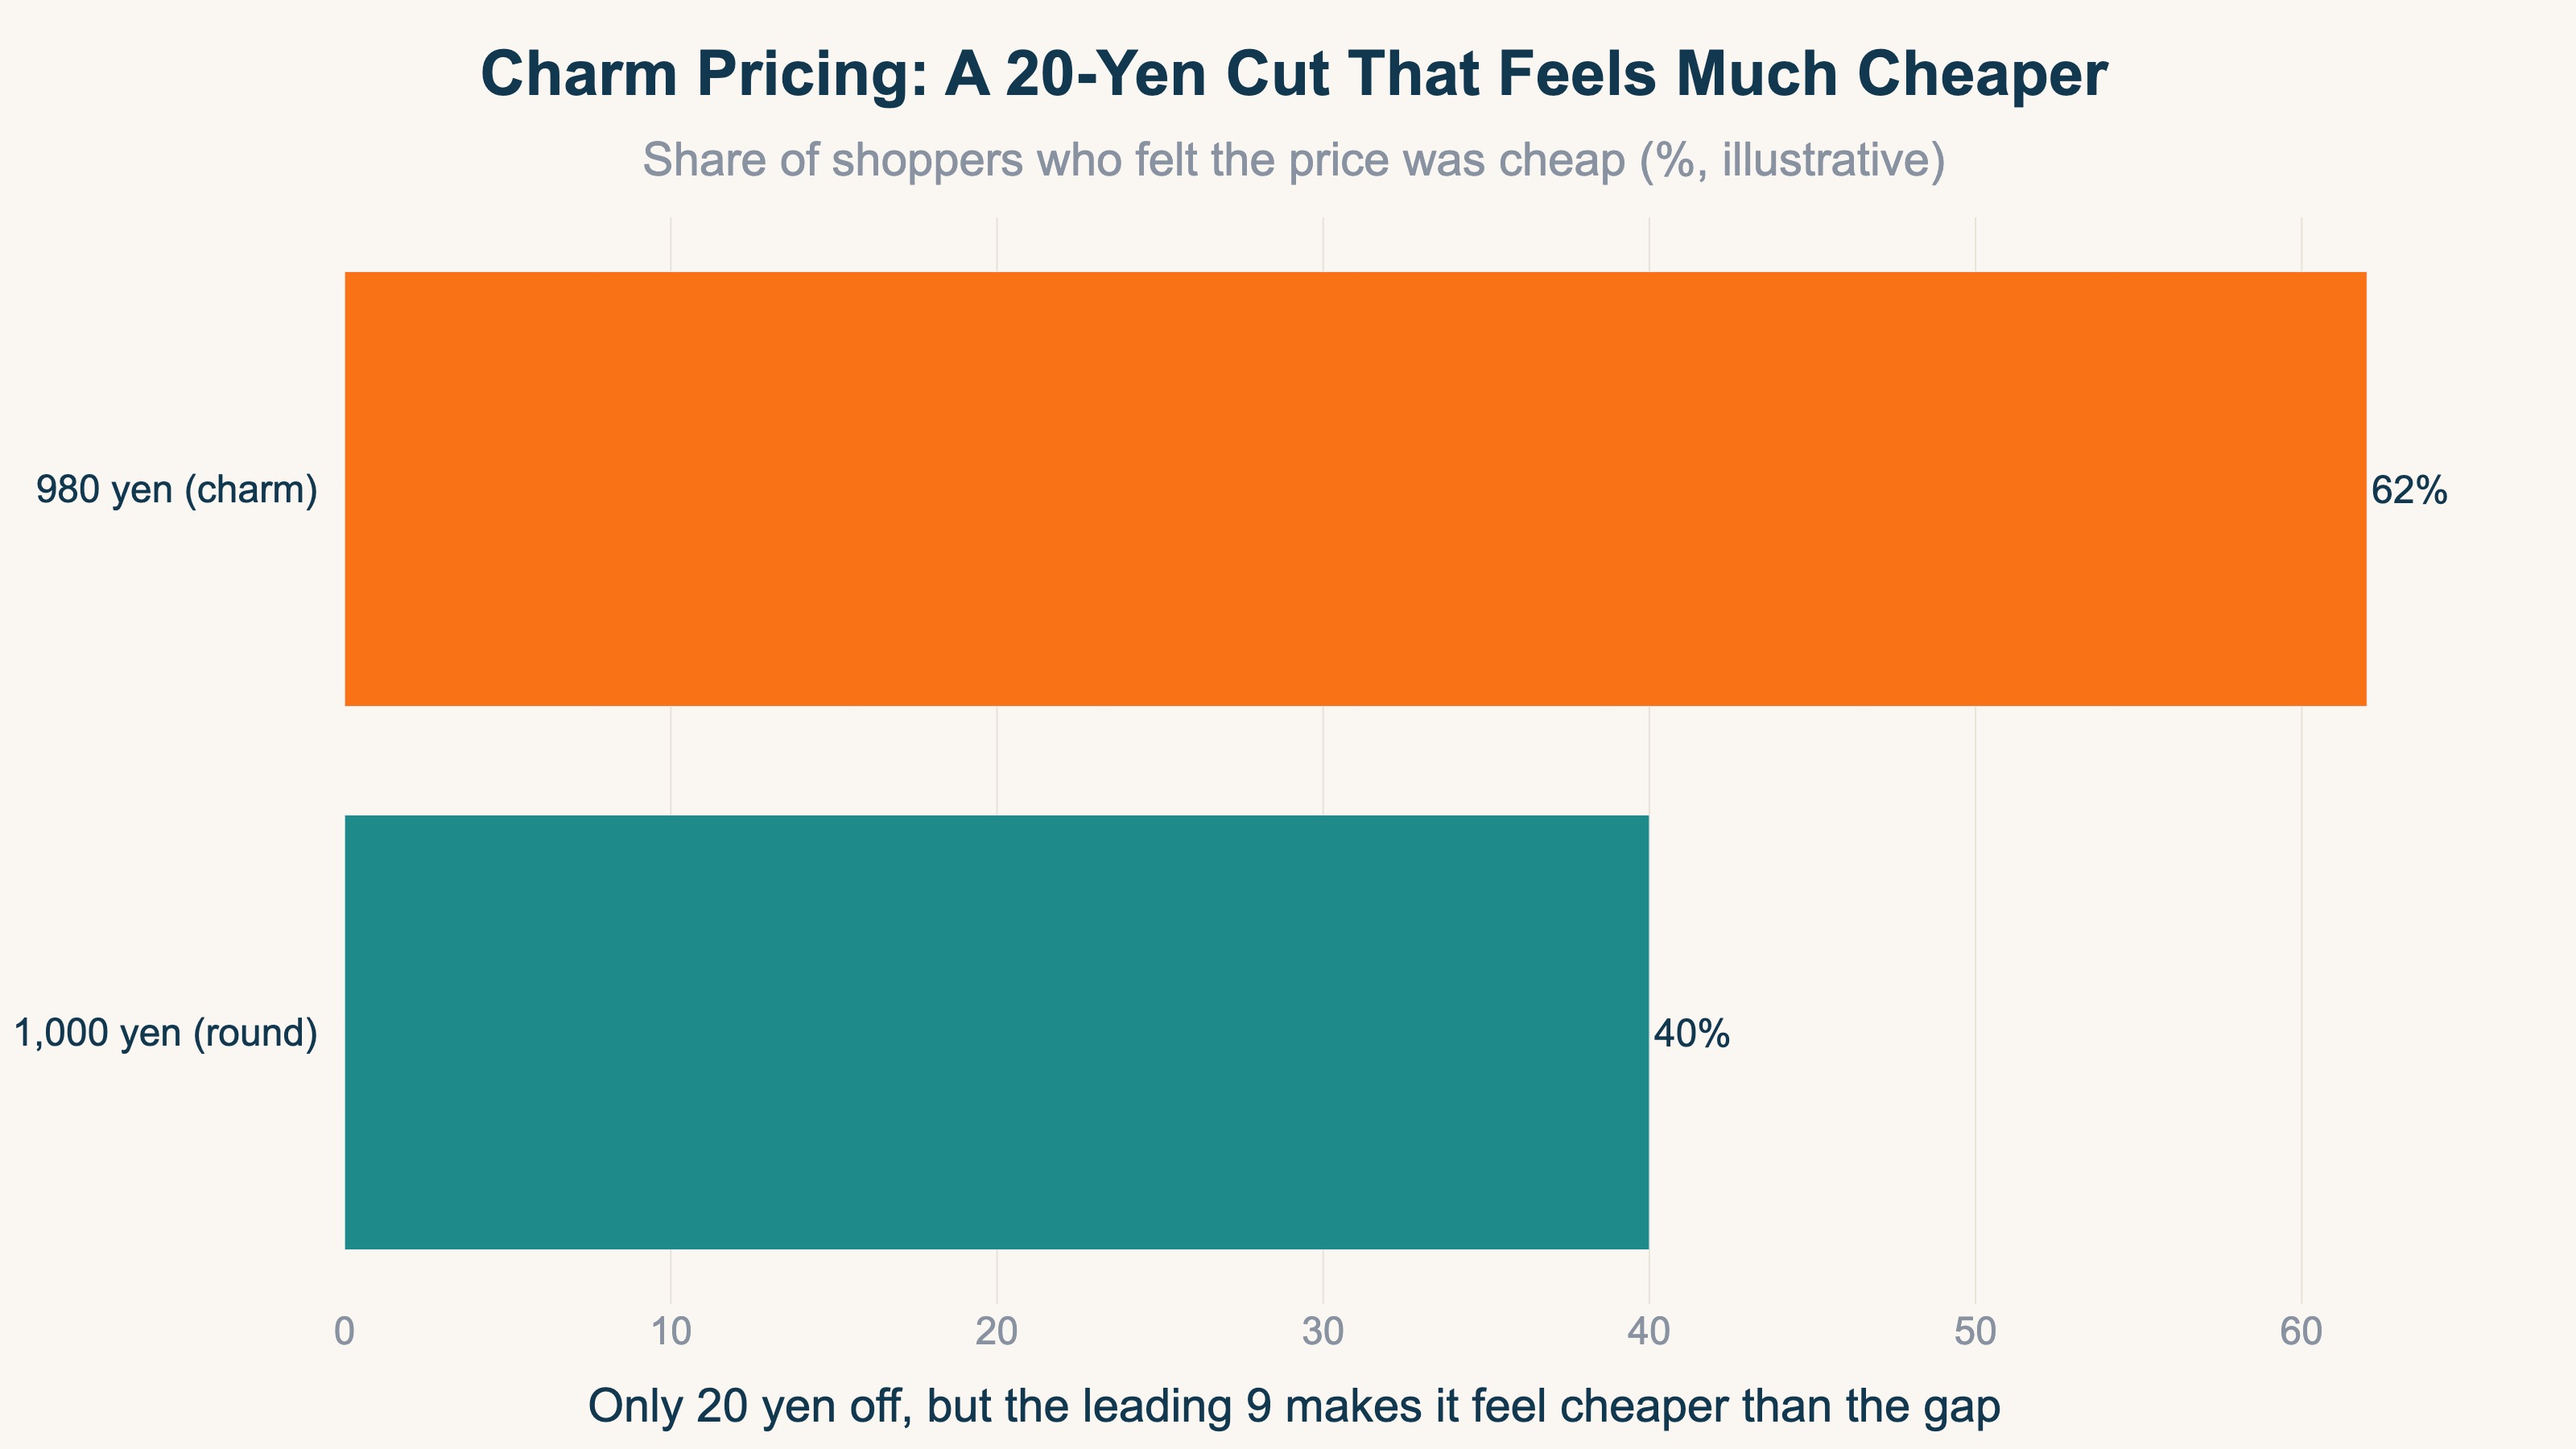
People receive prices by impression, not by calculation. 980 and 1,000 differ by only 20 yen, but the impression shifts a lot. The chart below illustrates how more shoppers feel a price is cheap once it is shown as a charm price.
Japan's EC market keeps growing, and similar products are compared more and more often [1]. So beyond simply looking cheap, the design that pays off is making the price feel "just right" while protecting profit. The next section covers the three classic tactics together.
2. Use three tactics by purpose: charm pricing, good-better-best, anchoring#
Charm pricing, good-better-best, and anchoring are three tactics with different sweet spots. They create a sense of cheapness, steer choice to the middle, and set a reference point, respectively.
Charm pricing: why 980 feels cheaper than 1,000#
Charm pricing means landing a price just below a round number — 1,000 to 980, or 2,000 to 1,980. The reason it works is that people read a price from its leftmost digit and judge "cheap or expensive" from that first figure. 1,000 leads with a "1," while 980 leads with a "9." Even though the gap is only 20 yen, the change in the leading digit makes it feel cheaper than the real difference.
It is not universal, though. For luxury or trust-driven products, a 980-style price can look cheap in a bad way. It works well for everyday goods and easily compared items, while premium brands often suit round numbers — so use it selectively.
Good-better-best: steering choice to the middle#
With only two options, people tend to pick the cheaper one. So you deliberately add a higher option. Lay out three tiers — best (high), better (middle), good (low) — and most people choose the middle. With the "best" present, the middle is no longer the most expensive choice, and the instinct to avoid extremes makes it look "just right." The "best" may not sell much itself, yet it lifts the middle.
The trick is to put the product you actually want to sell in the middle, and to set the "best" clearly higher. If the gap is small, it will not work as a foil. Good-better-best pairs well with bundles and sets, lifting AOV. The thinking is covered in our cross-selling guide.
Anchoring: setting a reference with the first price#
People use the first number they see as an "anchor" and judge later prices against it. Show a high price first, and when the actual price is lower, it feels like a strong deal. A common pattern is a list price with a strike-through above the selling price. "12,000 yen → 8,000 yen" makes the 8,000 feel cheaper than it would on its own.
One caution: do not use a fake list price. Striking through a price you never intended to sell at is a dual-price-display problem under Japan's Act against Unjustifiable Premiums and Misleading Representations [2]. Use only genuine anchors — a price actually charged before, or a real higher-tier plan.
Good-better-best and anchoring both push up the per-order amount (AOV). The chart below illustrates how AOV moves when the prior presentation is indexed to 100.
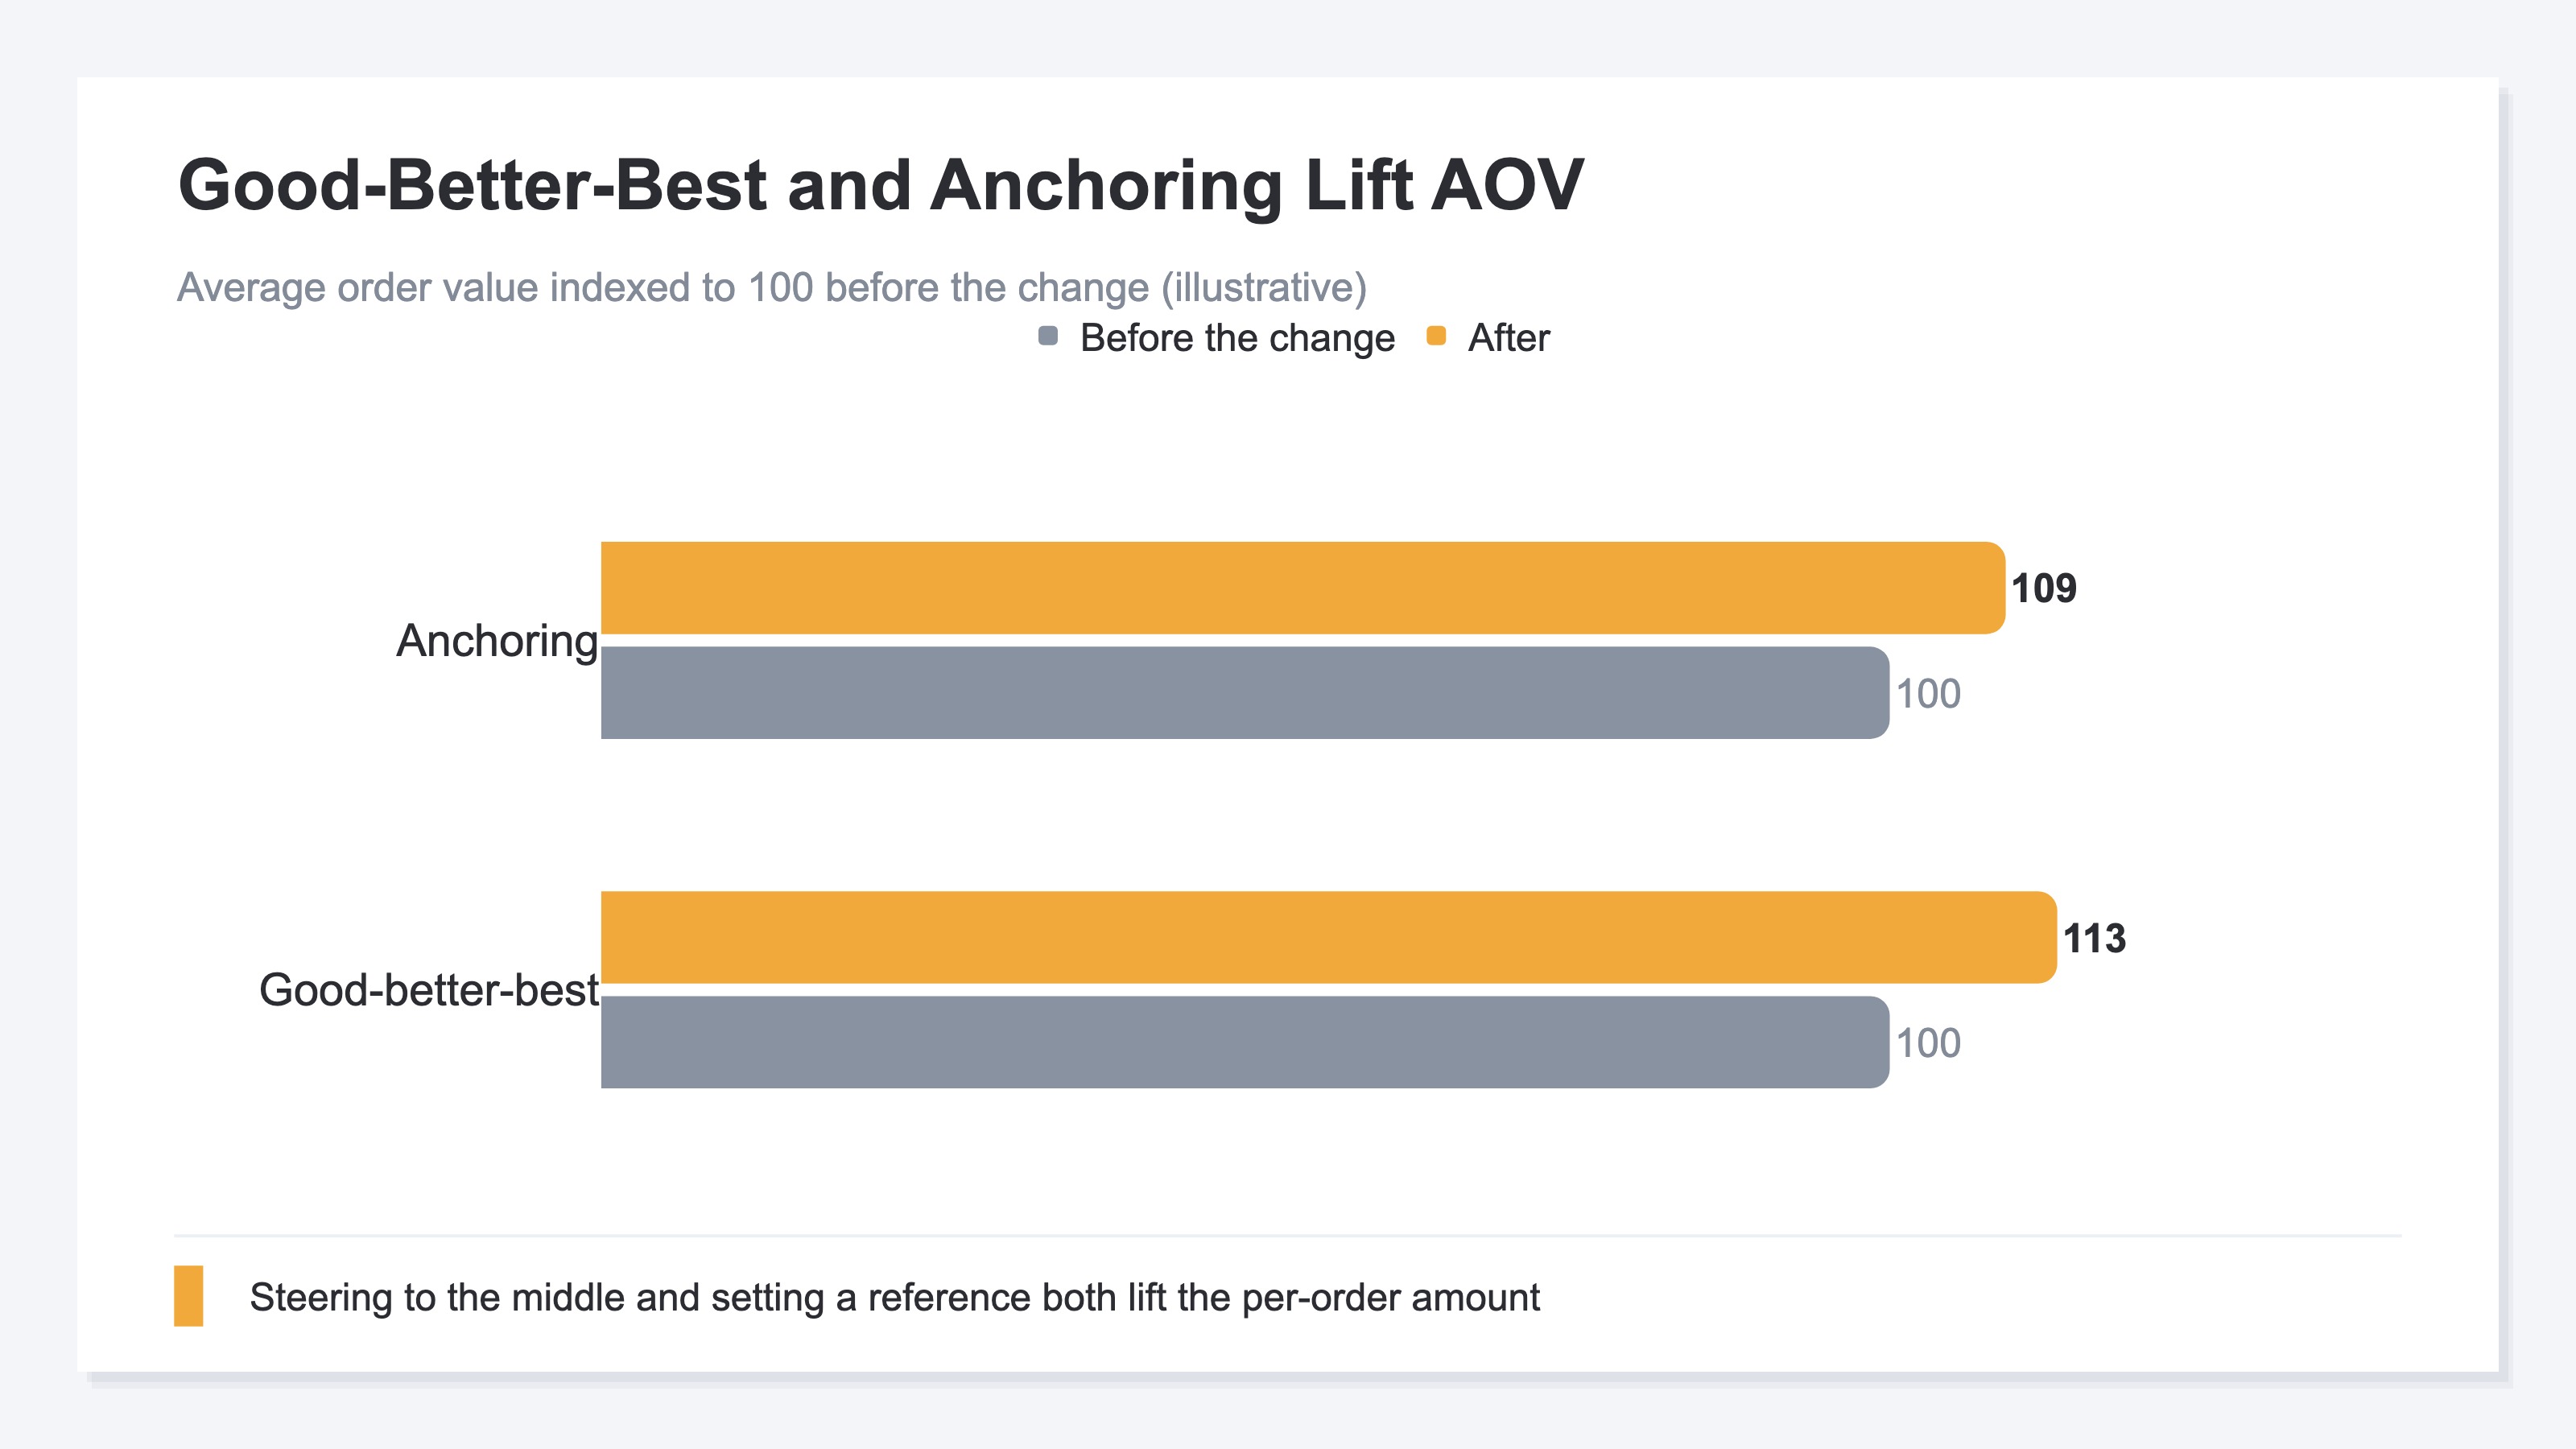
These are different from discounting. A discount cuts the list price itself and eats into profit, while psychological pricing shapes perception through presentation, so it is easier on profit. Discount design is covered in how to set discounts. For AOV itself, our average order value (AOV) basics guide also helps.
3. Measure the effect with RPS and AOV, not total revenue#
Measure a presentation change with RPS and AOV, not total revenue. Total revenue moves with traffic too, so on its own it cannot isolate the pricing effect.
After trying charm pricing or good-better-best, judging success by "sales went up" is risky. Total revenue moves not only with the pricing effect but also with that period's traffic. If you happened to raise ad spend, the pricing effect hides inside the traffic.
So use two metrics. One is AOV (average order value) = revenue ÷ orders, which shows whether good-better-best or anchoring lifted the per-order amount. The other is RPS (revenue per session) = revenue ÷ sessions, which captures whether charm pricing lifted conversion too, as revenue per visit. The thinking behind RPS is in our RPS guide.
There is a knack to the comparison. Rather than splitting before and after with an arbitrary A/B test, the simplest and most reliable first step is to compare against the prior period of the same length. The chart below illustrates how RPS moved by channel after a display change, period over period. With the same tactic, some channels rise while others fall below the prior period.
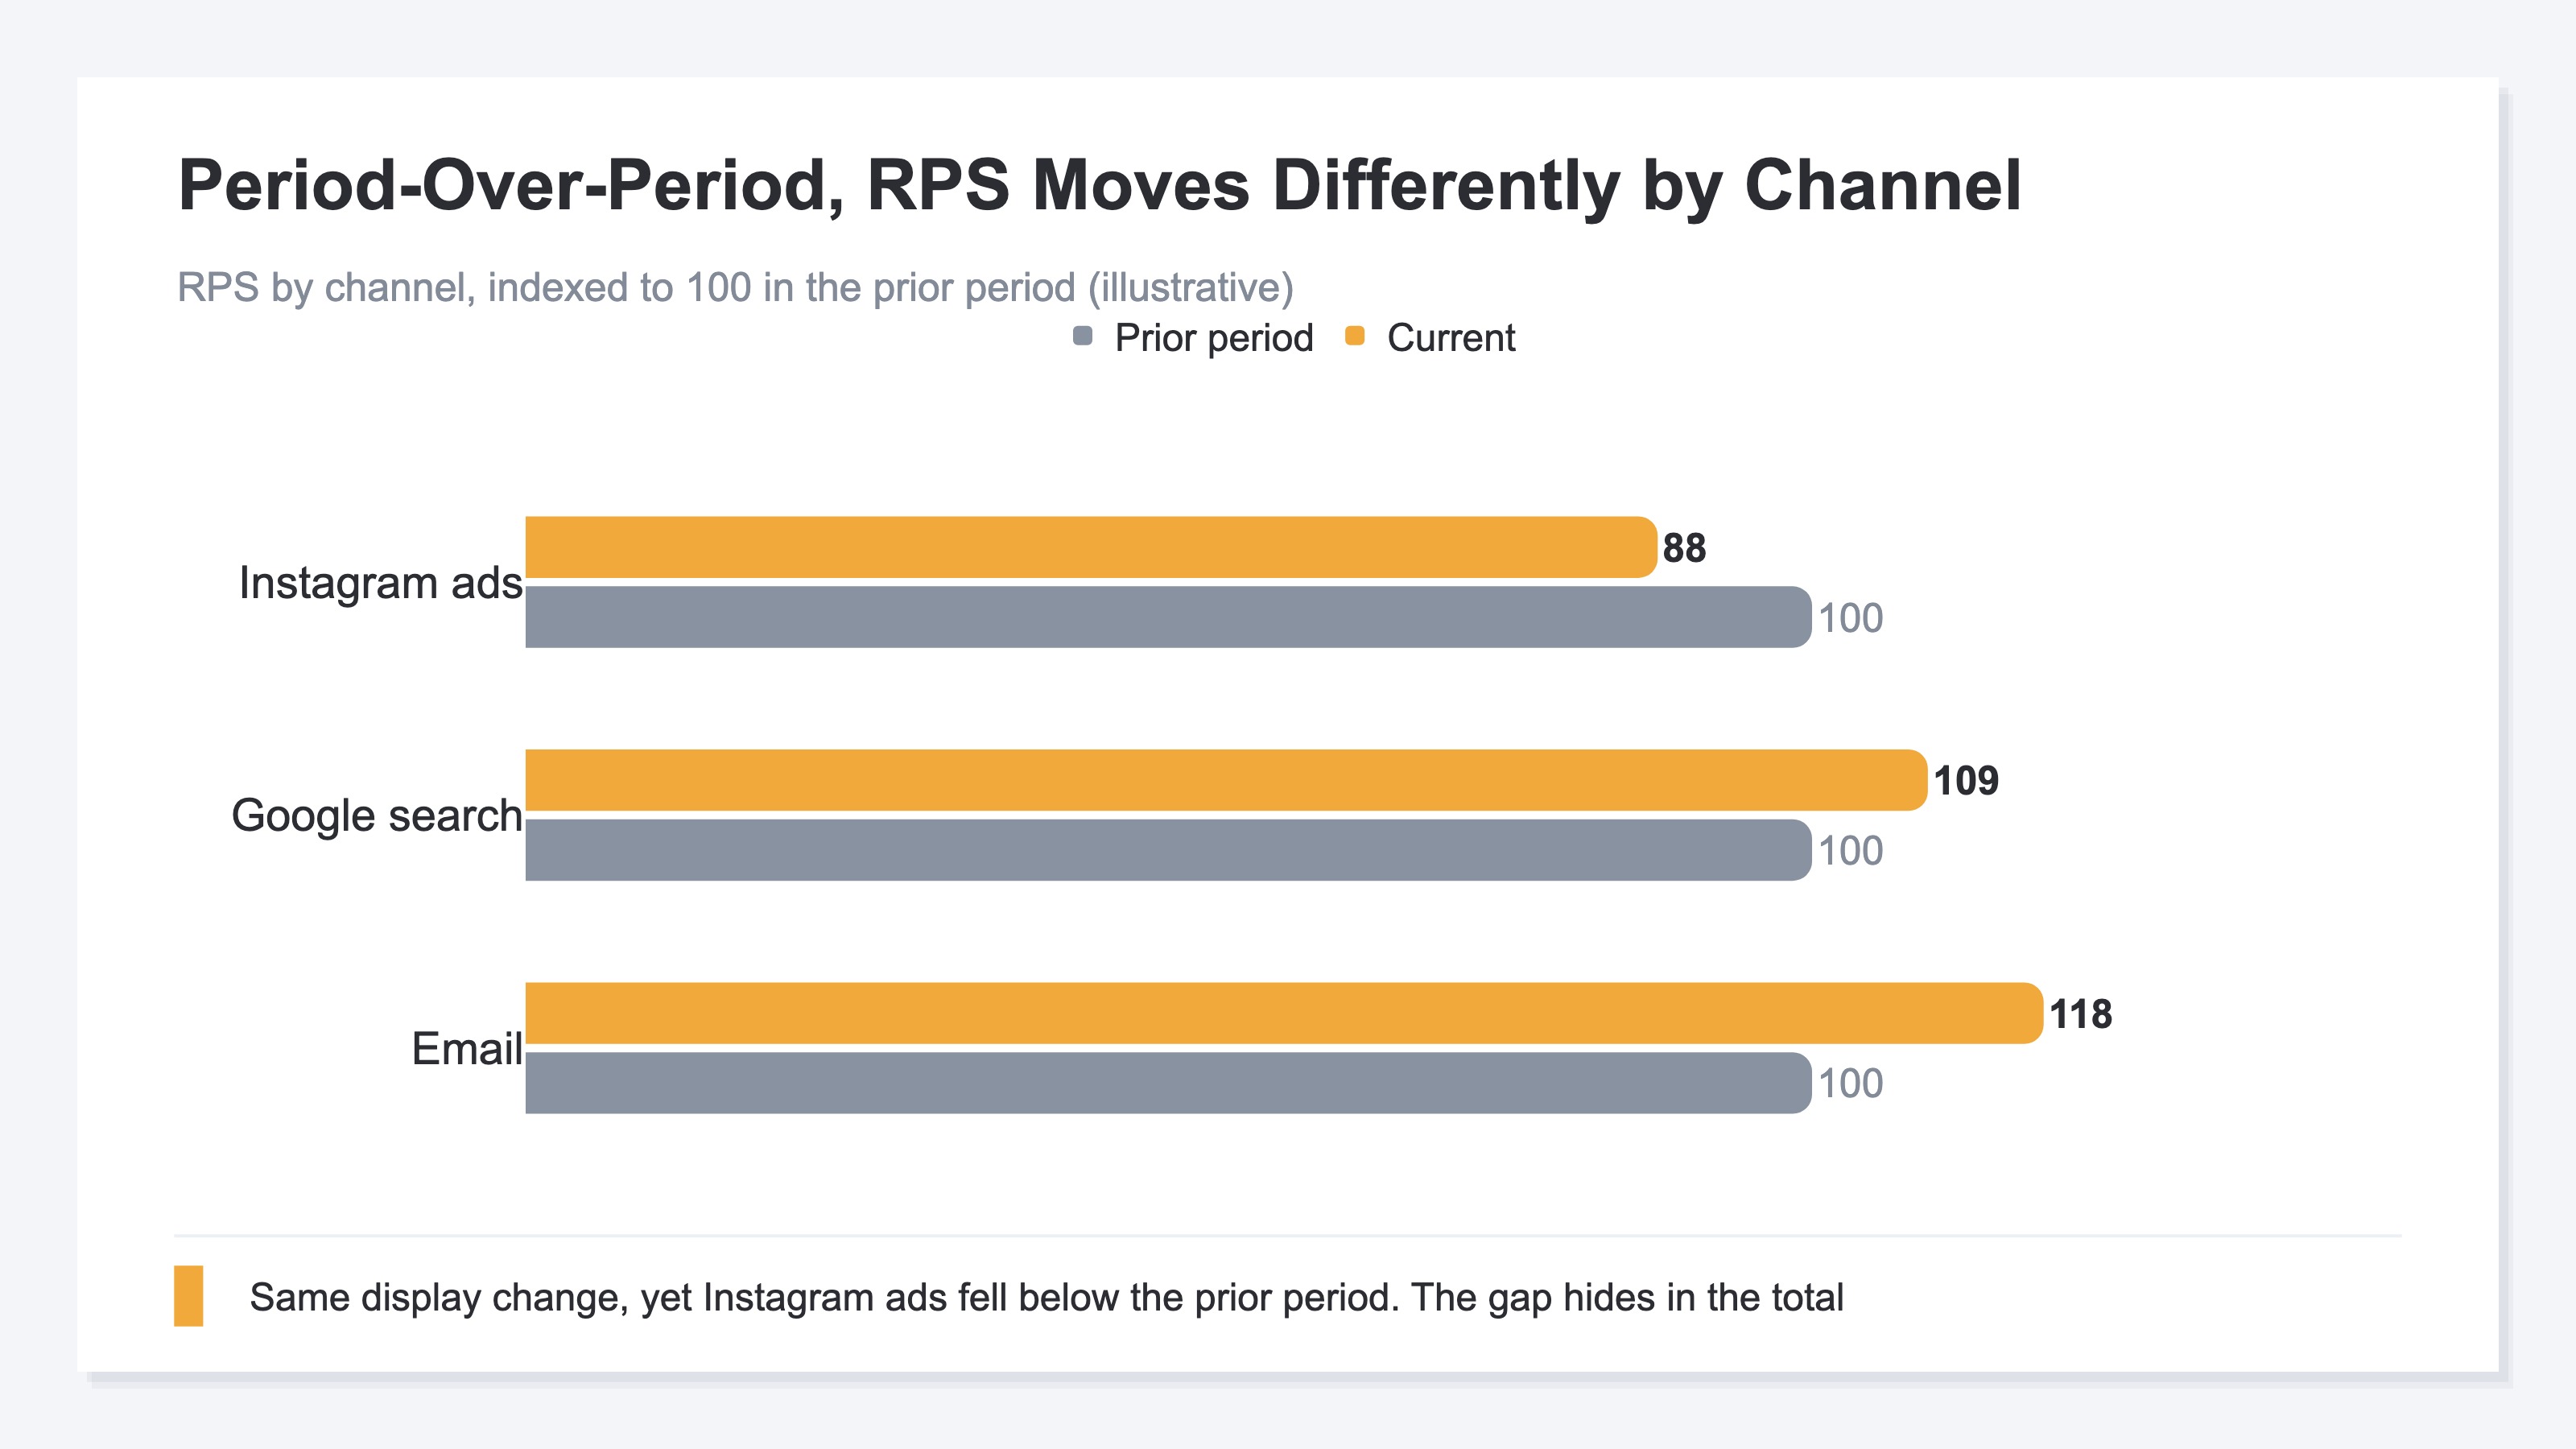
The snag is that GA4 makes this split tedious. GA4 is built around visits (sessions), so comparing how RPS moved by traffic source after a pricing change — period over period — becomes a manual reassembly job.
RevenueScope solution
Let us see how "isolate the effect with the period-over-period change in RPS and AOV, not total revenue" actually looks. RevenueScope takes GA4 and your site's revenue data and lays out the post-change revenue efficiency by channel on one screen. The metrics it shows are RPS (revenue per session), AOV (average order value), and CVR (conversion rate) — each with its period-over-period change.
Ask "Which channels lifted RPS after I changed the price display?" and it answers like this.
| Channel | RPS (revenue per session) | RPS change | AOV | CVR |
|---|---|---|---|---|
| ¥320 | +18% | ¥4,000 | 8.0% | |
| Google search | ¥210 | +9% | ¥3,500 | 6.0% |
| Instagram ads | ¥95 | −12% | ¥5,300 | 1.8% |
(Illustrative of how it looks by channel in RevenueScope. Figures are demo data.)
Reading this list, the pricing effect shows up split by channel. Email is +18% in RPS period over period, while Instagram ads are −12%. A gap that would hide in total revenue becomes clear in the per-visit, period-over-period view. The next move is obvious: shift budget to email and Google search, which gained efficiency, and pause the increase on Instagram, which fell below the prior period.
There is an important boundary here. RevenueScope does not set or optimize prices. Whether to use a charm price, or how to build a good-better-best ladder, is for the operator to decide. What RevenueScope handles is measuring the effect after a price change: it returns overall RPS, AOV, and CVR period over period (get_summary), and the channel breakdown of which sources rose, from a revenue-first view. Think of it not as a tool that sets prices, but as one that confirms the result of your decision with numbers.
FAQ#
Q. Should charm prices always end in "8," like 980?
A. There is no rule. What matters is dropping the leading digit by one. Whether 980 or 990, landing just under a round number shifts the first figure to "9." Whether 8 or 9, the shared aim is to land just below a round number so the leading digit changes.
Q. Can't I just judge a pricing change by total revenue?
A. Total alone cannot tell you. It moves with that period's traffic too, so the pricing effect hides inside it. Compare revenue per session (RPS) and average order value (AOV) against the prior period of the same length, and you can isolate just the pricing effect.
Q. Can RevenueScope find the optimal price?
A. No. RevenueScope does not set or optimize prices. It outputs post-change RPS, AOV, and CVR, with their period-over-period change and channel breakdown. The operator decides how to present prices, and RevenueScope handles measuring the effect.
Summary#
Price sells less by the number itself than by how it is felt. Change the leading digit with charm pricing, steer choice to the middle with good-better-best, and create a sense of value with anchoring. These three move AOV while protecting profit.
The crucial part is not judging the effect by total revenue. Total moves with traffic, so read the pricing effect in the period-over-period change of revenue per session (RPS) and average order value (AOV). Once you can compare which channels gained efficiency period over period, you can put psychological pricing to work in the right order — change the presentation, then confirm it with numbers.
See which ads actually drive revenue, at a glance
Free up to 5,000 sessions/month, AI analyst included. No credit card required. Up and running in 5 minutes.