Hand out a coupon and orders jump. Run a sale and that day the receipts pile up. So this promotion was a success. When you run an online store, it's easy to judge a promotion by "units sold." Japan's online retail market keeps growing year over year [1], and how well you handle coupons and sales increasingly moves revenue.
But the first thing this article wants to say is a slightly different view. More units sold (more orders) doesn't mean revenue, or revenue per customer, went up too. It's not unusual for a discount to lift only the unit count while revenue stays flat. In fact, one small shop deliberately raised its prices and lost about 30% of its customers, yet revenue went up. Units and revenue are two different things. This article walks through, step by step, how to measure coupon and sale effectiveness by revenue, average order value (AOV), and conversion rate (CVR) rather than units sold, and how to compare campaigns to spot which promotion actually worked.
Table of contents
Key takeaways#
- Judging coupon and sale effectiveness by "units sold (order count)" alone leads you astray. A discount easily lifts the unit count, but it lowers the value of each order — so units can rise while revenue stays flat.
- Measure the effect by three figures: revenue, average order value (AOV, the average revenue per order), and conversion rate (CVR, the share of visitors who bought). These three reflect "did revenue actually grow?" more honestly than the single figure of unit count.
- And looking at site-wide totals won't tell you which promotion worked. Only when you split by campaign — coupon A, sale B, regular sales — and compare revenue, AOV, and CVR side by side does the next move become clear.
1. Units sold can't measure the effect#
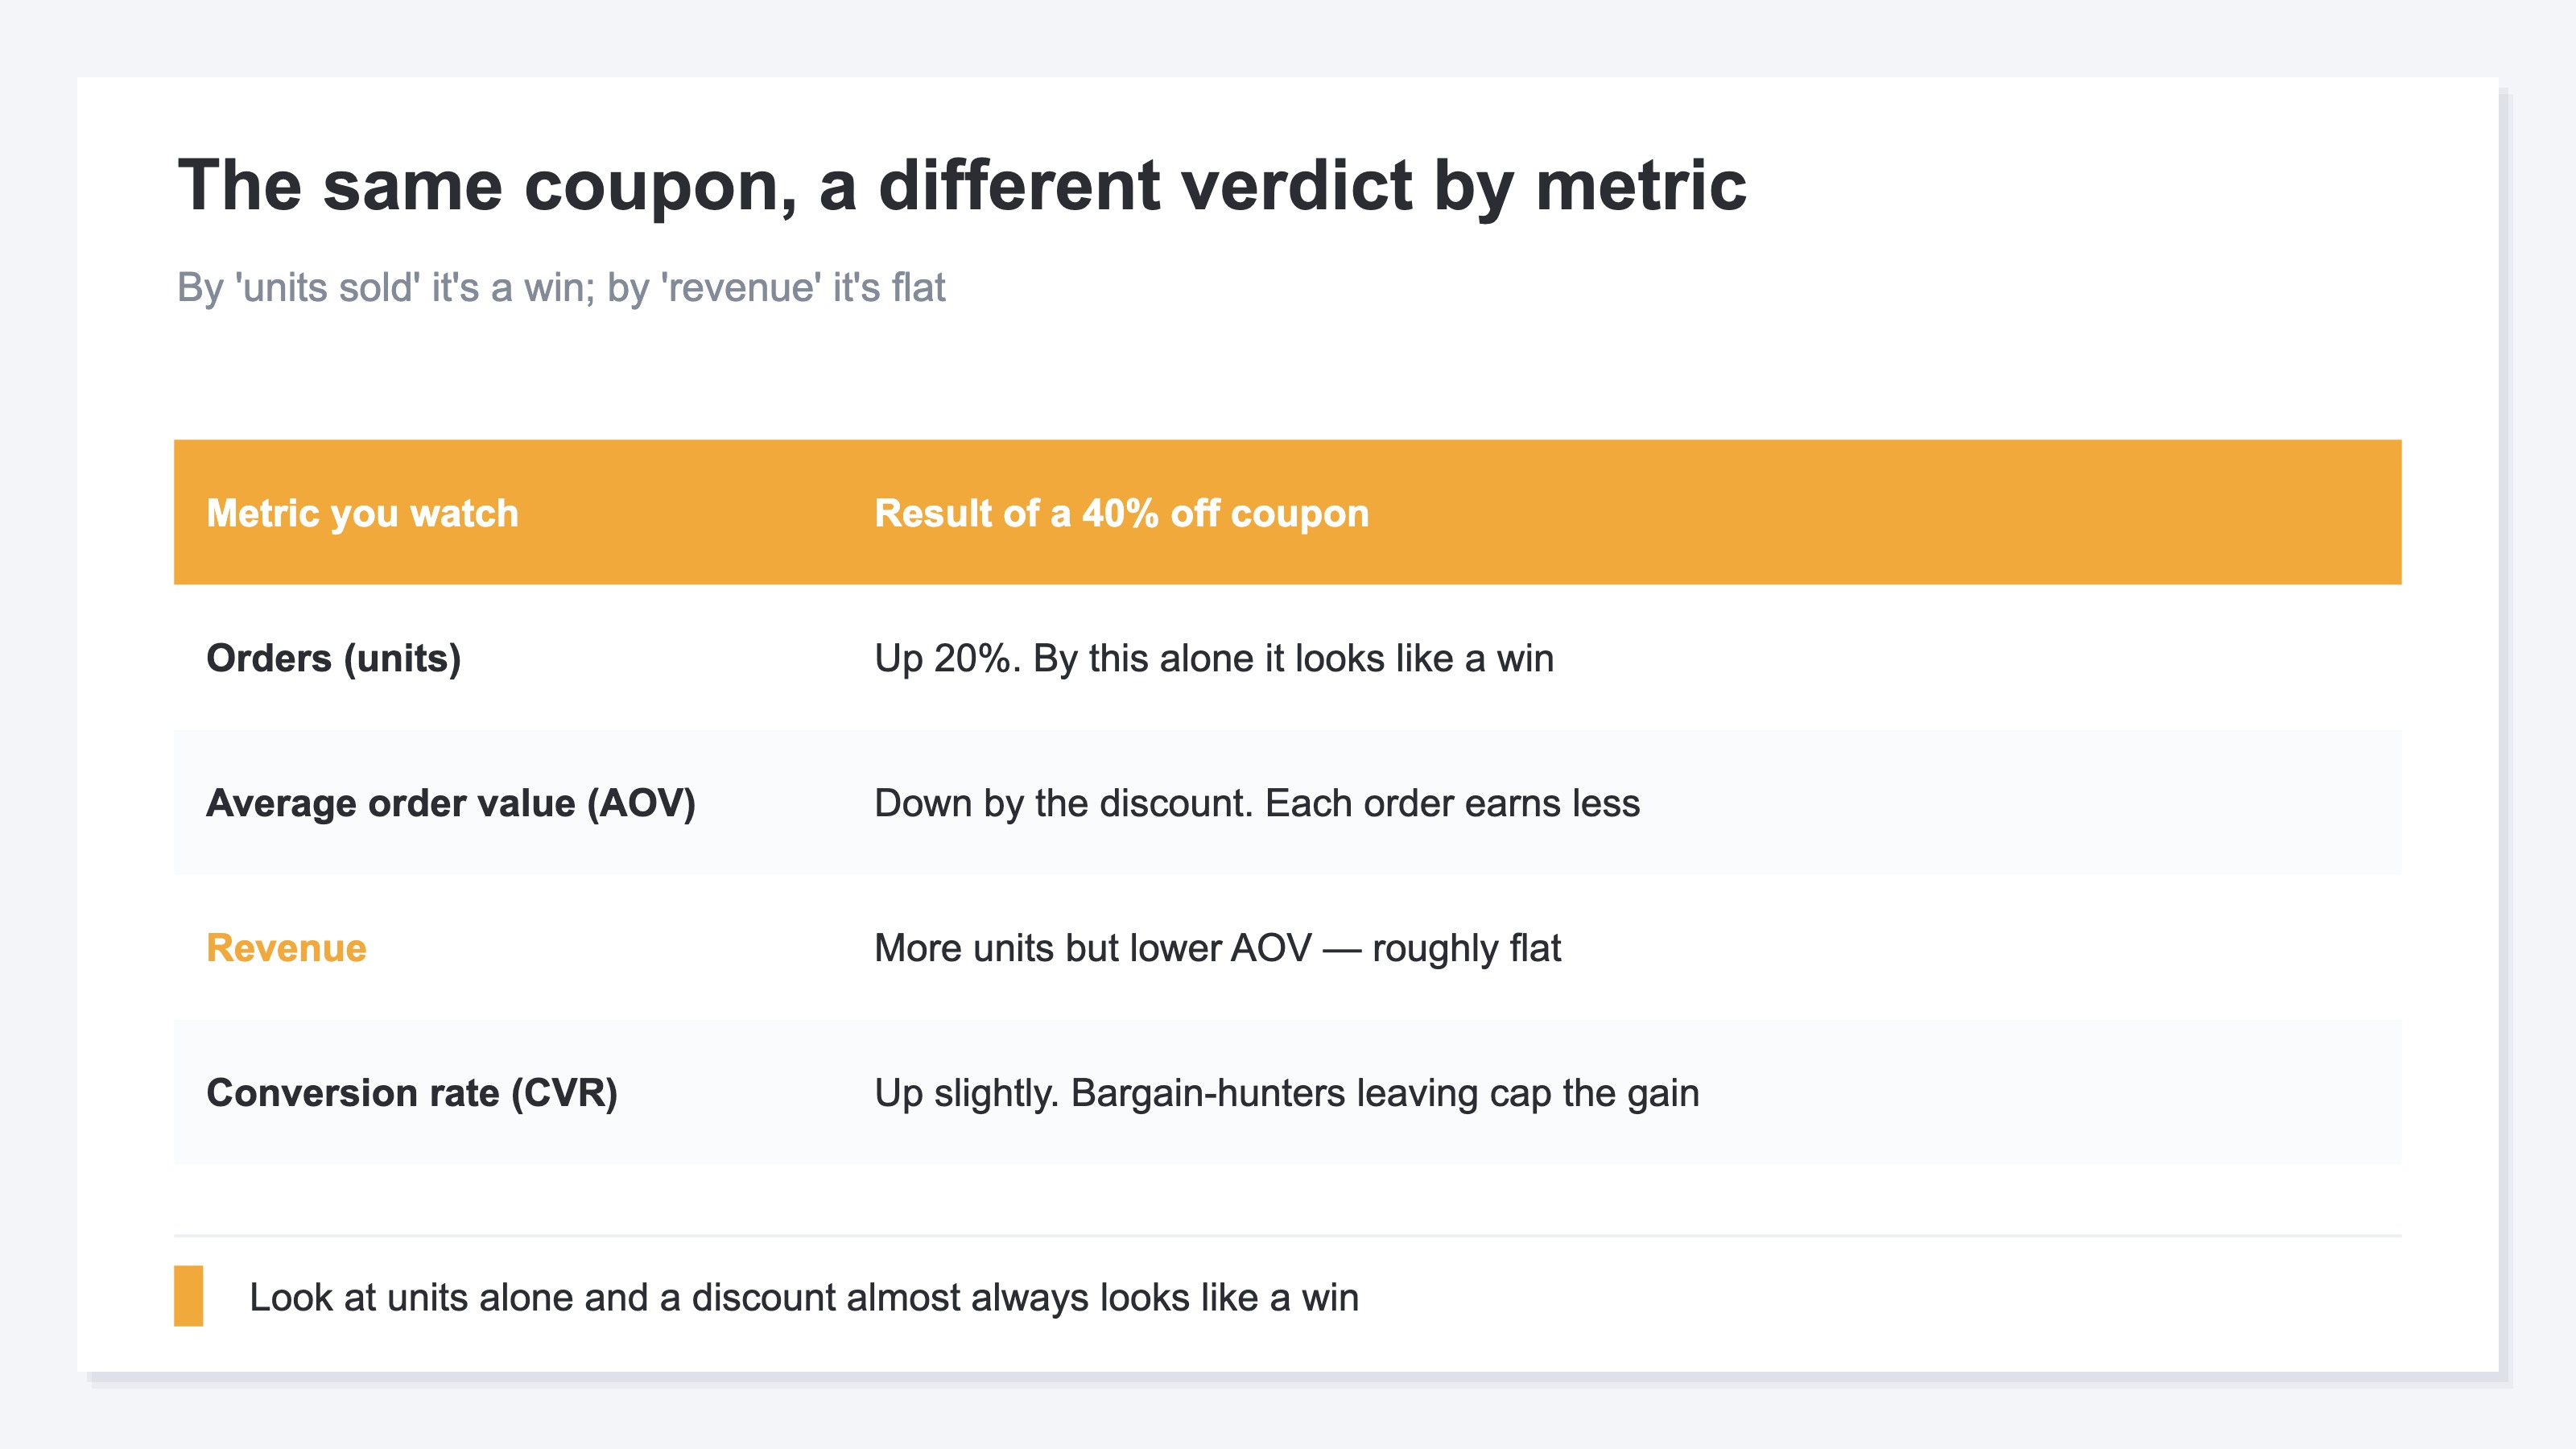
Bottom line: judge the effect by unit count alone and a discount almost always looks like a "win." That's why unit count is a poor starting point for a verdict.
Run a coupon or a sale and the order count usually goes up. When things get cheaper, people who were holding off, or torn between you and another store, finally move. So far, so good — that's the plan. The trouble is mistaking the size of that unit increase for the "effect."
Revenue isn't decided by unit count alone. Revenue is "units × AOV." A discount pushes the unit count up, but it reliably shaves the value of each order. With a 40% off coupon, even if units rise 20%, if the value per order falls by more than that, revenue — the product of those two — stays flat instead of rising, and can even drop. On top of that, people drawn in by the low price are more likely to browse and leave without buying, so CVR (the share who bought) doesn't climb as much as you'd hope.
The price-raise story from the opening is exactly this seen in reverse. Raising prices cut the customer count (units) by about 30%, but because the value per customer went up, revenue — the product of those two — actually rose. Units and revenue don't always move in the same direction. That's precisely why you have to read the effect by revenue, not units.
In short, the single figure of unit count is a clouded mirror for a discount's effect. So what should you look at? The next chapter lays out the three figures that stand in for unit count.
2. View by revenue, AOV, and CVR#
Bottom line: measure coupon and sale effectiveness by three figures — revenue, AOV, and CVR. Only with all three do you learn both "why units rose" and "whether you actually came out ahead."
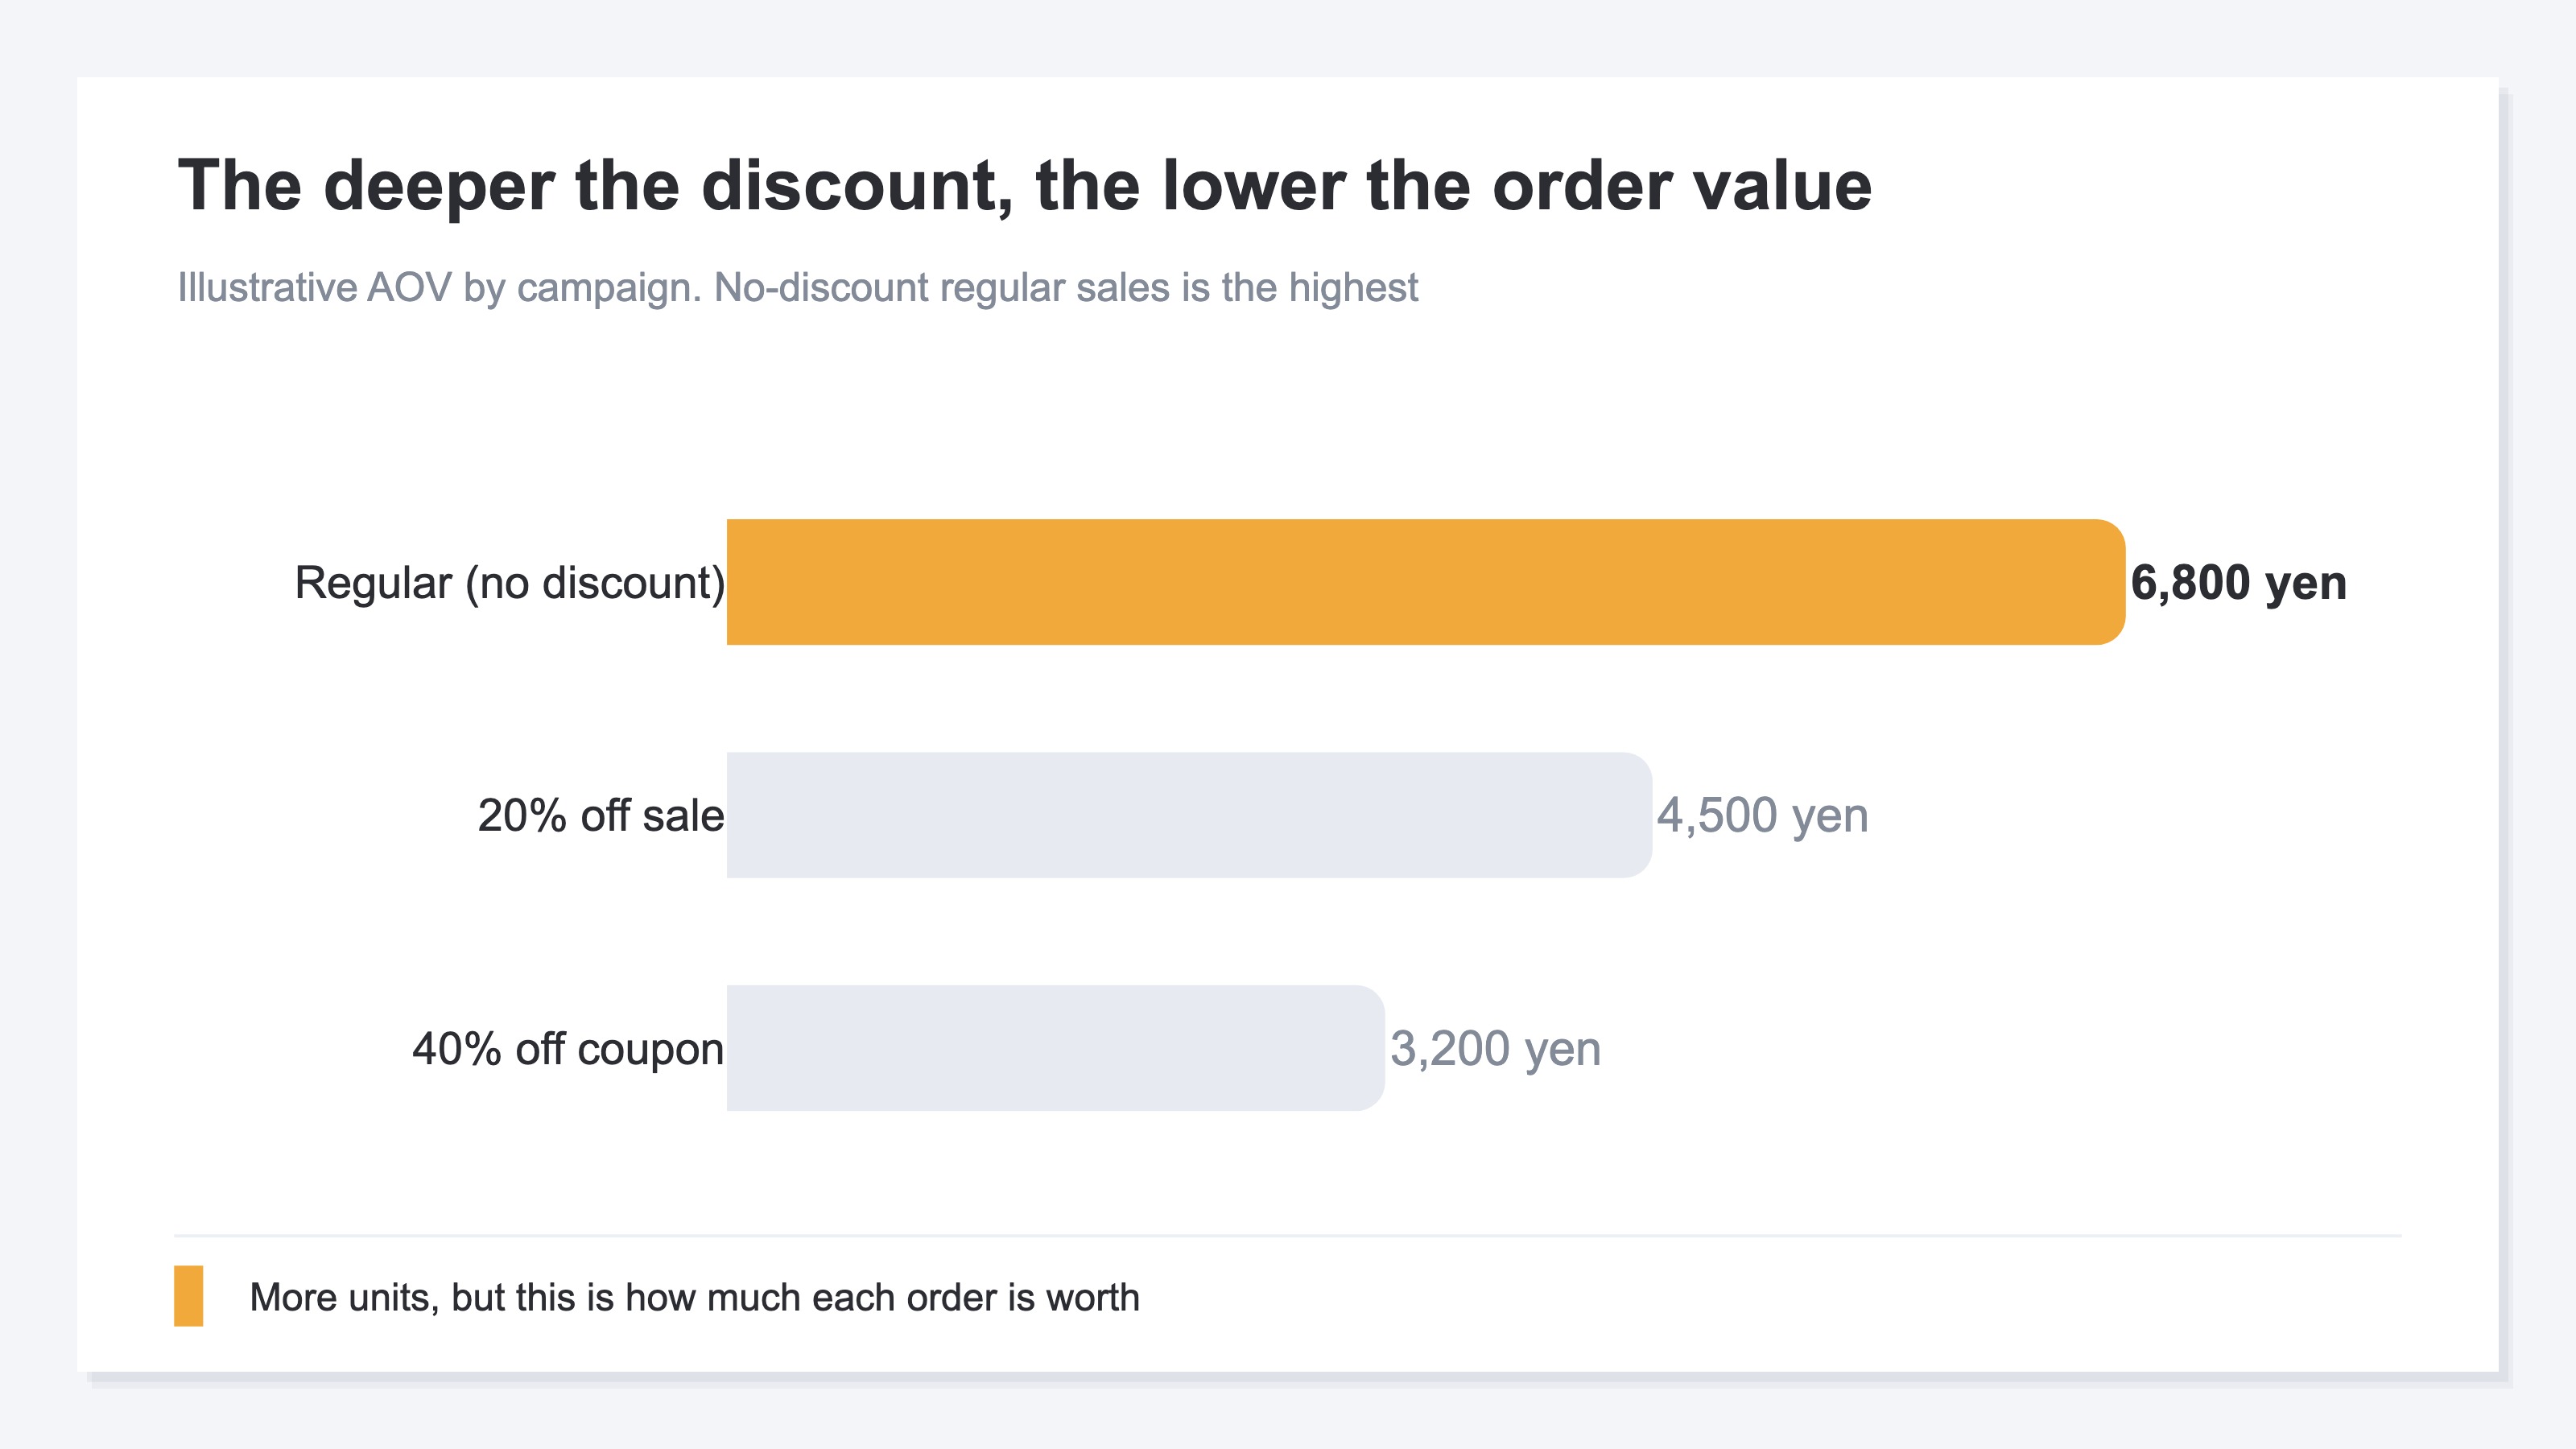
The first is AOV (average order value). It's the average revenue per order, found by dividing revenue by the number of orders. Run a discount and this figure drops. What matters is how much it dropped. If AOV falls only a little relative to the discount depth, the promotion held its order value. But if a deep discount shaves AOV sharply, then even with more units, the profit on each order is thinner.
The second is CVR (conversion rate). It's the share of site visitors who actually bought. Coupons and sales are often said to be levers for this figure. It can rise, true — but because people drawn by the low price are also more likely to leave without buying, it often doesn't rise as much as expected. So read CVR not on its own, but together with AOV.
The third is revenue itself. Given how AOV and CVR moved, did revenue ultimately grow? This is the final yardstick for the verdict. The mechanism to measure revenue is within reach: just configure your analytics tool to send purchase data [2].
One caution here, though. Looking at these three as a "site-wide total" still isn't enough. Even if total revenue is up, the total figure can't tell you whether that was thanks to the coupon, another promotion, or just a seasonal tailwind. The next chapter covers how to tease those apart.
3. Separate by campaign to spot what worked#
Bottom line: the last key to measuring the effect correctly is to view it by campaign. Not the overall total — only when you line up revenue, AOV, and CVR per promotion (coupon A, sale B, regular sales) can you see which one worked.
Say one month you ran a coupon and a sale at the same time, and overall revenue rose. Stop at "the promotions were a success" and you keep no lesson you can use next time. Whether the coupon worked, the sale worked, or undiscounted regular sales quietly earned the most profit — it all stays blended together. To separate it, you put a small tag on each promotion. Use a short marker added to each link (a UTM, a URL tag for telling campaigns apart) and you can sort, after the fact, which order came from which promotion.
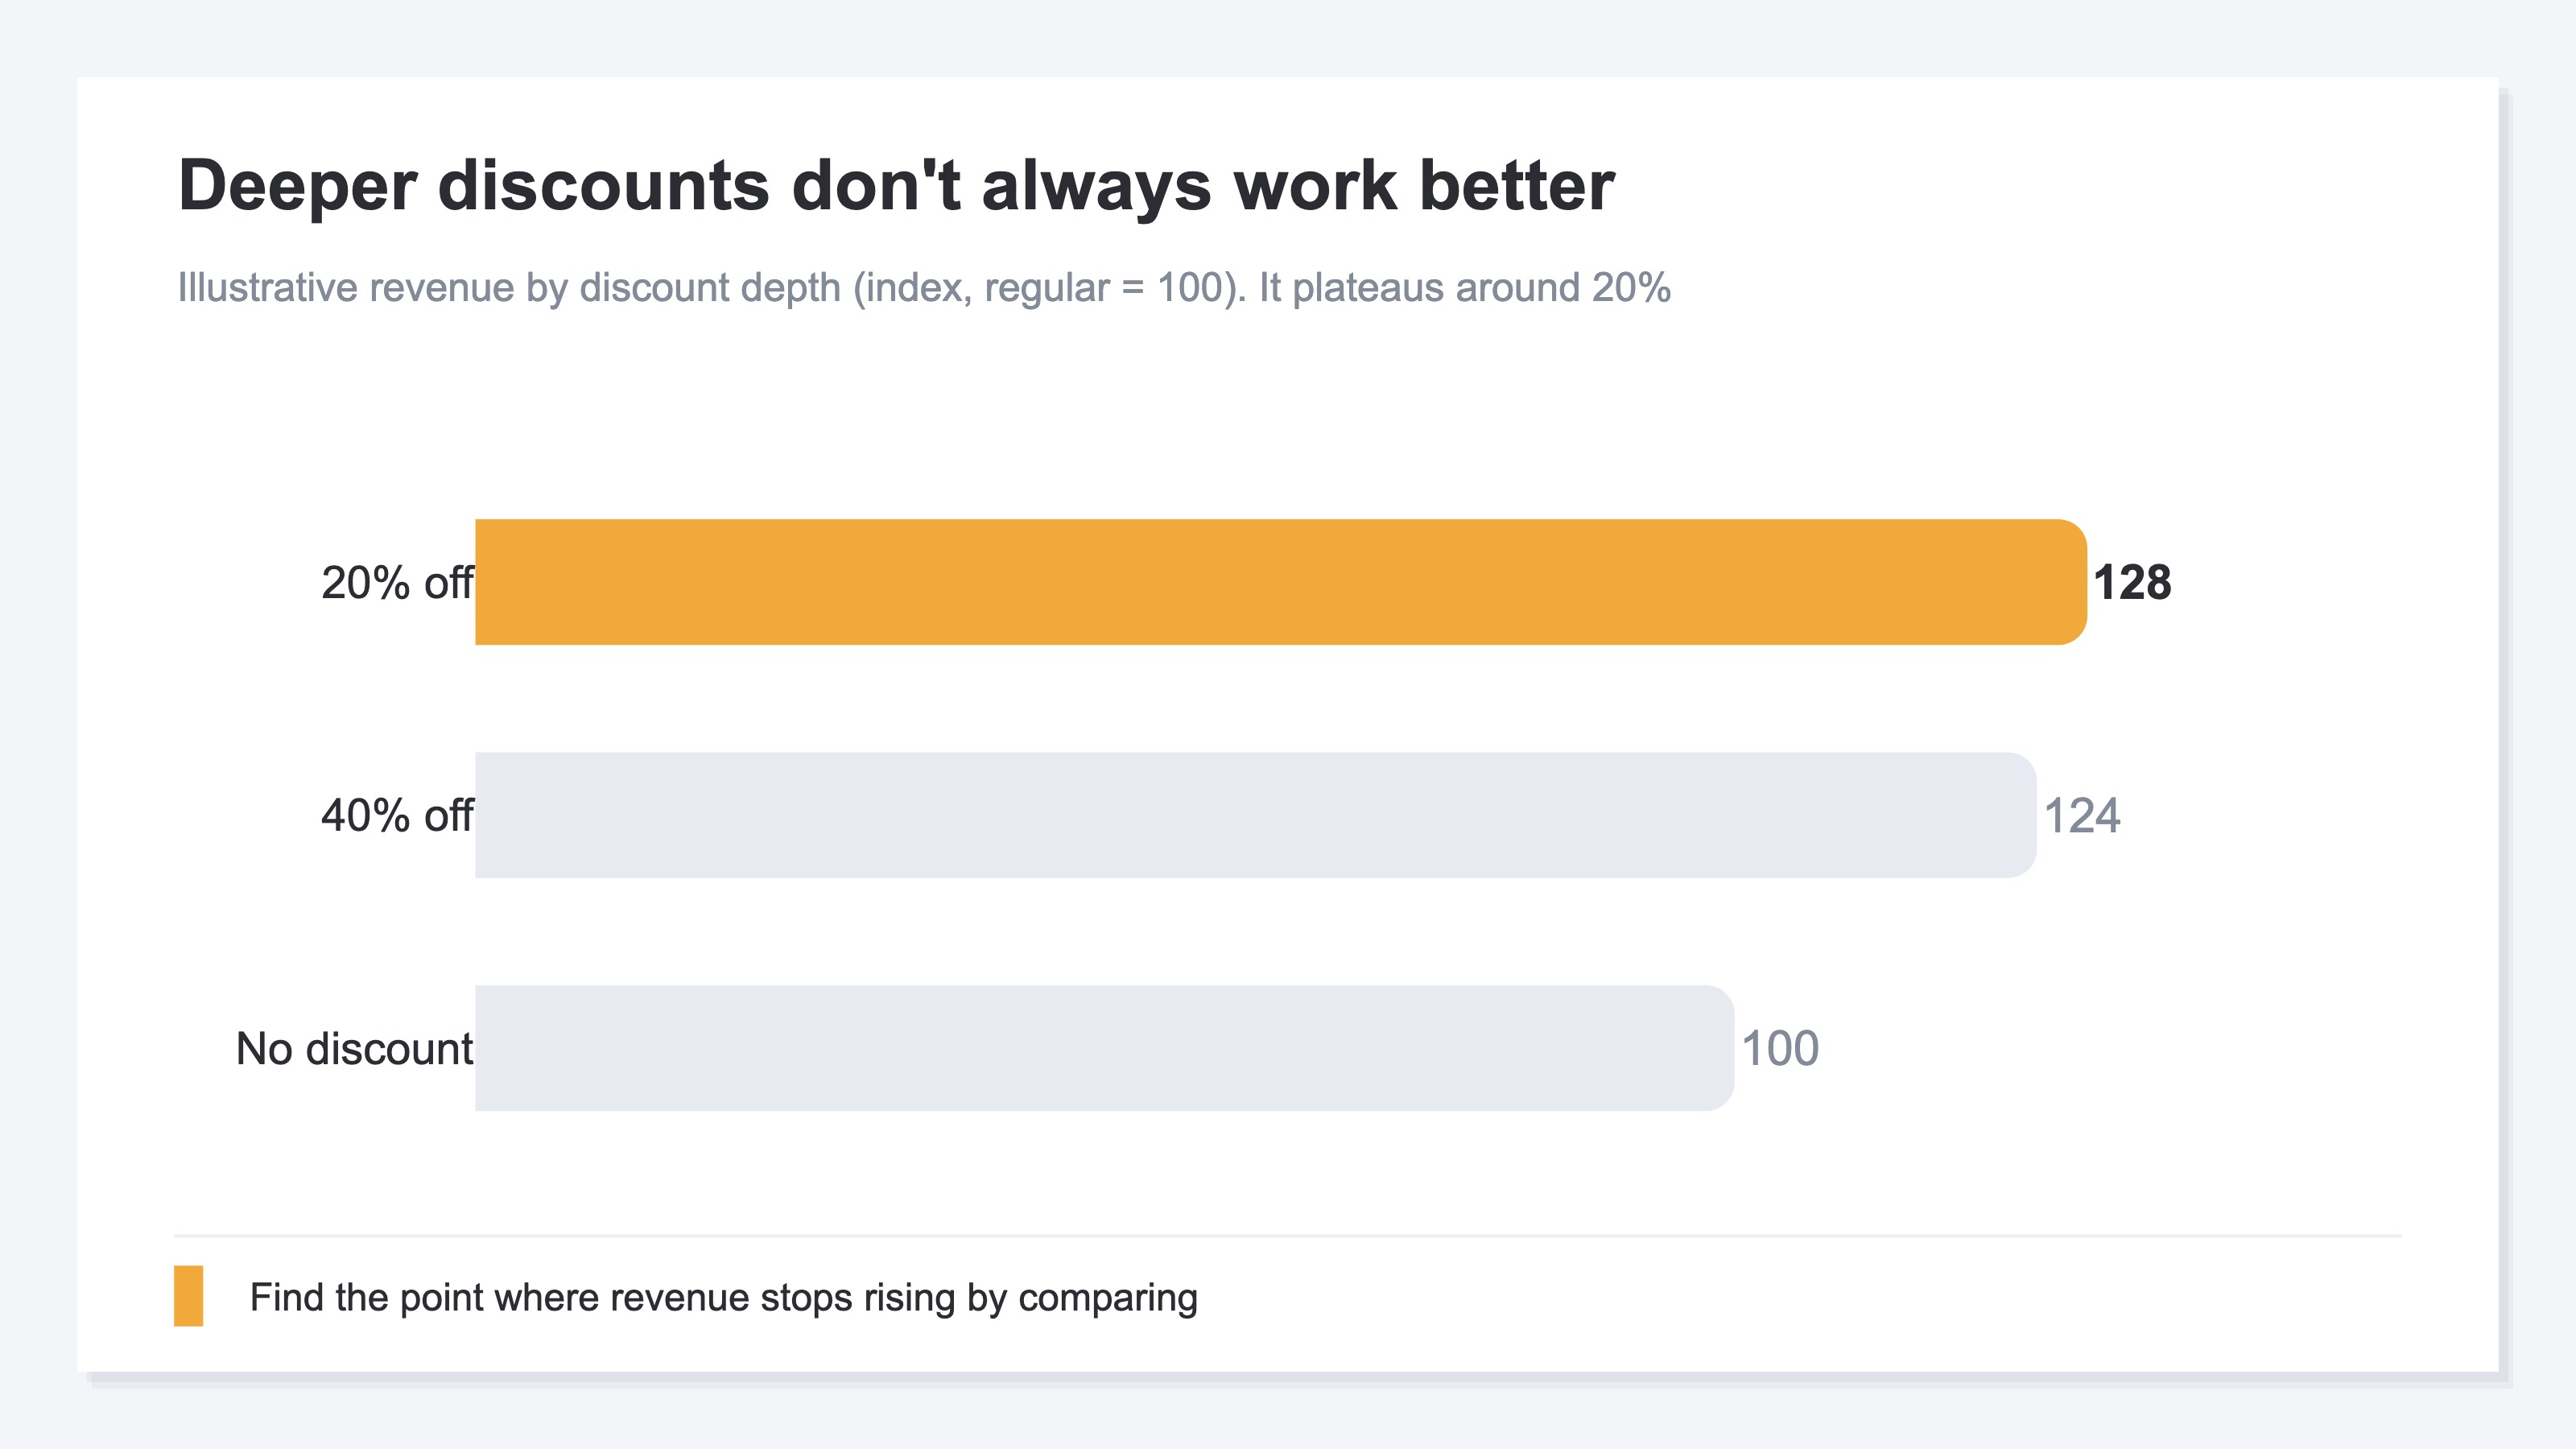
Splitting by campaign reveals one more thing: deeper discounts don't always work better. A 40% off coupon feels like it should sell more than 10% off, but because a deep discount sharply shaves AOV, in revenue terms it often doesn't pay. Vary the discount depth and compare revenue, and a threshold emerges — "going deeper than this won't lift revenue."
There are two boundaries worth making explicit here. One is profit. Revenue, AOV, and CVR tell you "how it sold," but not "whether that discount left any profit." Profit only appears once you subtract cost from revenue; how to set a discount and how to protect profit are covered separately in "How to set discounts and markdowns." The other is the time axis. Reviewing after a single sale ends — comparing the sale period against normal periods to set your next discount depth — is handled in "The post-sale review." This article focuses on the step before that: choosing the metrics to measure the effect, and comparing across campaigns.
The idea itself isn't hard. What's hard is doing this every time — splitting by campaign and by entry point, tallying it all by hand. Your traffic data, order data, and revenue data sit in separate places, and just matching them against the campaign tags and merging them into one view drains you before you reach the actual decision. A simple idea that gets heavier the longer you keep it up.
How RevenueScope helps
Bottom line: when you try to read coupon and sale effectiveness in revenue terms, you keep hitting the same wall — the figures you need are scattered across several places, and you have to re-merge them per campaign every time. RevenueScope brings those scattered figures onto one screen, by campaign.
RevenueScope gathers that scattered data into a single screen by campaign and lays out order count, average order value (AOV), conversion rate (CVR), and revenue side by side (display uses demo data).
| Campaign | Orders | AOV | CVR | Revenue |
|---|---|---|---|---|
| 40% off coupon | 420 | ¥3,200 | 3.1% | ¥1,344,000 |
| 20% off sale | 310 | ¥4,500 | 2.4% | ¥1,395,000 |
| Regular (no discount) | 180 | ¥6,800 | 1.6% | ¥1,224,000 |
The most telling read in this table is that the 40% off coupon, which has the most orders (420), is not first in revenue. Because the deep discount drove AOV down to ¥3,200, the 20% off sale (310 orders) — with less than half the order count — overtakes it on revenue. Watch unit count alone and you'd never notice. From here the next move comes into view: ease the discount depth from 40% back toward 20% to protect AOV, and even with the same traffic there's room for revenue to grow. Instead of blindly running deep discounts, you can lead with the discount depth that earns the most revenue.
Let's be clear about one thing. What RevenueScope outputs is revenue, average order value (AOV), conversion rate (CVR), and revenue per session (RPS), broken down by campaign and by entry point. It does not output profit after cost (gross margin), or inventory. So whether a given discount left any profit is something RevenueScope alone can't tell you. It assembles the material for "which campaign earned the revenue," but the final call on how deep to discount is yours.
FAQ#
Q1. My orders clearly went up after I ran a coupon. Can I call it a success?
Not yet. Order count (units) usually rises with any discount, but it reflects only part of the effect. A discount shaves the value of each order, so units can rise while revenue stays flat. Beyond order count, check that AOV hasn't fallen too far and that revenue itself grew. Only when units rise and revenue rises can you call it a success.
Q2. Between AOV and CVR, which should I prioritize?
Neither alone — read both together. If CVR rises but AOV falls sharply, revenue won't grow. Conversely, if you protect AOV but CVR doesn't move at all, the promotion isn't getting people to act. Watch the two at once, and judge by how revenue ultimately moved. Chase a single figure and you'll misjudge somewhere, every time.
Q3. What do I need to measure the effect by campaign?
Put a small tag (a UTM) on each promotion, and tally your traffic, order, and revenue data by campaign. The idea is simple, but doing it by hand every time — per campaign, per entry point — becomes heavy work. Because the data sits in separate places, just re-merging it eats your time. A tool that lines this up automatically frees you to spend that time on the decision.
Summary#
Measuring coupon and sale effectiveness by "units sold (order count)" alone leads you astray. A discount easily lifts the unit count, but because it shaves the value of each order, units can rise while revenue stays flat. Units and revenue don't always move in the same direction.
Measure the effect by three figures — revenue, AOV, and CVR. And rather than a site-wide total, split by campaign (coupon A, sale B, regular sales) and compare side by side; only then do "which one worked" and "what discount depth to run next" come into view. Start by taking one recent promotion and lining up not just order count, but AOV and revenue. Once that's visible, the coupons and sales you ran on instinct turn into moves with a reason behind them.
See which ads actually drive revenue, at a glance
Free up to 5,000 sessions/month, AI analyst included. No credit card required. Up and running in 5 minutes.