You spend on ads every month. You're getting clicks. But asked "which ads actually drove sales?", you can't answer clearly — that happens at a lot of online stores. Measuring ad effectiveness means judging whether the ads you ran actually drove sales. This guide explains why the "I can't tell which ads worked" state happens, what causes it, and the concrete steps to tell which ads sold using your own revenue.
Table of Contents
TL;DR#
-
Ad effectiveness measurement is judging whether ads actually drove sales
Not just clicks or impressions, but whether real revenue followed
-
You can't tell which ads worked because the measurement foundation is missing
Without conversion tracking and UTM tags, you simply can't connect ads to sales
-
Platform dashboard numbers stop at "what happened"
Clicks and CV show up, but your real revenue and whether buyers were new can't be seen there alone
-
The first step is tagging with UTM and totaling revenue per channel
Before chasing perfect measurement, just aligning your own revenue by ad changes the decision
1. What ad effectiveness measurement is#
Bottom line: it means judging whether an ad you ran "actually drove sales."
When people hear "ad effectiveness measurement," they think of clicks, click-through rate, and impressions. Those matter. But what you really want to know is whether the ad ultimately created sales. However many clicks an ad gets, if it didn't lead to revenue, that's no reason to pour more money into it.
The key thing to know is that the same ad tells you different things depending on where you read the numbers. Ad performance has two views. One is the dashboard inside Google Ads or social ad platforms. The other is your own actual revenue.
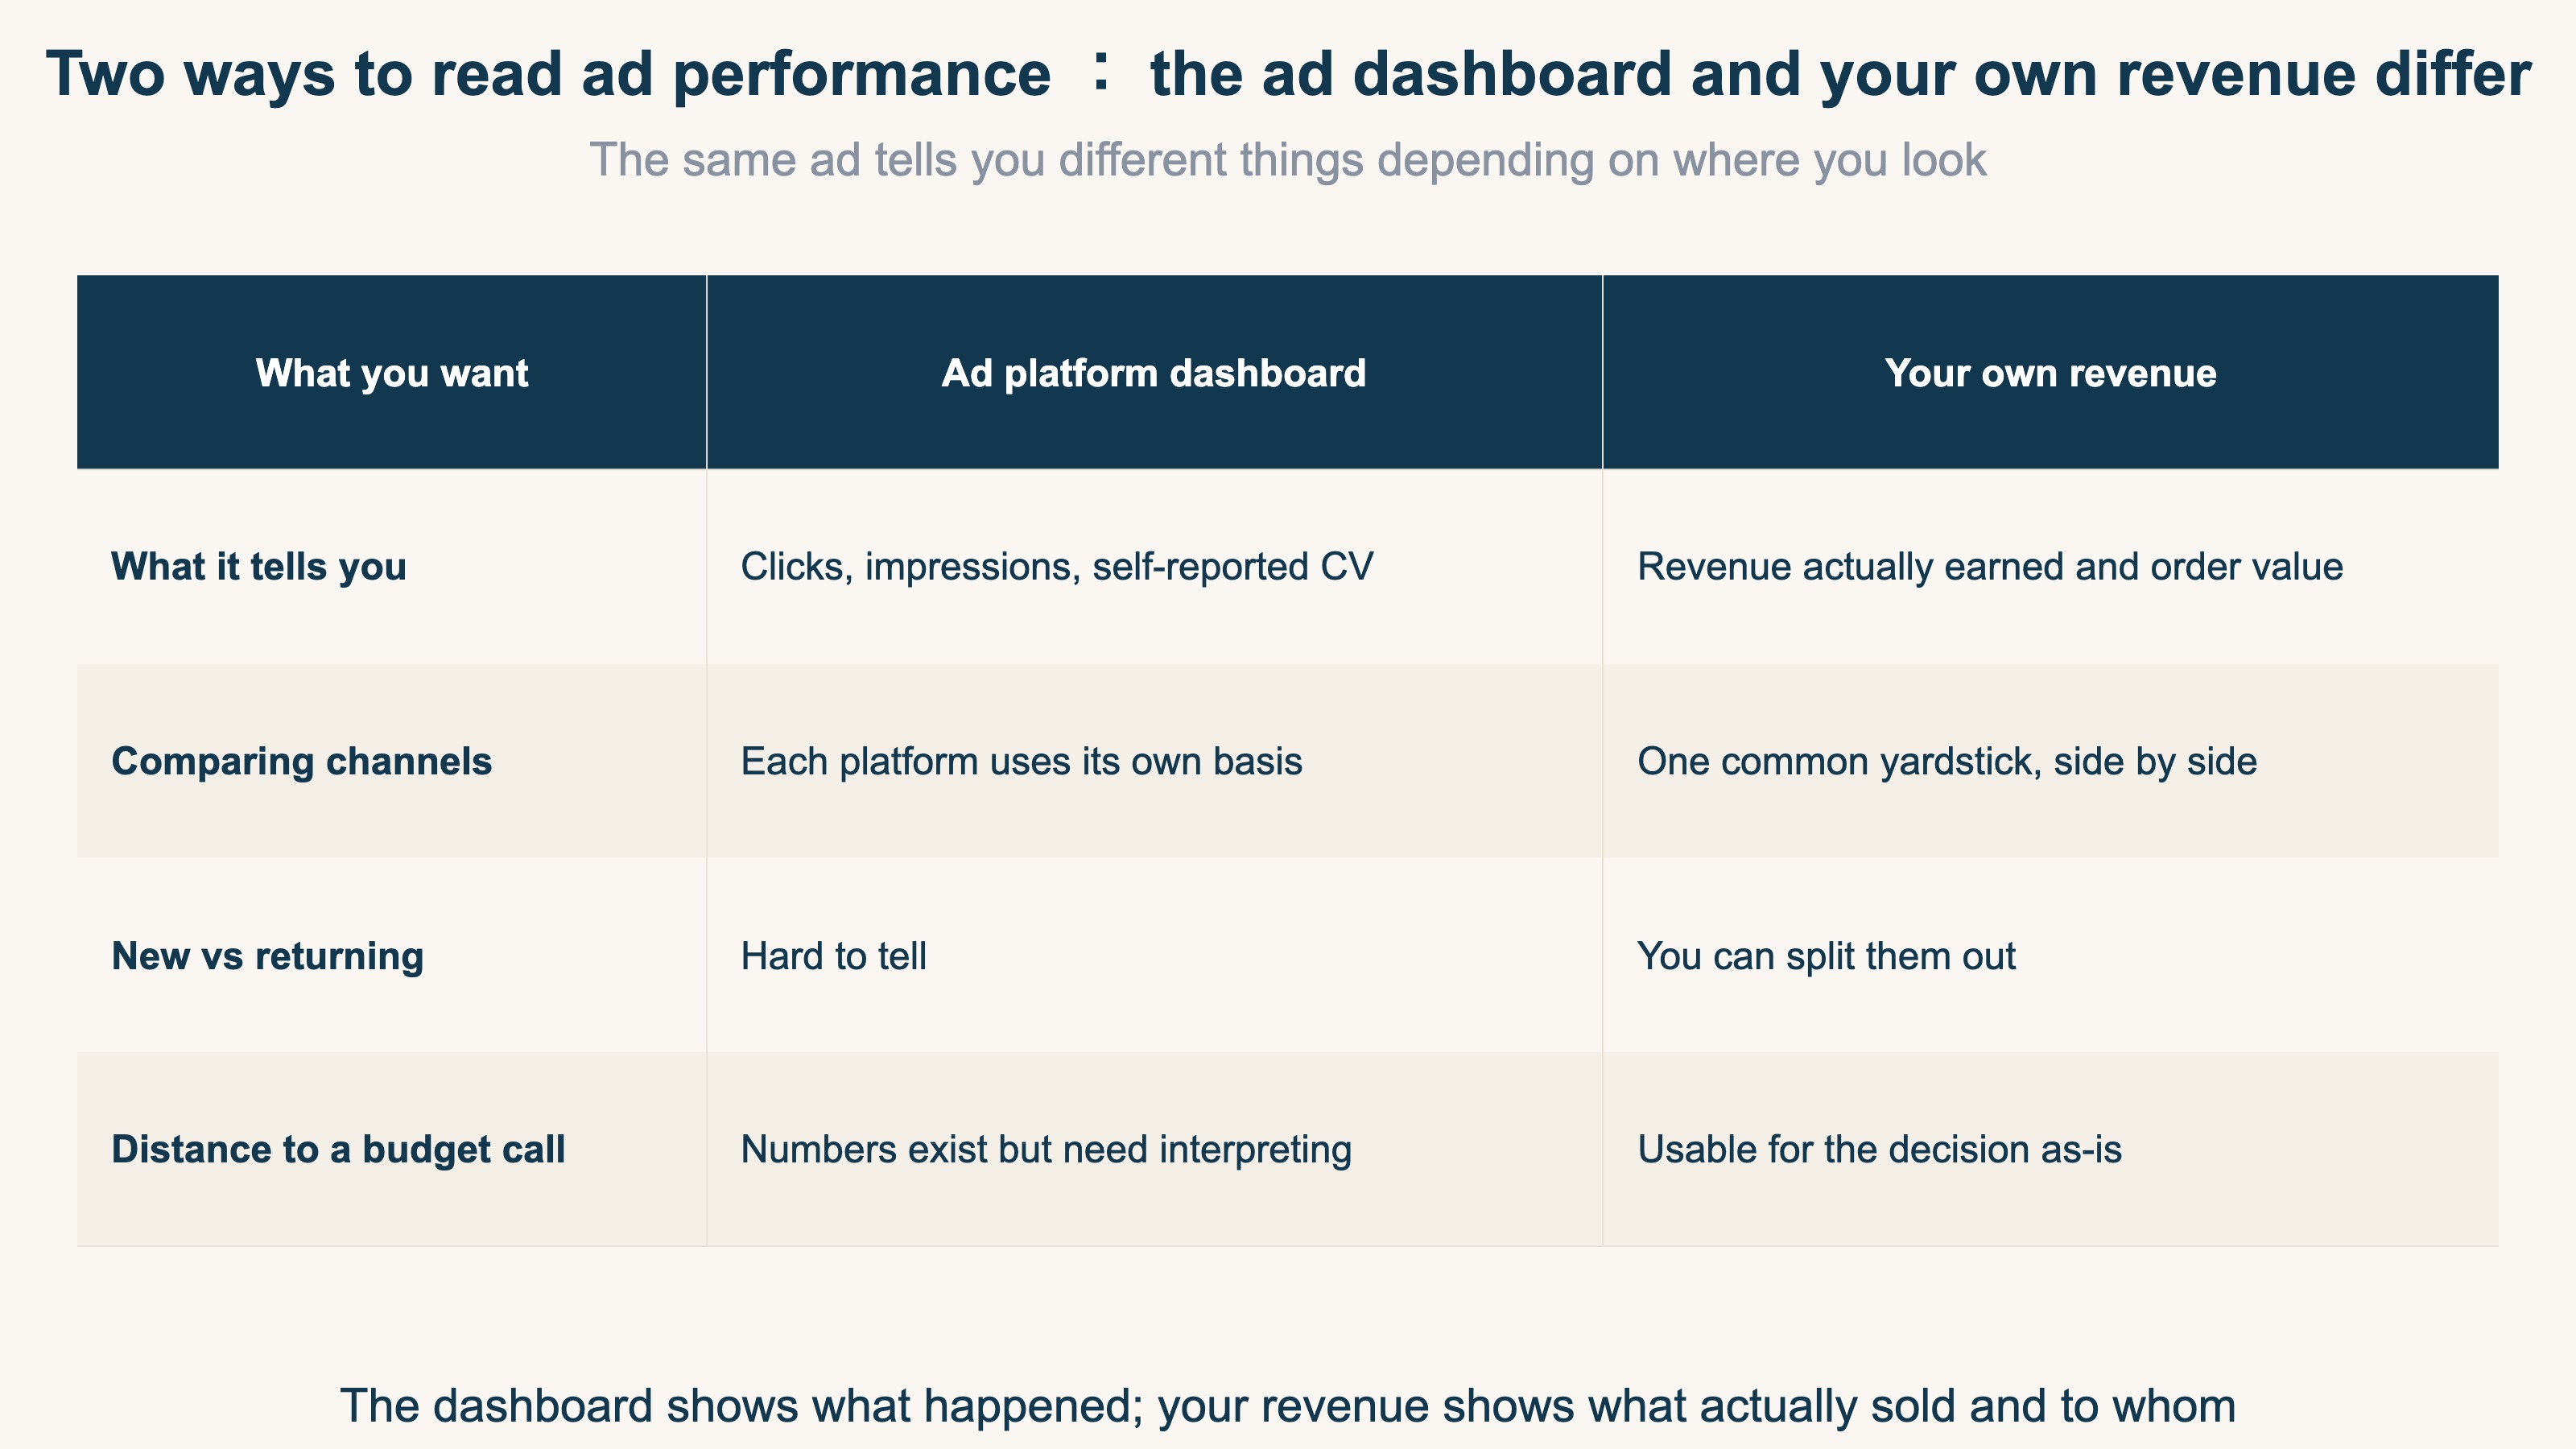
The dashboard tells you "this many clicks happened" and "this many self-reported conversions (CV — purchases and other results)." That's a record of what happened. Your own revenue tells you how much actually sold, and whether the buyer was new or a returning regular. The real goal of ad effectiveness measurement is to reconcile these two and judge which ad truly created sales.
2. Why you can't tell which ads work#
Bottom line: without the measurement foundation — conversion tracking and UTM tags — you can't connect ads to sales at all.
Not being able to tell which ads work isn't about a lack of skill. In most cases the cause is a missing measurement foundation. That foundation is two mechanisms. One is conversion tracking that correctly records when a purchase happens. The other is a UTM tag that shows which ad a visit came from.
Without this foundation, what happens? Clicks come in, but leads and revenue stay unstable. The cost to acquire one lead, for instance, can swing three or four times from month to month.
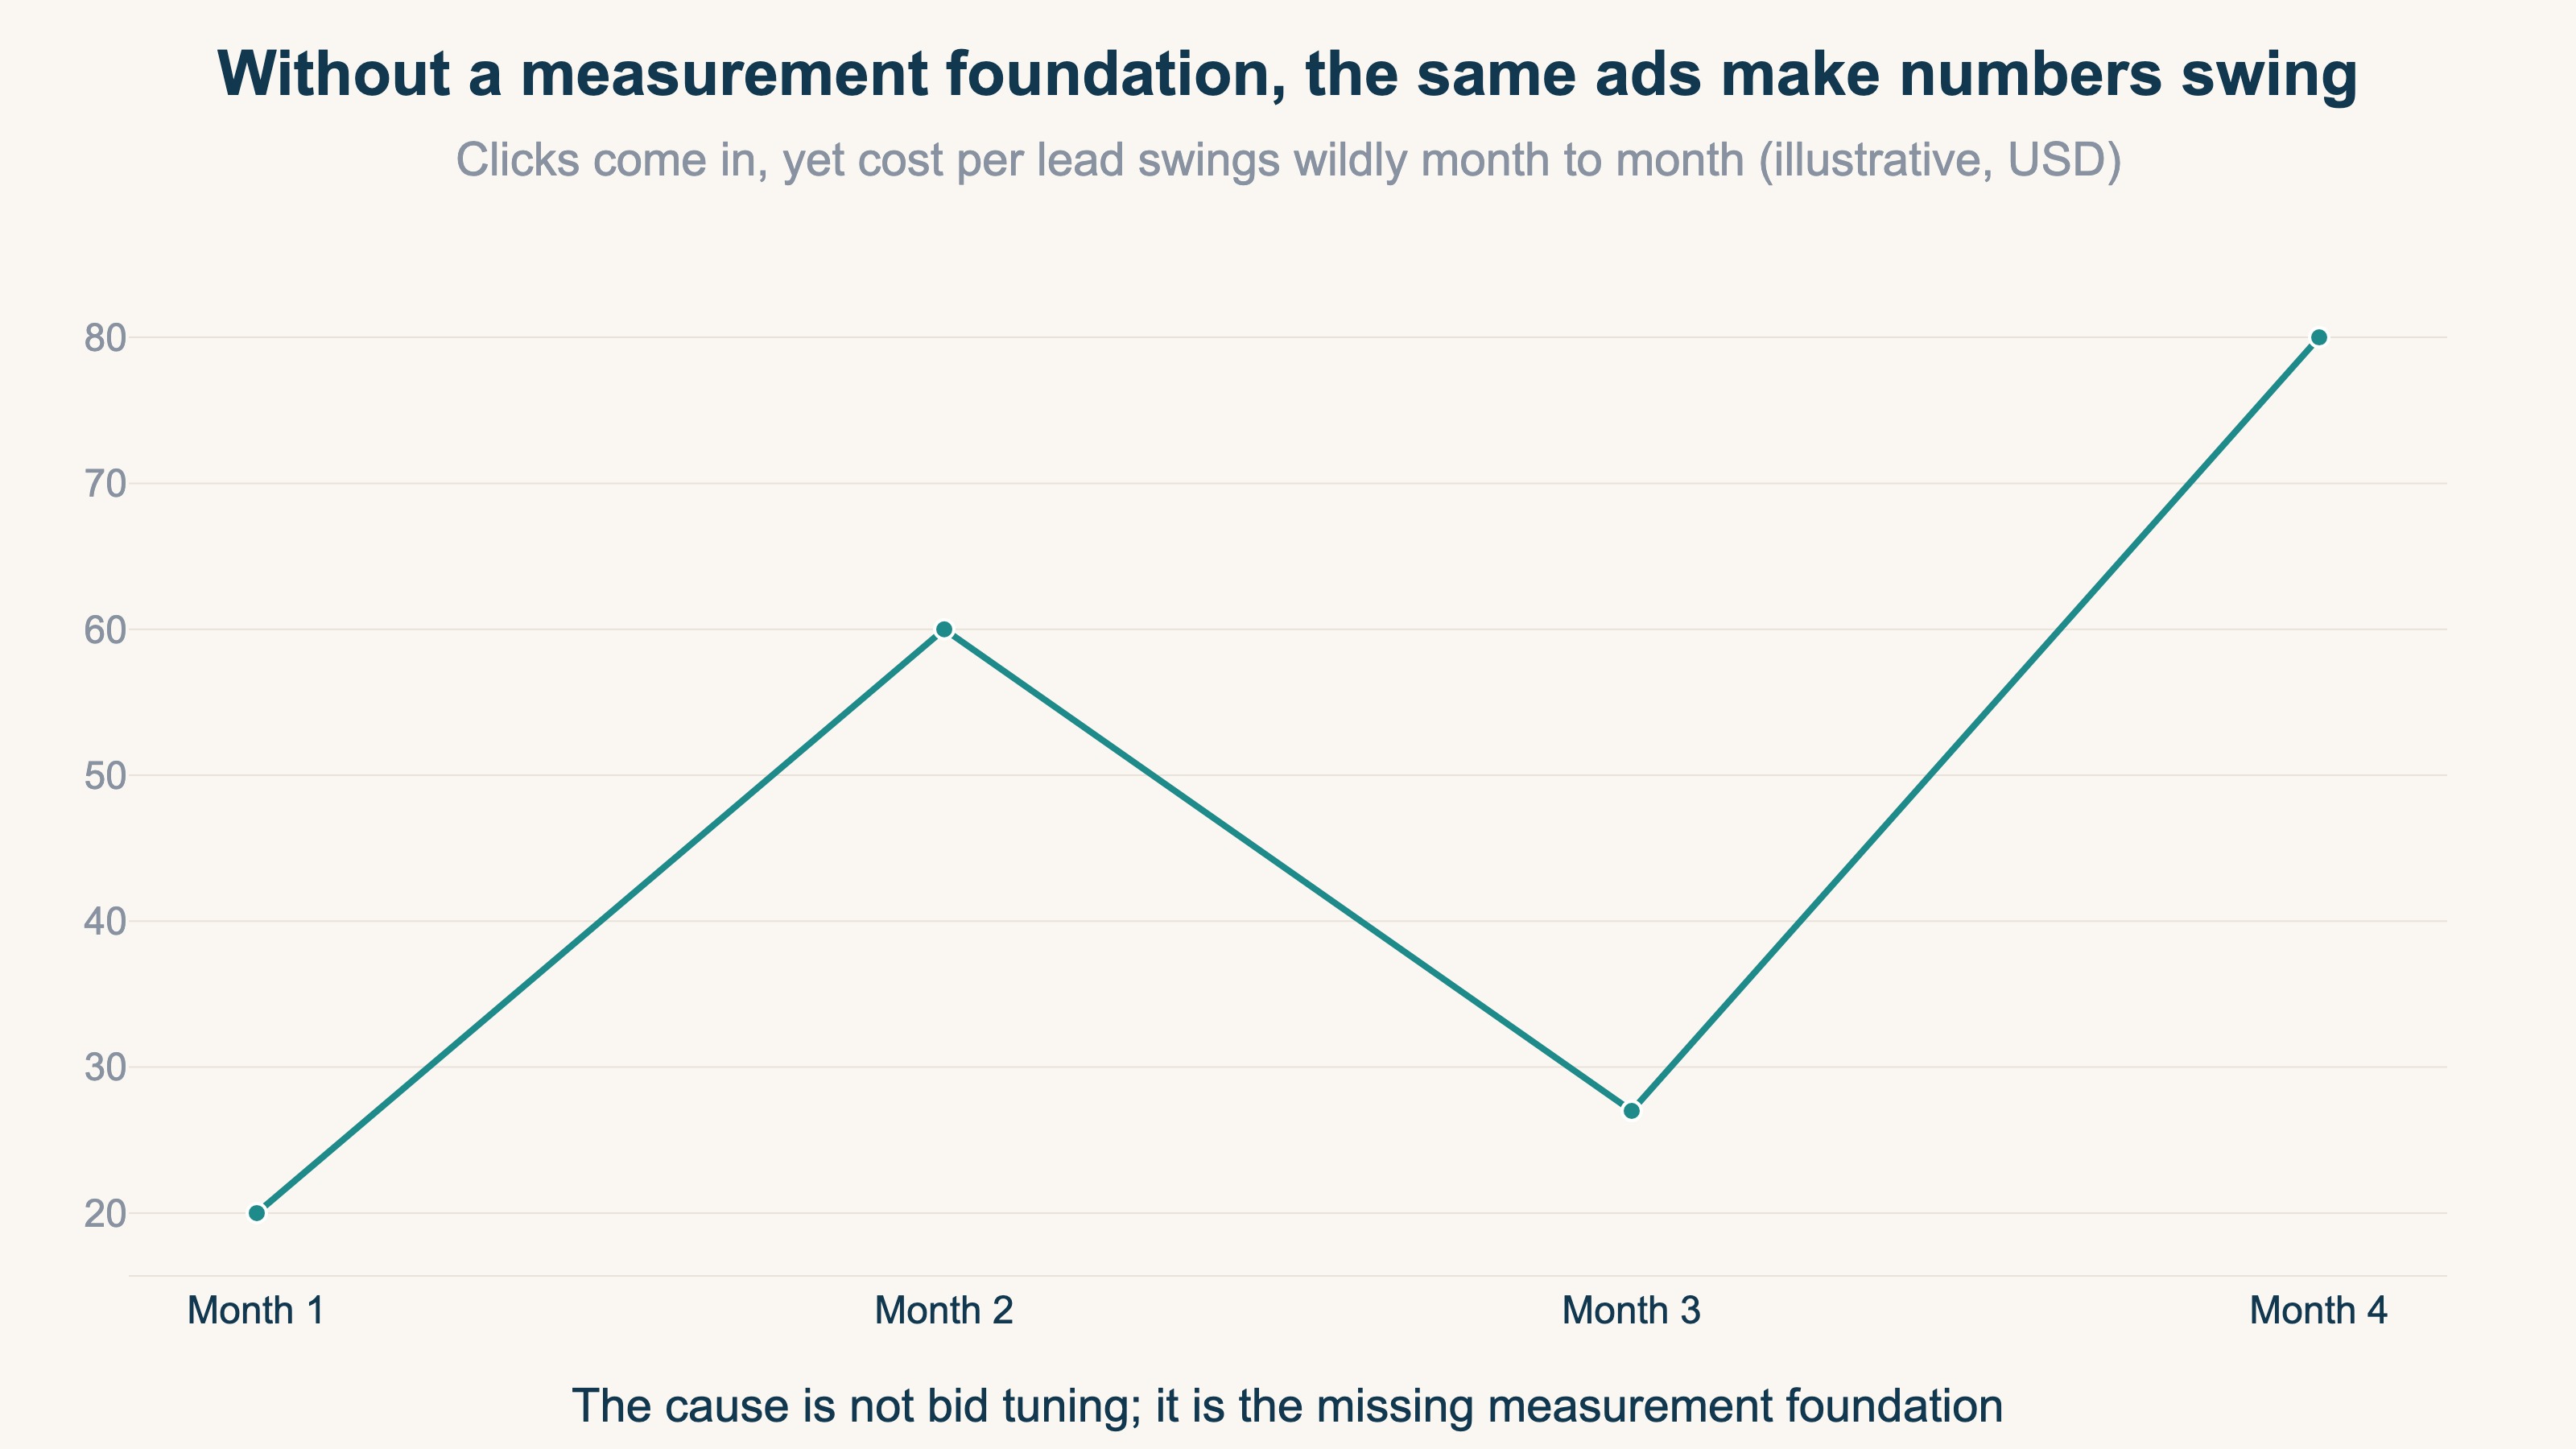
When numbers swing this much, it's tempting to think "let's adjust the bids." But the real cause isn't bidding — it's the missing measurement foundation. In the ad world, it's not rare to run for months with no conversion tracking, spending budget without knowing which ad produced leads. Without a foundation, you may think you're optimizing while actually running blindfolded.
Another trap is trusting the platform dashboard alone. Google Ads will tell you "this keyword converted." But it can't tell you whether that customer was genuinely good, or didn't churn right away. Dashboard numbers are useful, but on their own they lack context.
3. How to tell, using your own revenue#
Bottom line: before chasing perfect measurement, tag with UTM and total your own revenue per ad.
Hearing "you can't judge without a foundation" may sound daunting. But the first step isn't a big project. What you do is realign your own revenue by "which ad it came from." It breaks into three steps.
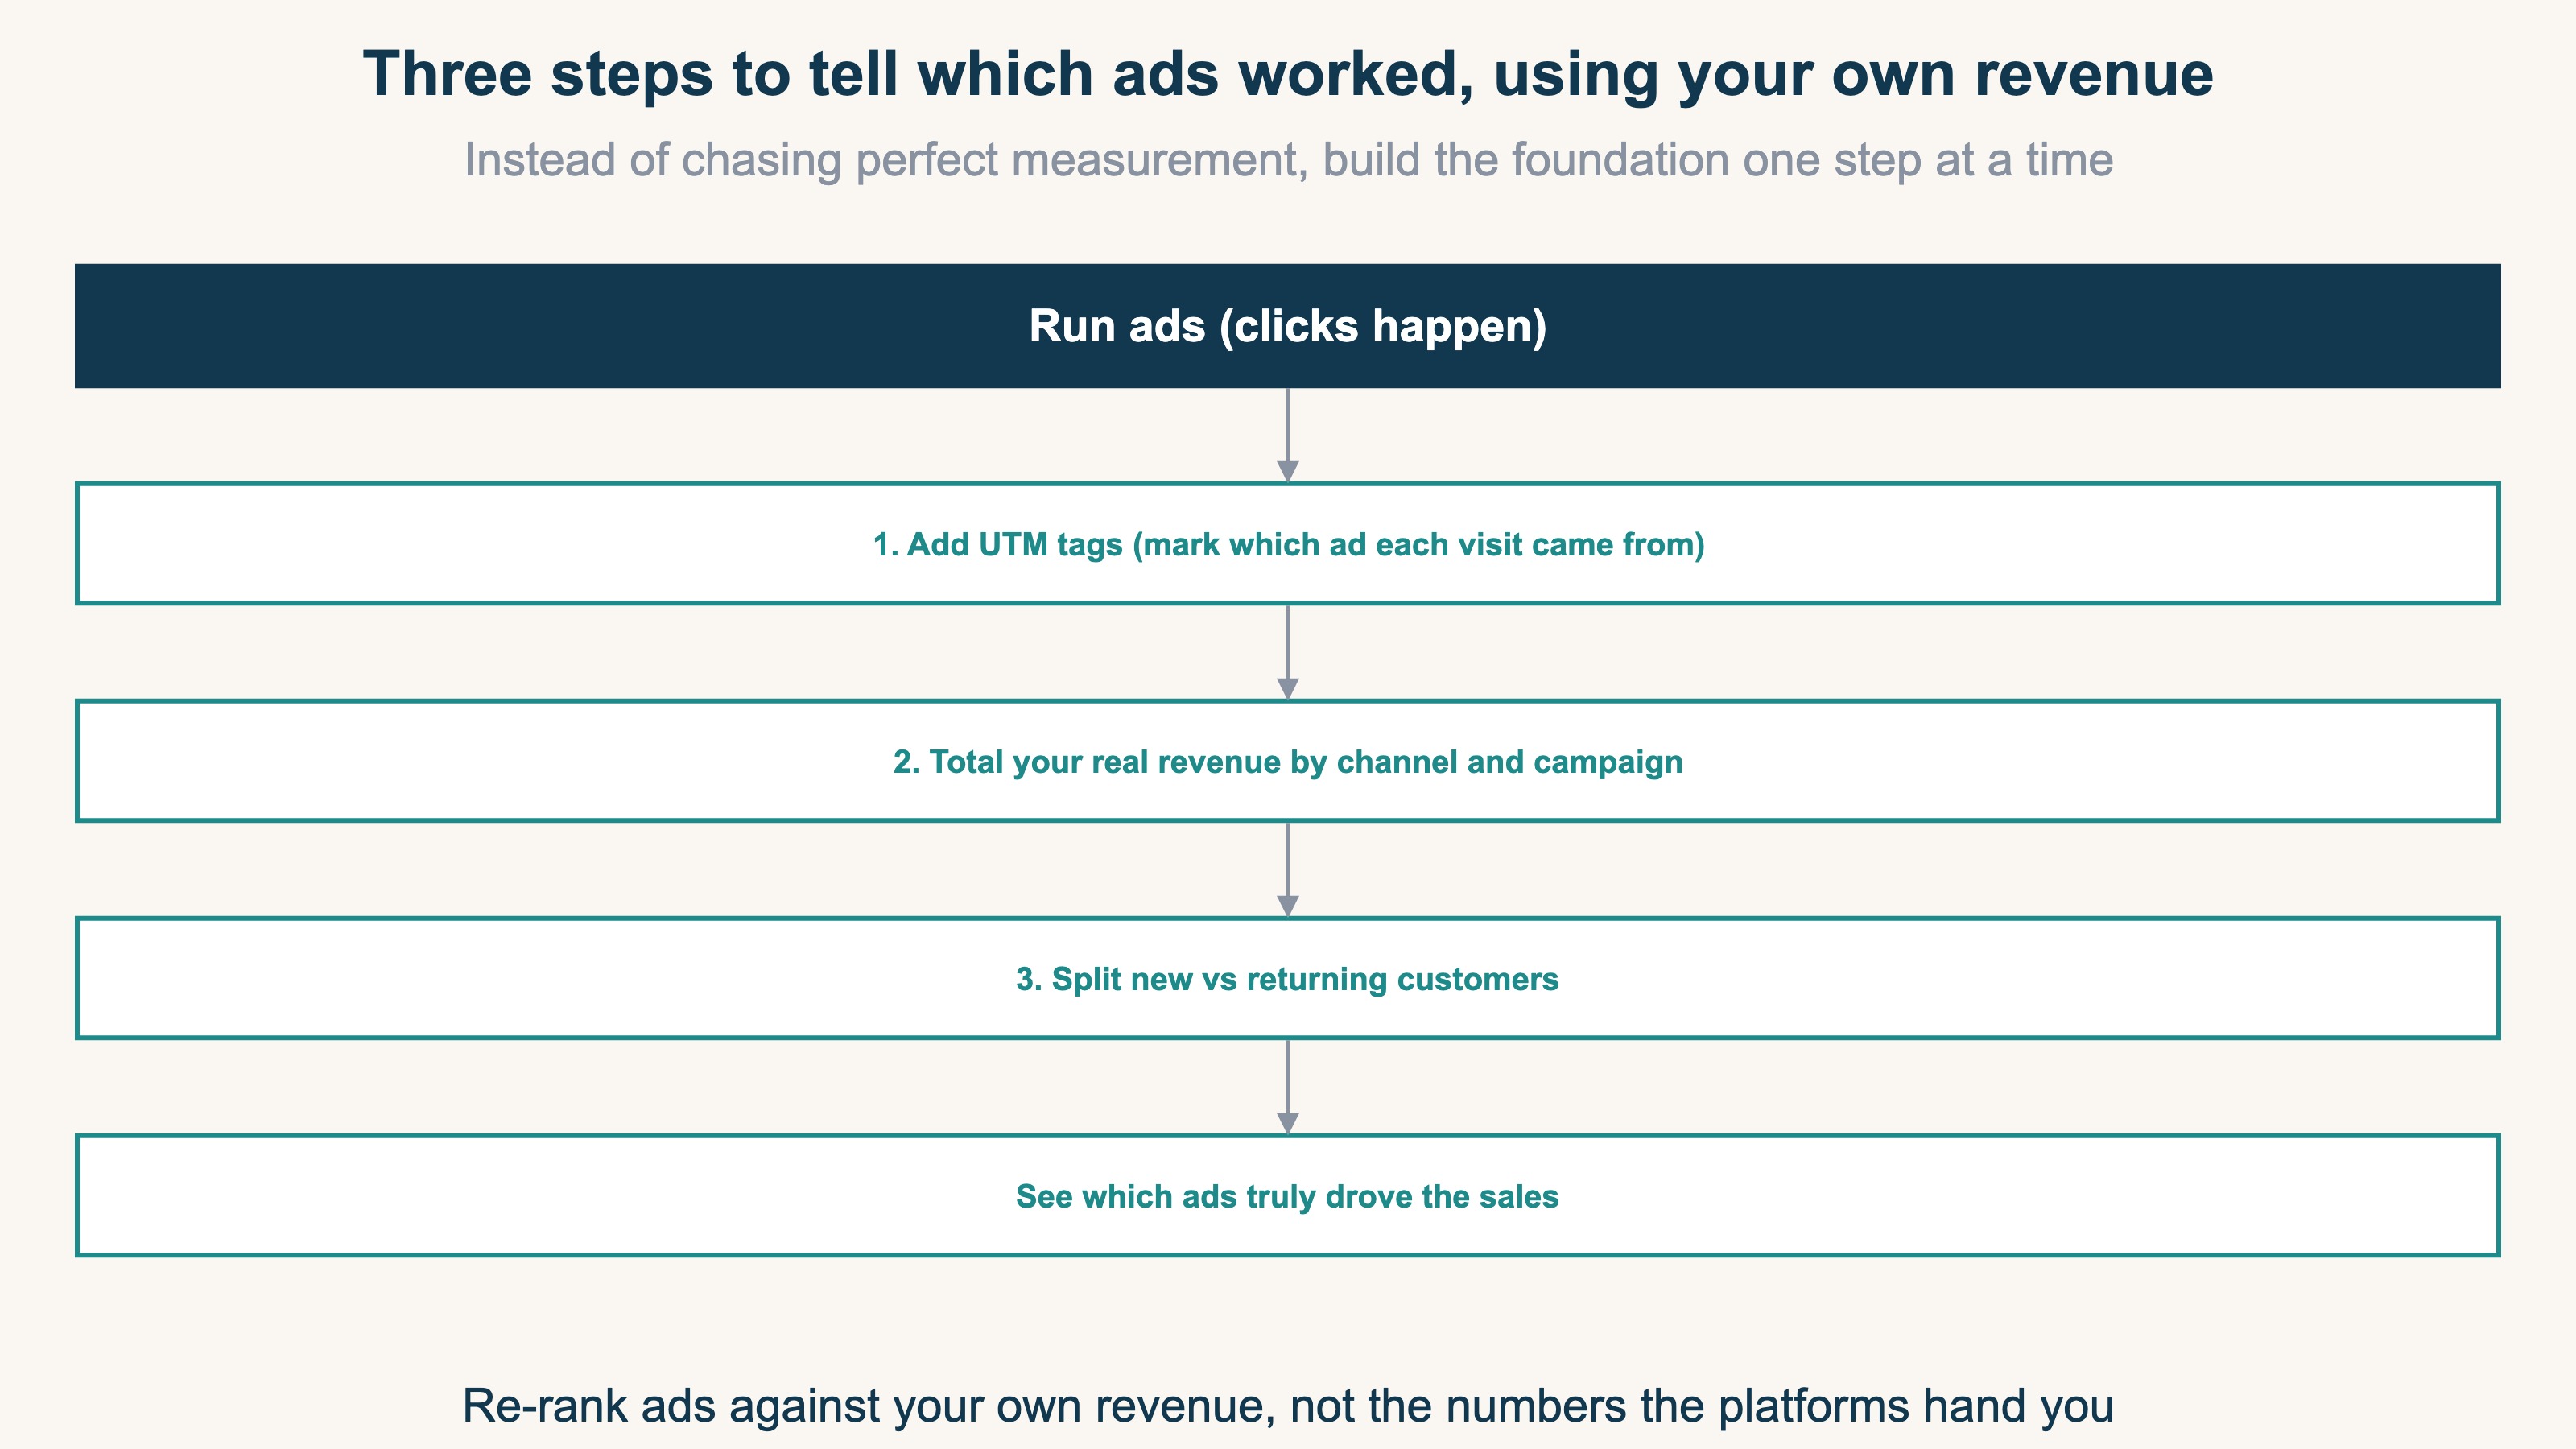
- 1. Add UTM tags: put a tag on your ad links that marks which ad a visit came from. Now you can connect visits to channels
- 2. Total real revenue by channel and ad: line up your own confirmed revenue per ad, not each platform's self-report
- 3. Split new vs returning: separate whether that revenue came from new customers or returning regulars
The third step — splitting new from returning — matters most. Ad platforms tend to optimize toward whoever converts most cheaply, which skews toward existing regulars. A channel that looks like a strong performer may just be counting returning customers' repeat visits. Conversely, a channel that looks unremarkable may be bringing in the most new customers. Splitting new from returning is what lets you tell them apart.
You don't need to build a perfect measurement system all at once. Just tag with UTM, line up your own revenue, and split new from returning. Aligning these three alone makes "which ad truly created sales" visible.
RevenueScope solution
Not being able to tell which ads worked, and numbers swinging too much to judge, share one root: there's no common yardstick connecting ads to revenue, so everything is visible only through each platform's self-report.
RevenueScope does not ask you to enter ad spend. It is not a tool for setting up complicated attribution models. Instead, using its own tracking, it removes duplicates and aligns each channel's real revenue on one screen. Rather than the figures each platform claims separately, it aligns every channel by where the buyer last came from (Last-touch) — one common yardstick.
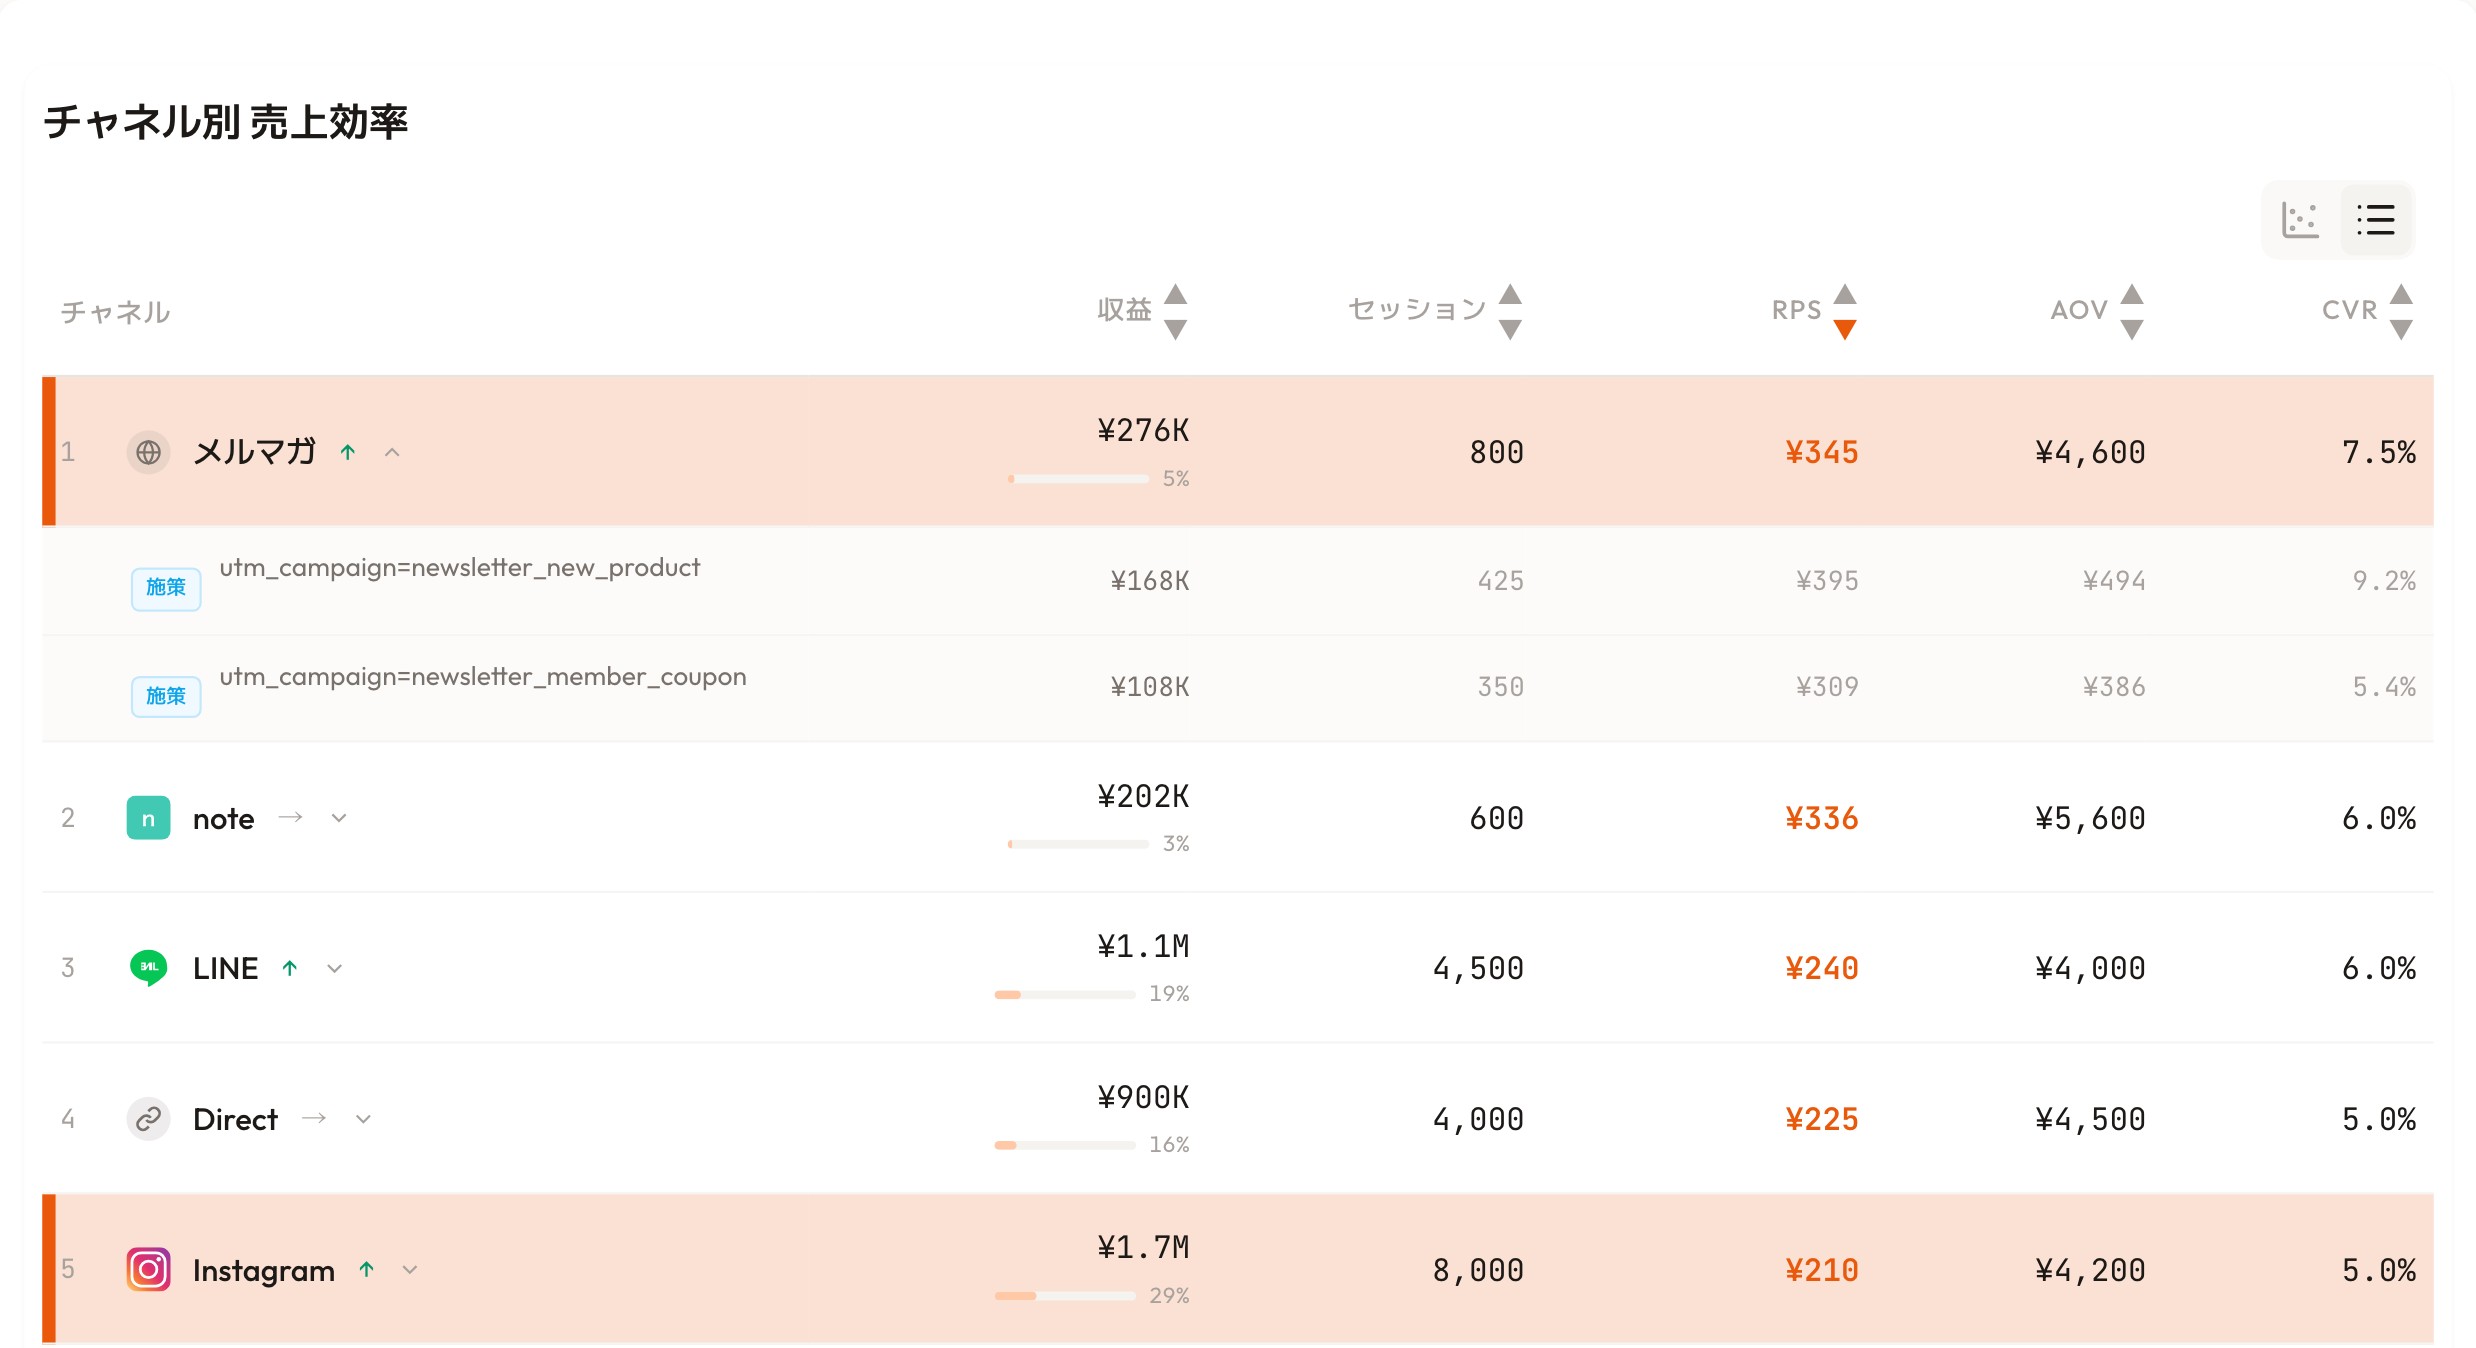
RevenueScope's dashboard (the display uses demo data). It puts your own revenue metrics side by side, by channel and ad campaign.
Take the screen above. The biggest revenue belongs to Instagram (¥1.7M). But by revenue per session (RPS), Instagram sits last at ¥210 — while the newsletter, with far smaller revenue (¥276K), tops the list at ¥345 RPS. In other words, the channel that sells most efficiently is the newsletter. Revenue size and revenue efficiency are different things, and only by lining them up on one yardstick can you tell them apart.
Open the newsletter row and you see differences even within one channel: the new-product campaign (newsletter_new_product) converts at 9.2%, the member-coupon one (newsletter_member_coupon) at 5.4% — roughly a 1.7x gap between campaigns of the same channel. Once you can see that, you can decide a concrete next move: shift budget toward new-product-style sends.
What RevenueScope does is not produce a return-on-ad-spend (ROAS) figure. It lines up which channels and which ads actually created revenue, on one common yardstick rooted in your own sales, so you can choose the next move by the numbers. That's the next step toward not wasting ad money.
FAQ#
Frequently asked questions#
Q. Where should I start with ad effectiveness measurement?
A. Start by adding UTM tags. Just putting a "which ad it came from" mark on your ad links lets you connect visits to channels. Then, if you align your own revenue by channel, you can judge without relying on dashboard numbers. Expensive tools and complex models aren't needed at first.
Q. Should I distrust the platform dashboard numbers?
A. Less "distrust" than "don't decide budget on them alone." The dashboard is a useful record of how many clicks and CVs happened. But it can't show your own revenue or whether buyers were new. Add your own revenue as one more angle, and you're less likely to misjudge.
Q. Is conversion tracking really necessary?
A. Yes. Without conversion tracking, you can't connect ads to sales at all. Run for months without this foundation and you'll spend budget never knowing which ad worked. Getting purchases and inquiries recorded correctly is the starting point for everything.
Conclusion#
Measuring ad effectiveness means judging whether the ads you ran actually drove sales. Not being able to tell which ads work isn't a skill problem — it's usually a missing foundation like conversion tracking and UTM tags. Platform dashboard numbers tell you "what happened," but only by reconciling them with your own revenue does the real effect become clear.
The first step isn't hard. Tag with UTM, line up your own revenue by channel and ad, and split new from returning. Aligning these three alone tends to surface "the ad that looked unremarkable but was actually bringing in the most new customers." Start by reviewing your main ads' real revenue from an angle other than the dashboard.
See which ads actually drive revenue, at a glance
Free up to 5,000 sessions/month, AI analyst included. No credit card required. Up and running in 5 minutes.
References#
- Google Analytics "[GA4] Default channel group" 2026
- Google Analytics "[GA4] Collect campaign data with custom URLs" 2024
- Google Ads "About conversion tracking" 2024