
Every month, a monthly report arrives from your ad agency. ROAS is 400%, conversions number so many, cost per click improved over last month — the results are lined up neatly. But take those numbers at face value to set next month's budget and you can misjudge. In most cases, what's in the report is the result the platform reported about itself, counted differently from the revenue you actually received. Even when there's a gap, it isn't that the agency is lying; it happens because the counting basis differs. This article covers why the report alone is risky, why the numbers look inflated, and how to "check" them against your own first-party revenue.
Table of contents
TL;DR#
- The ROAS and conversions in an ad agency's monthly report are, in most cases, results the platform reported about itself. They can diverge from the revenue you actually received, and deciding budgets from the report alone leads to misjudgment.
- There's a mechanism behind the inflated look: double counting, where each platform claims the same sale as its own; bots and invalid clicks mixed in; and revenue counted before returns.
- The way to check it yourself has three views: knowing platform ROAS and your own revenue per session are different things; reading real revenue by channel via UTM; and suspecting bots to clean up the numbers. The ideas are simple, but doing them by hand across channels every month is heavy.
1. Why the report alone leads to misjudgment#
Bottom line: the results in a monthly report are numbers the platform counted itself, and they can diverge from the revenue you actually received. So deciding budgets from the report alone steers money toward ads that aren't working.
An agency's monthly report is usually a summary of the figures the platforms (Google Ads, social ads, and so on) show in their dashboards. The ROAS (how many times the ad spend came back as revenue) and conversion counts listed there are the share the platform judged to be "revenue that happened thanks to my ad." But that judgment tends to be counted generously in the platform's favor. For example, it may count even the revenue of someone who came via a brand search and was going to buy anyway as an ad result.
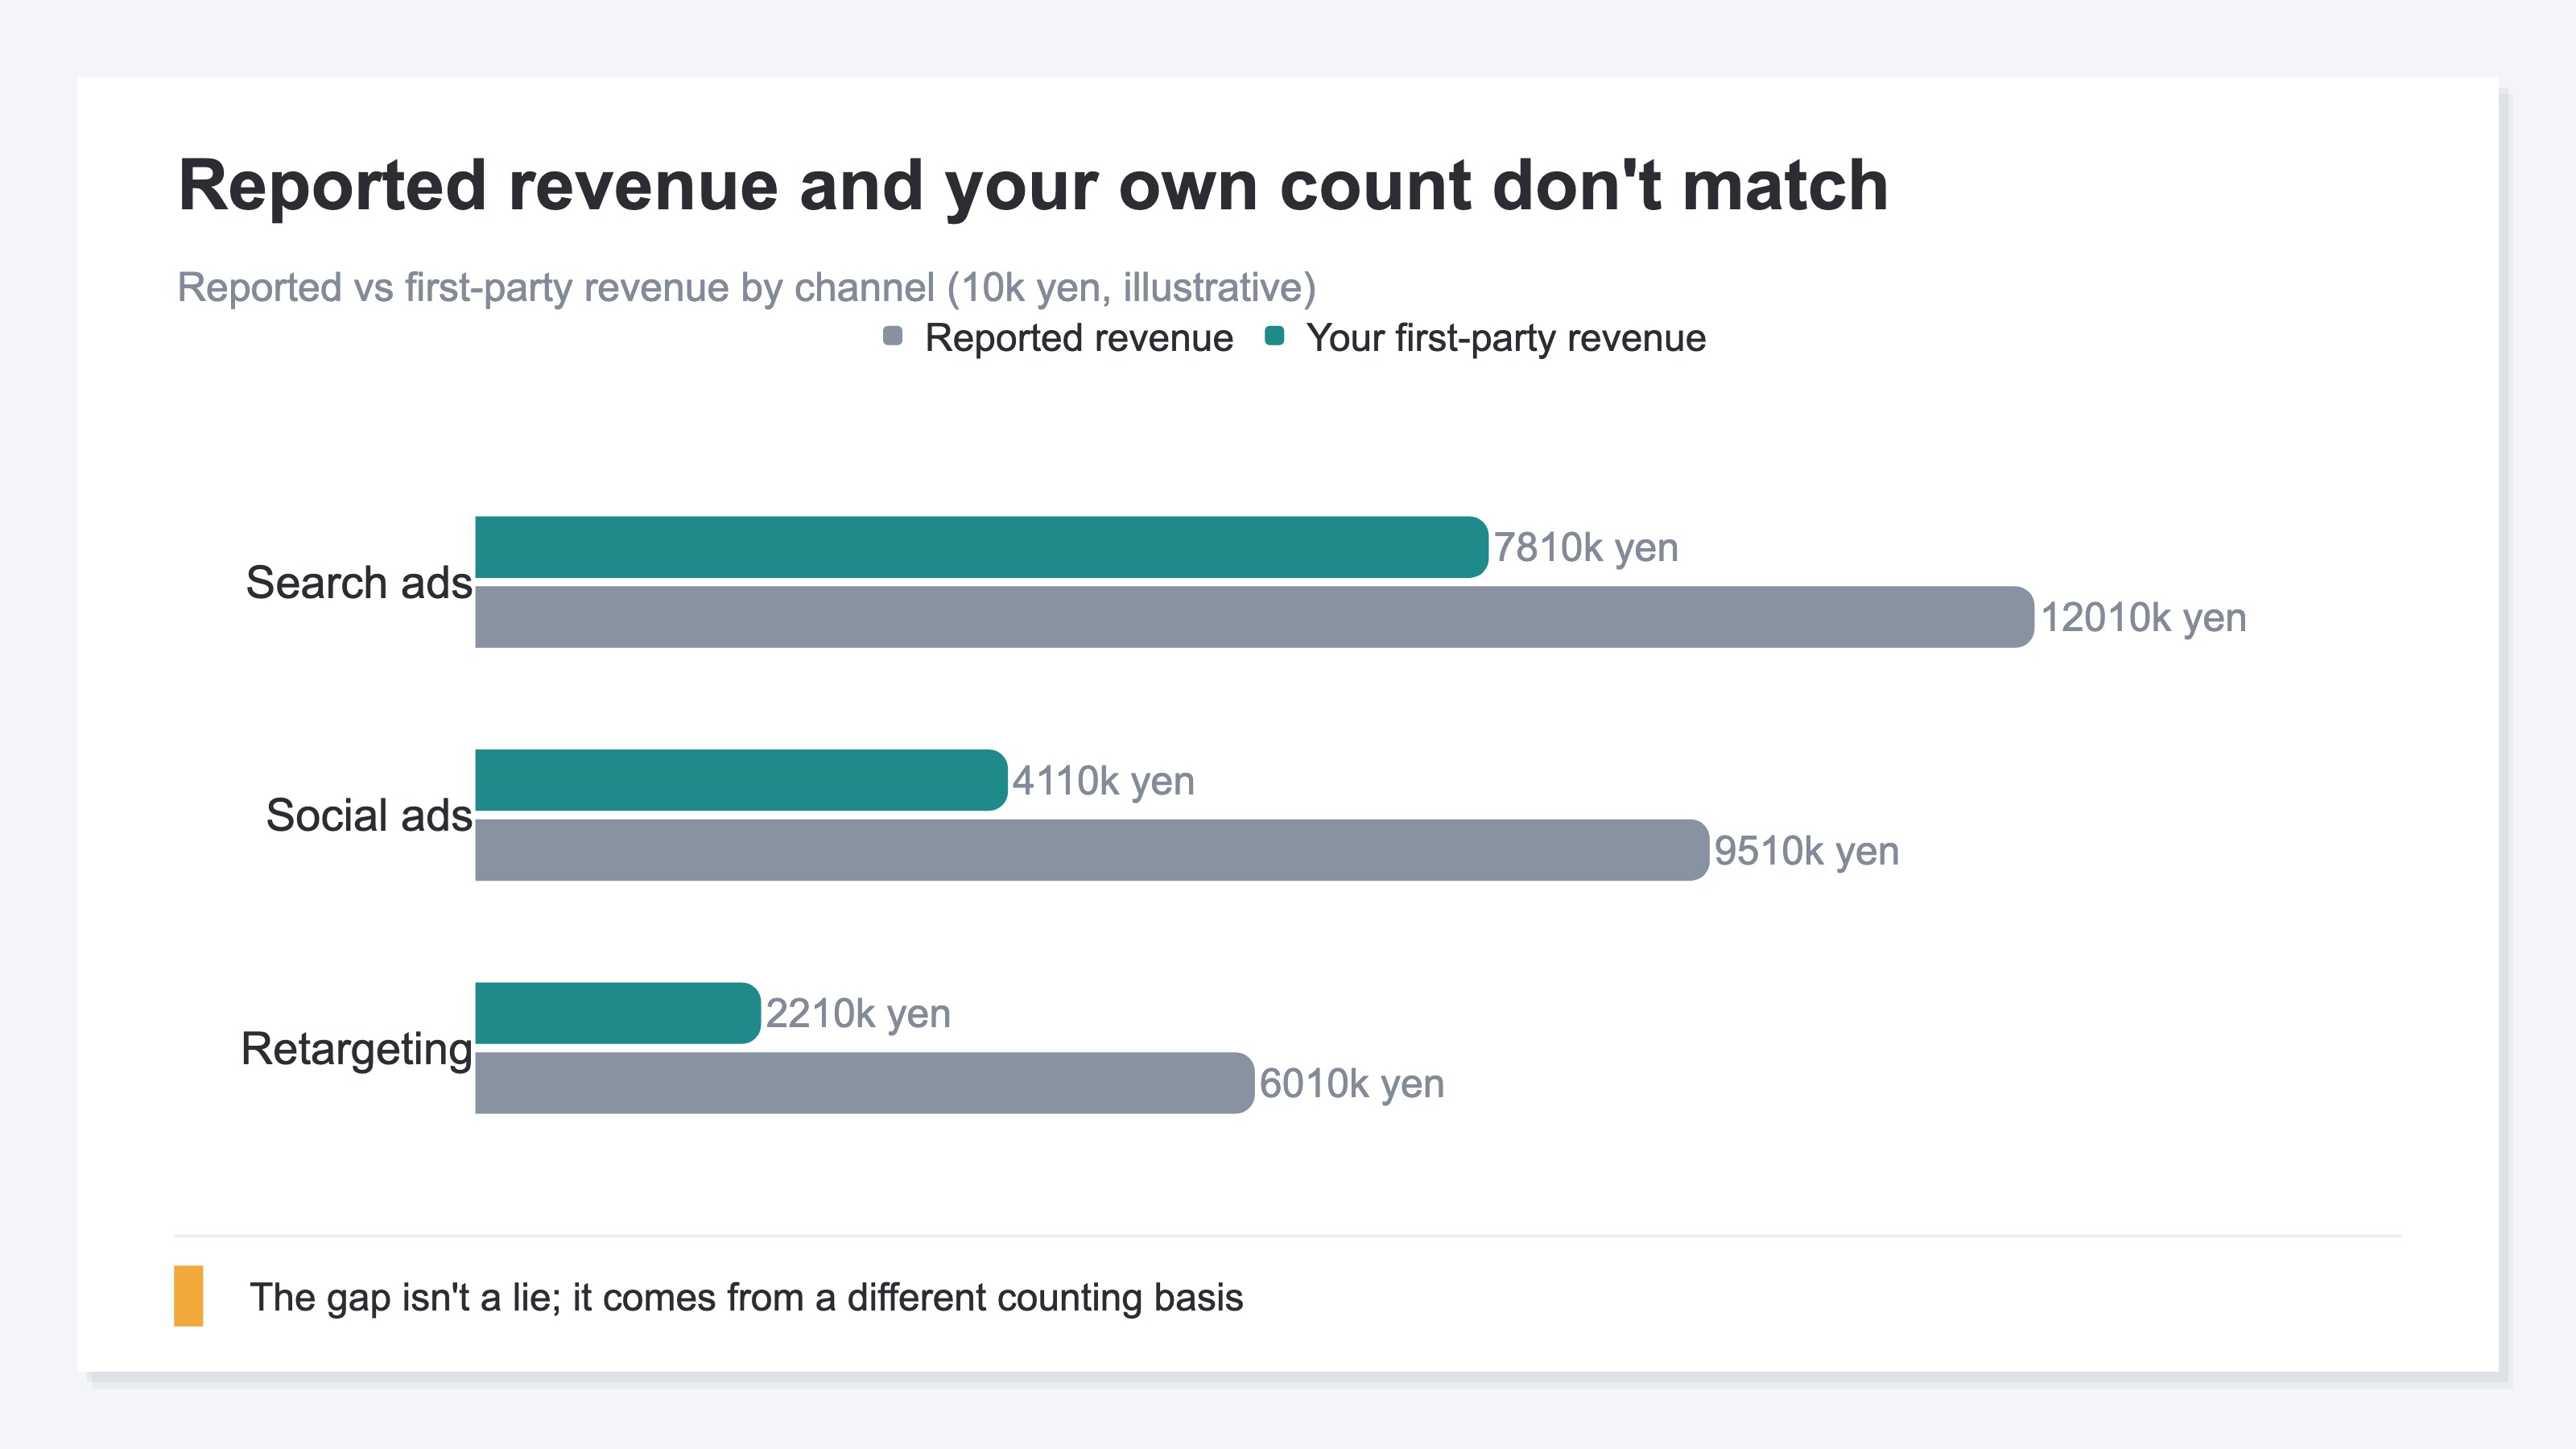
The chart below lines up reported revenue against the revenue you actually counted, by channel, as an illustration. For most channels, the reported number comes out larger. Decide to "raise budget on the channel with high reported ROAS" without knowing this gap, and you may steer money toward a channel that barely contributes to your own revenue. The report matters as a starting point, but don't make it the only answer.
2. How the numbers come to look inflated#
Bottom line: there's a reason the reported numbers look large — each platform double-counts the same sale, bots and invalid clicks mix in, and revenue is counted before returns.
First, double counting. Suppose one customer sees a Google ad, then a social ad, and then buys. Now both the Google report and the social report list that same sale as "my contribution." Add up the platforms' reports and the total comes out larger than the actual revenue.
Second, the quality of the traffic. The clicks and impressions in a report can include bots (programs that access automatically) and invalid clicks. It may look busy by count, but those aren't buyers.
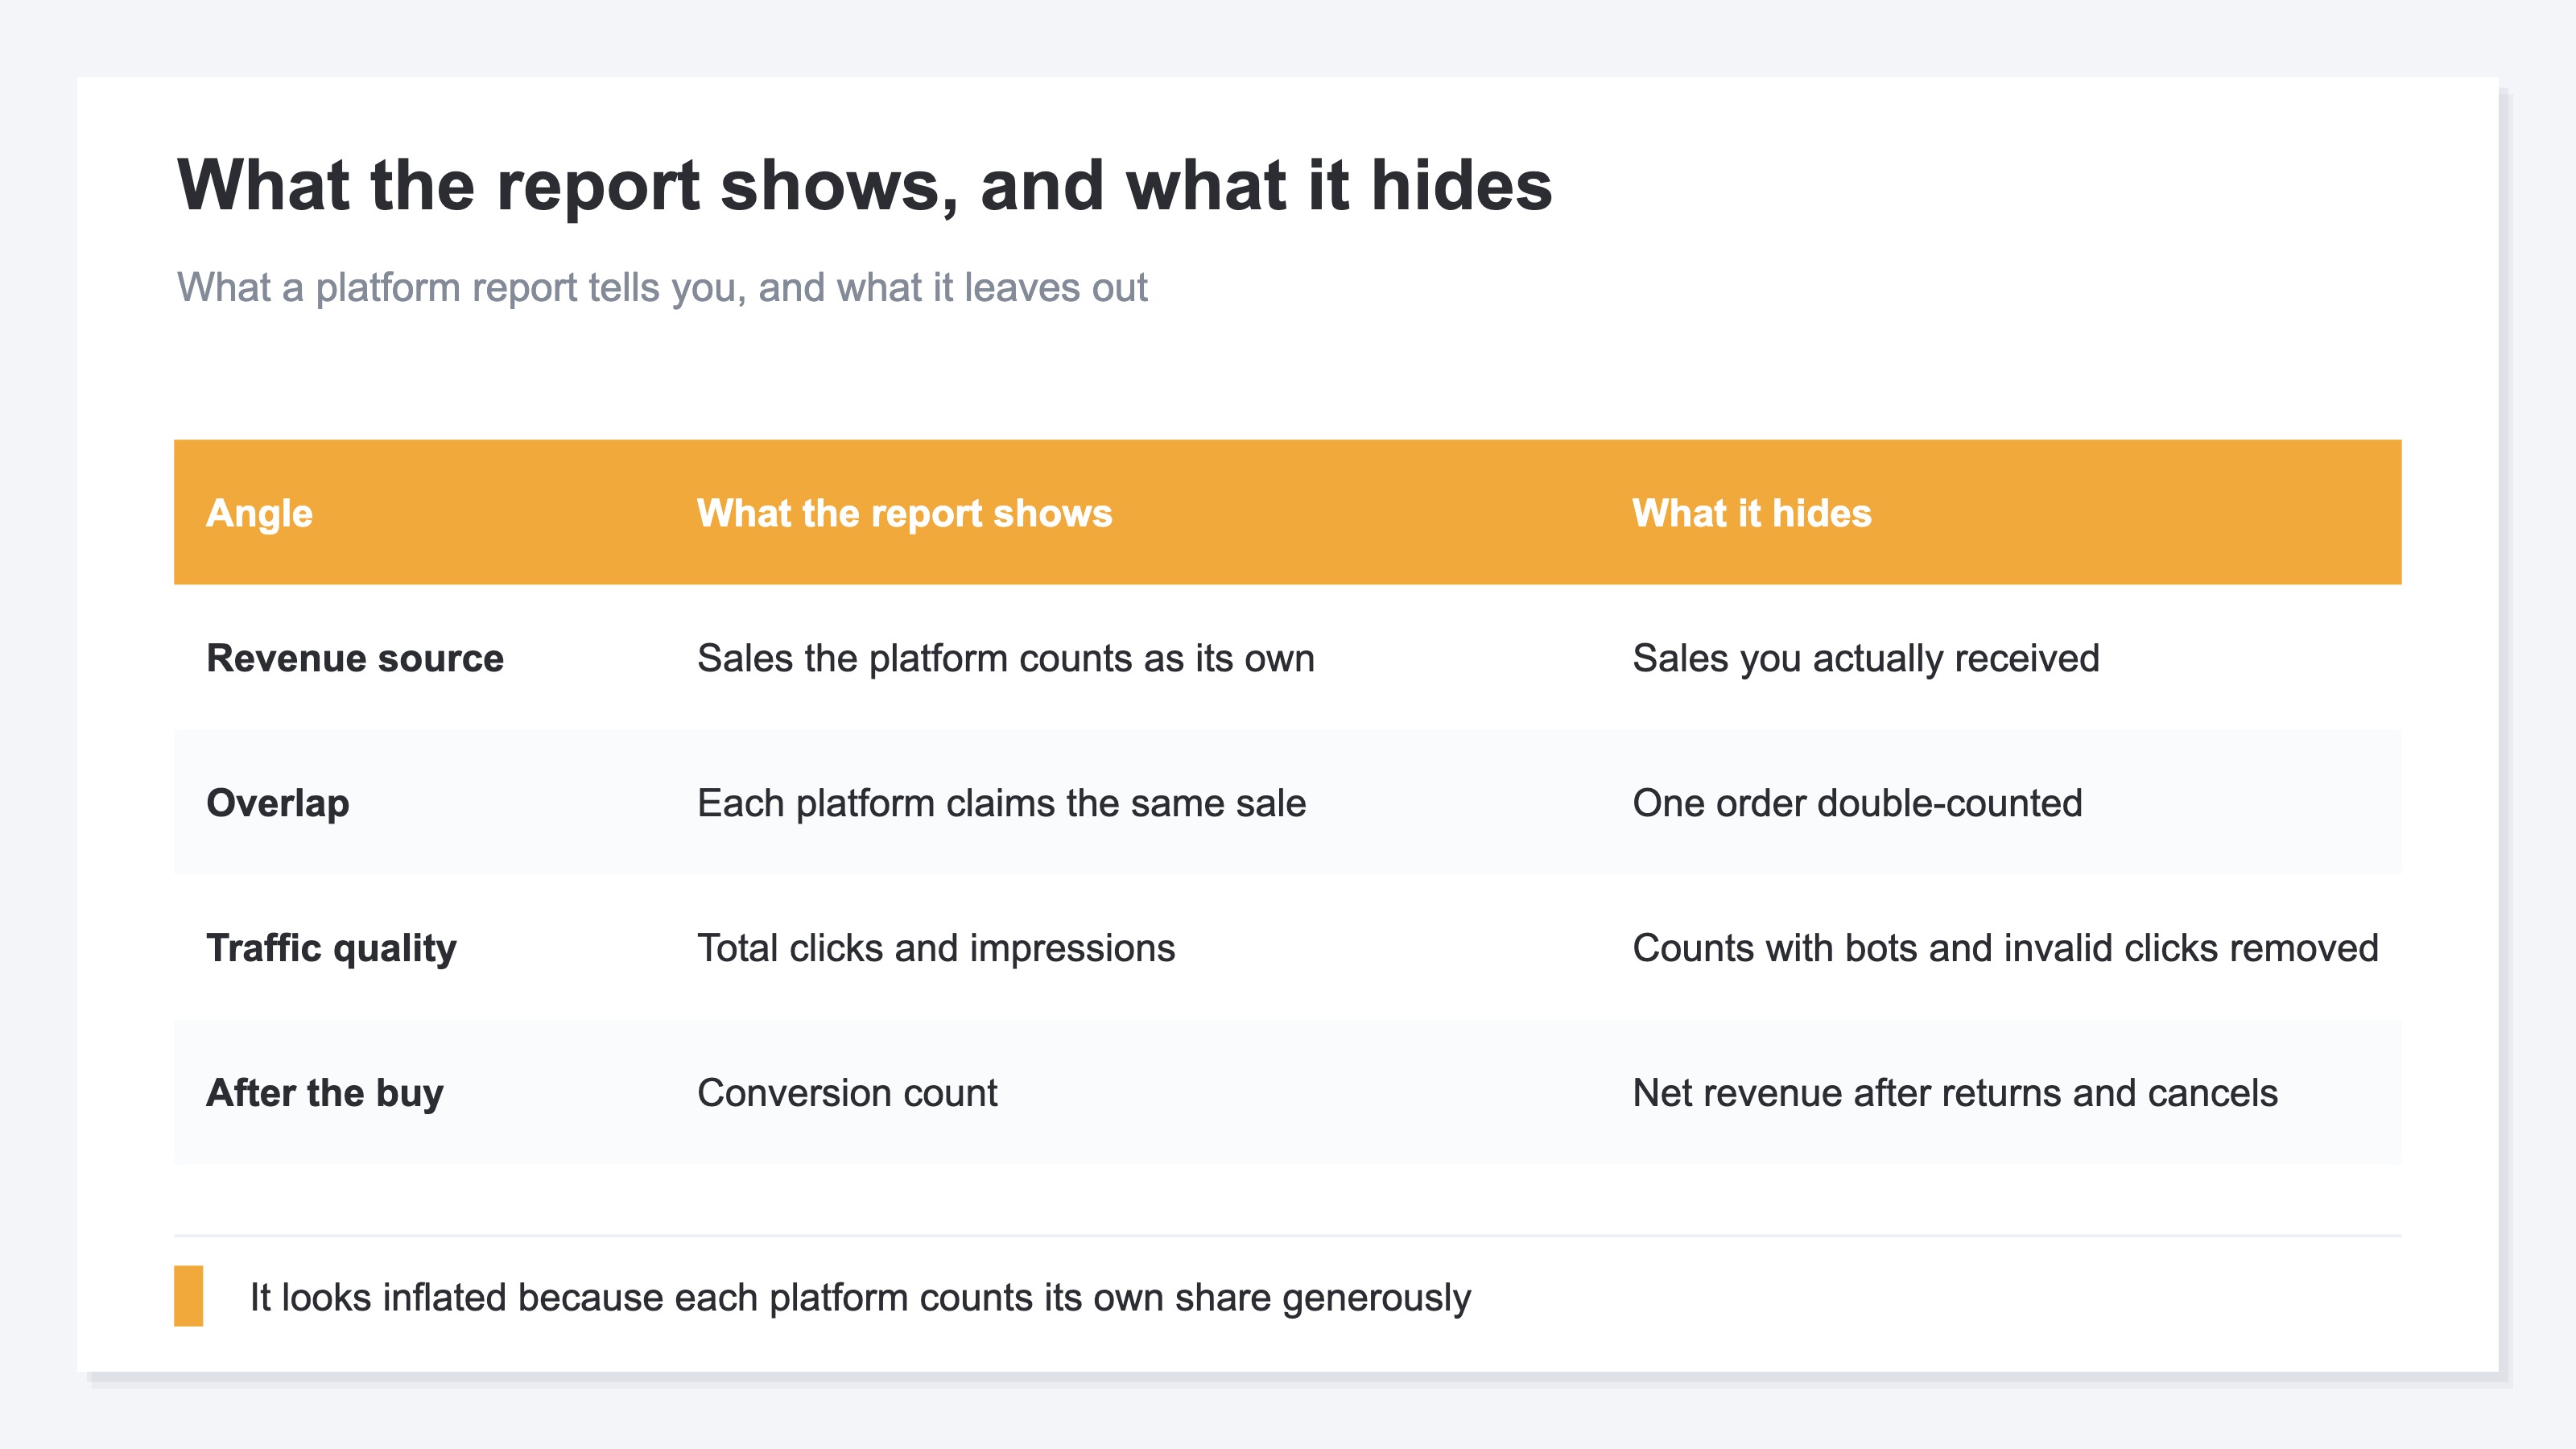
Third, what happens after the buy. A report's conversions are counted when the order comes in, but returns and cancellations afterward may not be deducted. That differs from the revenue you purely kept. The table below organizes what the report shows and what it doesn't.
3. Three views to check the report against your own data#
Bottom line: the checking method has three views — knowing platform ROAS and your own revenue per session are different things, reading real revenue by channel via UTM, and suspecting bots to clean up the numbers. The ideas are simple, but doing them every month is laborious.
First, change how you look. The ROAS a platform reports is "the revenue the platform counted against ad spend," but what you want to see is your revenue per session (RPS — how much one visit from a channel sold on average). A channel with high reported ROAS can come out low on your own RPS. Even for the same "efficiency," the meaning changes depending on who counted what.
Second, read real revenue by channel via UTM. A UTM is a small marker added to an ad link so you can later tell "which ad this visit came from" [3]. With the marker in place, you can total real revenue by channel and by ad in your own analytics. Without it, traffic from ads gets lost in "source unknown (Direct)" and can't be split by channel [4].
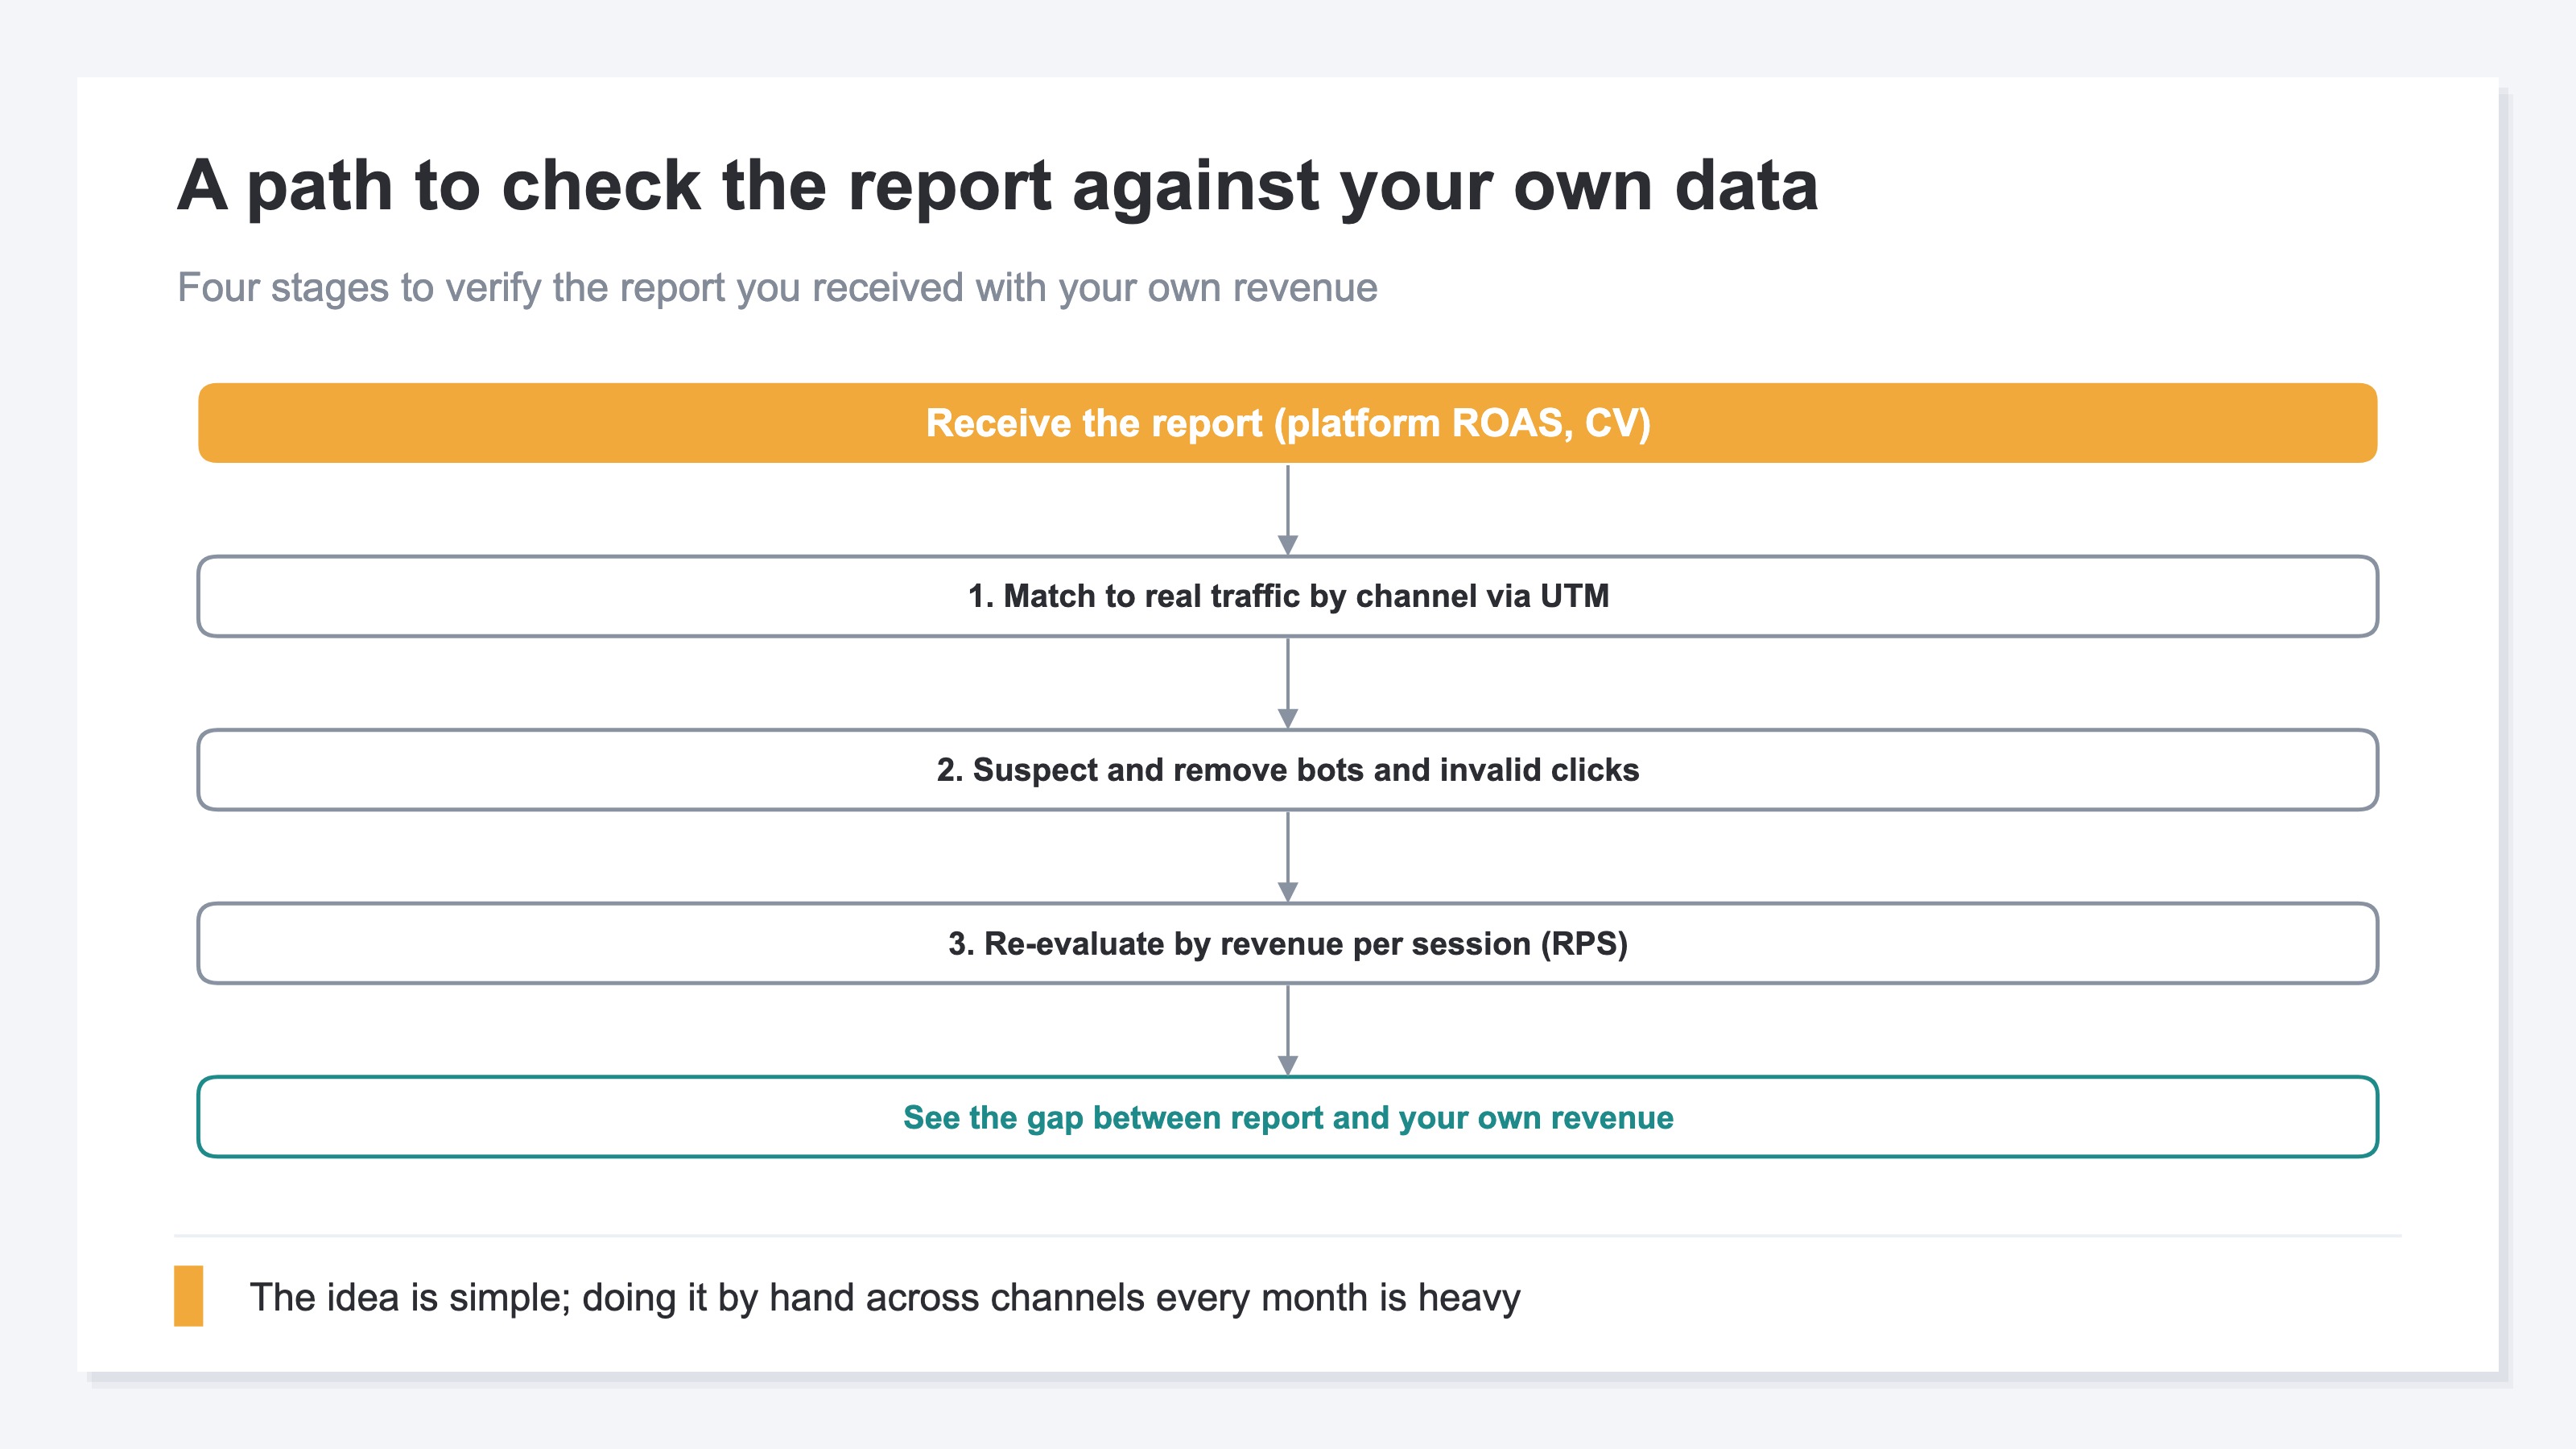
Third, suspect bots. If bots or invalid access mix into the traffic, visit counts get inflated and revenue per session looks lower than it really is. Recount with known bots removed, and the numbers come out clean [5]. The chart below is the path from receiving a report to checking it against your own revenue. The idea at each stage isn't hard. What's hard is doing it by hand, for every channel, every month.
RevenueScope helps
Trying to check a report against your own data, you hit two walls. One: without UTM setup, traffic from ads gets lost in "source unknown (Direct)" and can't be split by channel. Two: lining up the "reported numbers" and your "first-party revenue" by channel, with bots removed, is heavy as a monthly chore by hand.
RevenueScope takes over that check. It splits click traffic by channel, removes bots, and lets you compare each channel's traffic, revenue per session (RPS), conversion rate (CVR), and revenue in one view (figures shown are demo data). You can place the reported ROAS and the channel efficiency seen from your own revenue side by side and verify them.
| Channel | Reported ROAS | First-party revenue | Revenue per session (RPS) |
|---|---|---|---|
| Search ads | 400% | ¥780,000 | ¥412 |
| Social ads | 380% | ¥410,000 | ¥168 |
| Retargeting | 520% | ¥220,000 | ¥95 |
The point of this table is that the order of high reported ROAS and the order of high first-party revenue or RPS don't always match. Retargeting looks highest on reported ROAS, but is lowest on revenue per session. That hints it may be counting people who were going to buy anyway as an ad result. Search ads, meanwhile, has the highest RPS, generating revenue most efficiently per visit. Lining up the report and your own data in one view this way, you can decide "which channel to give next month's budget" against your own revenue, not just the reported number.
To be clear: RevenueScope counts only the click traffic that actually arrived and its revenue. It doesn't rebuild the ROAS the platform reports in its dashboard, and it doesn't calculate gross margin, post-return profit, or inventory. What RevenueScope takes over is preparing your side of the material for the comparison — getting to a state where, by channel, you can line up traffic and real revenue with bots removed. Which channel to invest in, in the end, is up to you.
FAQ#
Frequently asked questions#
Q. Does reported ROAS diverge from my own revenue because the agency manipulates the numbers?
A. In most cases, it isn't manipulation. The ROAS a platform reports is "revenue the platform counted as its own contribution," counted on a different basis from the revenue you actually received. For example, when several platforms each count the same sale as their own contribution, the total comes out larger than reality [1]. The gap isn't a lie; it happens because the axis of evaluation differs. That's exactly why checking against your own revenue is worthwhile.
Q. Can I trust the conversion count in the report as is?
A. The count itself is a record, but what each platform counts as a conversion is configured differently [2]. Some count it when someone merely touches the ad once more right before buying; some don't deduct net revenue after returns and cancellations. Match it against the revenue you actually kept, not the count alone, and you can judge more accurately.
Q. If I can do the check myself, don't I not need RevenueScope?
A. The idea is simple: add UTM, total revenue by channel, remove bots, and look at revenue per session. For trying it once, you can do it yourself. But totaling it by hand, for every channel, every month, is heavy work. The more channels you have, the more time the matching and double-count adjustment take. RevenueScope is positioned to take over that repetition all at once.
Conclusion#
An ad agency's monthly report is an important starting point for setting next month's budget. But the ROAS and conversions listed there are, in most cases, results the platform reported about itself, and they can diverge from the revenue you actually received. Make the report your only answer, and you steer money toward channels that aren't working.
There's a mechanism behind the inflated look: each platform double-counts the same sale, bots and invalid clicks mix in, and revenue is counted before returns. That's why checking the report against your own revenue matters.
The way to check it is to know that platform ROAS and your own revenue per session are different things, read real revenue by channel via UTM, and suspect bots to clean up the numbers. The ideas are simple, but doing them across channels every month is heavy. Keep the report and your own data lined up in one view, and you can set next month's budget by your own revenue, not by gut.
Related articles#
- Telling which ads worked, using your own revenue
- Platform ROAS vs MER: why dashboard ROAS lies
- Reading the efficiency of non-ad channels by revenue
- The trap of evaluating ads by last click alone
- How bots distort the numbers by channel
References#
- [1] Google Ads Help "About attribution models" (2024)
- [2] Google Ads Help "About conversion tracking" (2024)
- [3] Google Analytics Help "Collect campaign data with custom URLs" (2024)
- [4] Google Analytics Help "Default channel group" (2026)
- [5] Google Analytics Help "Exclude known bot traffic" (2026)
See which ads actually drive revenue, at a glance
Free up to 5,000 sessions/month, AI analyst included. No credit card required. Up and running in 5 minutes.
Start measuring for free